The potential impact of a removal of accountants from the Australian Government's medium to long-term skilled occupations list - Prepared for CPA ...
←
→
Page content transcription
If your browser does not render page correctly, please read the page content below
The potential impact of a removal of
accountants from the Australian
Government’s medium to long-term
skilled occupations list

Prepared for
CPA Australia

July 2017
Contents
Executive Summary .......................................................................................................... 3
Introduction ...................................................................................................................... 5
The Labour Market for Accountants ................................................................................ 6
The Model Deployed ........................................................................................................ 7
Modelling Process............................................................................................................. 9
MLTSSL Scenario One ..................................................................................................... 11
Insights from Scenario One Modelling of Impacts ......................................................... 13
           Impact on accountancy .......................................................................................13
           Wider impact .......................................................................................................15
           Impact on labour and GDP per capita .................................................................16
           Impact on occupations ........................................................................................17
Alternative Scenario Comparison ................................................................................... 20
Conclusions ..................................................................................................................... 27
References ...................................................................................................................... 29
APPENDIX: TECHNICAL APPENDIX ON MODEL CHARACTERISTICS ................................ 30

Report Authors

The principal authors of this report are Professor Glenn Withers, Professor of Economics at the
Australian National University and Dr Janine Dixon, Senior Research Fellow at the Centre of
Policy Studies at Victoria University.
Report management was also provided by Professor Peter Abelson, Managing Director of
Applied Economics Pty Ltd.

                                                                                                                                   2
APPLIED ECONOMICS                               www.appliedeconomics.com.au
Executive Summary
This report provides results from modelling the potential labour market and broader economic
impacts in the event of removal of accountants from the medium to long-term skilled
occupations list (MLTSSL).
The report first provides a brief review of the labour market for accountants and the nature of
skilled migration for accountants, then moves to model the impacts on the economy of
removal of accountants from the MLTSSL. Comment is then provided on the modelling analysis
and its significance.
The modelling finds impacts for accounting in terms of:
• a loss of accounting output
• a rise in accounting prices
• a decrease of exports of accounting services
• an increase in accounting import services
For the wider economy there is:
• a reduction of GDP
• a reduction of GDP per capita
The size of these effects is shown to vary with the response to the ongoing reduction in
MLTSSL entry. The more the alternative methods of accounting supply operate, the less are
the impacts on accountancy. This is shown by having two scenarios where the MLTSSL
accountancy cuts are made and compared with a baseline without any MLTSSL changes for
accountancy.
The cut assumed for the scenarios applies to migrants entering under the ANZSCO categories
221 and 132 for accountants. In this study, this is projected to to total 6547 in 2018 (up from
6108 in 2016) if the MLTSSL list does not change for accountants.
The two scenarios are:
• Scenario One where the removal is gradually responded to by domestic accounting
supply (by transfer from other occupations plus new graduates) and by the use of
other migrant pathways for some accountants. Over three years, supply is restored
here.
• Scenario Two which maintains an ongoing reduction in accountants equal to the
migration loss, with no new recovery or response to the MLTSSL cut in accounting
numbers, though total population remains as for the base case with non-accounting
migration increasing to fill the gap.
The scenarios are modelled for this report using the Victoria University Employment
Forecasting (VUEF) model which compares the scenarios with a baseline where accountants
remain on the MLTSSL.
Chart A shows the impact found for accounting price and output across the range of response
represented through the two scenarios.
Chart A. Projected impacts of MLTSSL changes on accountancy: price and output effects,
scenarios 1 and 2, 2017-2024
3
APPLIED ECONOMICS www.appliedeconomics.com.aupercentage deviation from baseline
2017 2018 2019 2020 2021 2022 2023 2024
Accounting output, S1 Accounting price index, S1
Accounting output, S2 Accounting price index, S2
In both scenarios incumbent accountants will gain some wage benefits. But this also
represents a major cost of service increase, and wage increase pressure on close substiute
managers and professionals in Scenario One It also represents reduced service output in
accounting, and similar pressure elsewhere, as labour moves raise costs in source occupations.
These cost rises plus reduced per capita income overall with reduced efficiency (and reduced
population for Scenario One) mean further that wages in trades and labour areas are adversely
affected, including especially semi-skilled and labourers as these are least able to take
advantage of job openings created by the reduction in supply of accountants.
For the economy as a whole, the loss of MLTSSL migrant accountants will reduce GDP and GDP
per capita. Accountants are relatively high productivity workers and the policy change reduces
their proportion in the work-force. Hence a fall in GDP per capita. And population too can fall if
there is no replacement through other migration, also affecting GDP through scale effects in
this Scenario One case. GDP per capita also falls if the participation rate falls.
Chart B summarises these effects:
Chart B. Comparison of GDP and GDP per capita results, scenarios 1 and 2, 2017-2024
4
APPLIED ECONOMICS www.appliedeconomics.com.au2017 2018 2019 2020 2021 2022 2023 2024
0.00
percentage deviation from baseline
-0.01
-0.02
-0.03
-0.03
-0.04 -0.05
-0.05 -0.05 -0.05 -0.05 -0.05
-0.06
-0.07
-0.08
-0.09
-0.11
-0.12 -0.12 -0.12 -0.12
GDP, scenario 1
GDP per capita, scenario 1
GDP and GDP per capita, scenario 2
In numbers, removal of some 6000 accountants from MLTSSL each year from 2017 to 2024
leads by 2024, to an estimated loss of GDP in the range of 0.08 - 0.12 per cent and of GDP per
capita of 0.05 -0.08 per cent compared to the baseline where the intake of accountants is
maintained in the MLTSSL.
With an inflexible scenario on the labour supply side contrasted with a three-year adjustment
track alternative scenario in this modelling, the outcome is likely to be within these bounds.
That is, because of this modest policy change regarding around 6000 accountants in migration
entry restriction, annual real ($2016) GDP would be $1.5- $2.5 billion less than it otherwise
would have been in 202
Introduction
Applied Economics Pty Ltd recently analysed the labour market conditions for accountants, the
role played by skilled migrants in addressing current and emerging labour market shortages
and gaps, and the international education impacts of the same (Applied Economics, November
2016)
This analysis concluded that there were major ongoing shortages in supply of accountants,
especially experienced accountants, and that immigration of accountants for Australia was a
crucial element in ensuring an adequate supply of these skills essential for national
development.
It was evident that a danger to this contribution by accountants was the discrete ‘on/off ’
nature of the current listing process used for assessing much immigration of skilled migration
applicants. Were a delisting to be considered for accountants, albeit mistaken, under the
present scheme, there is concern at how much Australian jobs and growth could be
compromised. An alternative ‘sliding point’ scale for occupations was recommended as a
desirable reform for selection.
This new report has been commissioned for Applied Economics to work with Victoria
University’s Centre of Policy Studies (CoPS) to model these potential labour market and
5
APPLIED ECONOMICS www.appliedeconomics.com.aubroader economic impacts in the event of removal of accountants from the medium to long-
term skilled occupations list (MLTSSL), documenting the potential effects in detail.
This report first provides brief labour market background for accountants and the nature of
skilled migration for accountants, then moves to model the impacts on the economy of
removal of accountants from the MLTSSL list for skilled migration. The accounting migrant loss
persists for the economy for every year.
The modelling uses the ‘state of the art’ Victoria University Employment Forecasting (VUEF)
model and compares simulations for when accountants remain on the MLTSSL, and where
accountants are removed from the MLTSSL. Some commentary is provided on the analysis and
its significance.
The Labour Market for Accountants
In the recent Applied Economics analysis of the labour market for accountants it was found
that, in the short run there were evident shortages of accountants in specific cases and for
specific skills especially for accountants with more experience (Applied Economics, November
2016). These short-term shortages were seen by the study as best being dealt with through
short-term visa arrangements. It is therefore appropriate that proposed visa changes
announced in May 2017 and as amended in June 2017, retained accountants on the short-
term skilled occupations listing (STSOL) too for such visas.
At the same time, in the medium term of 10 or so years, total openings for accountants in
accountant jobs of around 11,000 per annum appear likely. In addition there is significant but
unquantified demand for persons with accounting qualifications and skills working in
management or related financial and other services.
Turning to domestic supply, domestic completions of accounting Bachelor degrees are about
2,500 per annum and not increasing. Domestic completions of accounting majors in all degrees
are averaging about 4,700 per annum. But many of these graduates choose careers other than
accounting.
Traditionally, immigrants with accounting skills have numbered about 8,000 per annum,
including some who do not seek work formally as accountants. This varies over time. Through
the early 2000’s, migration of accountants under the skilled permanent entry migration
programme increased steadily, and after a brief downturn during the global financial crisis,
peaked at over 15,000 migrants in 2010-11. Australia’s intake of migrant accountants has
since remained in the range of 6,500 to 8,000 per annum (Figure 1).
The large gap between the forecast openings for accountants as accountants and other
demands for accountants, and domestic supply has to be filled by international students
staying in Australia and/or by new migrants. The issues are particularly acute in, though not at
all limited to, regional areas. Most of those with accounting qualifications find employment
relatively quickly in jobs commensurate with their skills.
Currently there are over 39,000 international students enrolled in degrees with accounting
majors (Bachelor and Masters). They contribute over $1.7 billion to the Australian economy of
which almost $1 billion is Australian universities’ fee income (Applied Economics, November
2016).
6
APPLIED ECONOMICS www.appliedeconomics.com.auAdditional benefits include the positive contribution made directly to the economy by
overseas-born but Australian-trained accountants who choose to migrate to Australia. If
significant changes were to be made to eligibility of foreign accountants for migration to
Australia this would certainly have major impacts on universities.
The further impacts on the wider economy of such changes is the subject of this present
report, where simulation modelling of removal of accountants from the MLTSSL skilled
migration list is provided. With exclusion, a prospect of significant short-term and long-term
shortage is found.
20,000
15,000
10,000
5,000
0
132211 Finance Manager 221111 Accountant (General)
221112 Management Accountant 221113 Taxation Accountant
221212 Corporate Treasurer 221213 External Auditor
221214 Internal Auditor
F IGURE 1: A USTRALIA 'S INTAKE OF ACCOUNTANTS UNDER THE SKILLED MIGRATION PROGRAMME
The Model Deployed
To undertake this modelling a well-attested economic model is used. This is the Vic Uni (VU)
model which is the core structure used for the analysis. This is the descendent of the well-
known Monash model and is thoroughly documented (Dixon and Rimmer 2002). It is a so-
called ‘computable general equilibrium’ (CGE) model allowing simulations of the impact of
major economic changes, including policy changes, and provides considerable detail of these
impacts through-out the economy.
CGE modelling in Australia is at a best practice frontier globally and Australia was one of the
early leaders in this method of analysis. Such models allow for the detailed interaction of
effects of changes imposed on the model and can provide considerable examination of the
component implications. This modelling is widely used for informing public policy in Australia.
Importantly for the CPA Australia exercise, the Victoria University Employment Forecasting
(VUEF) model extends the VU model by adding significant detail on occupation and skills.
Building on the standard CGE framework in which the demand for labour is described through
industry production relationships, VUEF also links the supply of labour by occupation to the
growth rates of the workforce classified by skill including experience level (J.Dixon 2016;
J.Dixon and Wittwer 2015). Details are at the Appendix to this report.
7
APPLIED ECONOMICS www.appliedeconomics.com.auThis approach makes explicit the supply side of the labour market, as well as demand. The
VUEF extension is integrated into the Vic-Uni model, thereby enabling feedback within the
model from the consequences of labour supply shortages or surpluses. Although markets are
assumed to clear, so that shortages and surpluses never eventuate, potential supply shortages
shortages or surpluses are indicated by wage pressures in the model.. Importantly for this
report, the model represents occupational supply constraints at a fine level of detail.
The Vic-Uni model with the VUEF extension produces annual forecasts over an eight-year
horizon of employment cross-classified by industry (115 input-output industries) and
occupation (97 ANZSCO minor groups), and by skill (56 groups) and occupation
The modelling results are provided from a “what-if” analysis – that is, the results from the
scenarios used here are contingent on the assumed changes in the underlying composition of
the workforce. This detail on the balancing of supply and demand is highly informative for
policy.
8
APPLIED ECONOMICS www.appliedeconomics.com.auModelling Process
In this report, we present modelling scenarios for policy change which remove all present
skilled permanent migrants entering under the MLTSSL arrangements as Accountants. We
examine the potential impacts of the removal of accountants from the MLTSSL.
This is presented as a deviation from a baseline where there is no change in the treatment of
accountancy in the MLTSSL. This base is an extrapolation flowing from direct consideration of
actual trend forces.
This baseline can then be compared with new policy scenarios that arise by instead assuming
there is now no MLTSSL accountancy listing. The policy scenarios differ here according to what
is assumed about responses, but both remove MLTSSL accountancy listing.
In illustrative scenario 1, the removal of accountants from the MLTSSL is not explicitly offset by
an increase in other migration, so the workforce declines in size. However, in subsequent
years, the supply of accountants is assumed to recover, through a combination of migration
under alternative visas and greater supply from the domestic population. As such, growth in
the population and in the supply of accountants both recover, with the supply of accountants
recovering slightly more quickly.
In illustrative scenario 2, the removal of accountants from the MLTSSL manifests as a
permanent reduction in the growth rate of accountants. The growth rate of the population is
assumed to be unaffected, meaning that while total immigration is unchanged, the
composition of immigration is permanently altered. There is no response though in the
relevant time period through domestic education supply or alternative migration pathways.
These policy change scenarios are further described below. For the baseline itself, a standard
base case scenario is projected for the VUEF model. This represents the situation where
accountants remain on the MLTSSL. In this case model forecasts are generated by solving the
model in response to likely structural change, updating the database from one financial year to
the next through a series of simulations.
“Shocks” to the model so as to provide for a common baseline going forward constitute the
assumptions made for the baseline case scenario and are based on a combination of:
1. calibration to forecasts from expert bodies, including:
• Bureau of Resources, Energy and Environment for forecasts on value and
volume of commodity production and exports;
• a combination of ABS and state demographer forecasts for state population
forecasts;
• Intergeneration Report forecasts of participation rate;
• Commonwealth forecasts from the federal budget on taxation and
government expenditure;
• Commonwealth forecasts from the federal budget on other key measures
including the terms of trade and the unemployment rate;
2. an assumed rate of productivity growth based on recent experience in Australia and
similar countries;
3. significant announced changes in economic activity, for example, the closure of motor
vehicle manufacturing plants in Victoria and South Australia;
9
APPLIED ECONOMICS www.appliedeconomics.com.au4. likely changes in construction activity revealed in building approval data; and
5. the continuation of structural trends revealed in the database calibration process.
This projection therefore will reflect likely economic drivers and their resultant demand and
occupational supply trends, with these being derived for accountants including through
MLTSSL- based migration specification being included.
10
APPLIED ECONOMICS www.appliedeconomics.com.auMLTSSL Scenario One
Given the baseline, to examine a policy change on accountancy migration, further shocks are
then applied to the model to represent the alternative hypothetical scenario in which
accountants (ANZSCO groups 221 and 132) are removed from the skilled occupation list from
2018. Otherwise here the same baseline assumptions, indicated above, continue to apply,
except for these specified changes in MLTSSL listing for accountants and changes that flow
through the model’s representation of adjustments to this new policy.
For understanding the effects of the new MLTSSL policy setting as compared to “all other
business as usual” as embedded in the baseline, it should be recognised that the accounting
profession includes two related but different groups of people. These are people qualified and
working as accountants and people with accounting qualifications (e.g. majors in accounting in
mixed degrees) using their skills other than as an accountant. The qualification definition is
especially pertinent in examining economic consequences of reduction.
For this study, individuals qualified as accountants are defined as those with a level of skill
commensurate with an Australian Qualifications Framework (AQF) Level 7 or higher
qualification (AQF 2009) who nominate their highest qualification as being in the field of
accounting.
By contrast, those working as accountants are defined as those working in occupations defined
within the Australia and New Zealand Standard Classification of Occupations (ANZSCO, 2006)
four digit groups, namely:
2210 Accountants, Auditors and Company Secretaries nfd
2211 Accountants
2212 Auditors, Company Secretaries and Corporate Treasurers
2220 Financial Brokers and Dealers, and Investment Advisers nfd
2221 Financial Brokers
2222 Financial Dealers
2223 Financial Investment Advisers and Managers
The specific new Scenario One extra “shocks” imposed for the new SMTSSL Scenario one in
this study to reflect the new policy are:
1. SMTSSL Categories reduced:
• The supply of workers of the skill type “Bachelor Degree – Management”, which
encompasses bachelor-level accounting qualifications, is reduced, by 6547 persons in
2018 (representing anticipated migration of accountants in 2018), and by smaller
amounts in 2019 and 2020 (assuming that the reduction in migration is gradually
replaced by locals and migrants on other programs).
• The supply of workers of the skill type “Bachelor Degree – Management” TO the #-digit
ANZSCO occupation 221 Accountants, Auditors and Company Secretaries is reduced by
11
APPLIED ECONOMICS www.appliedeconomics.com.au6401 in 2018. This is accommodated by changing the preferences of this skill type for
this occupation. Thereafter, preferences remain at the 2018 settings, and the
employment choices of this skill group are made endogenously.
• Similarly, the supply of workers of the skill type “Bachelor Degree – Management” TO
the 3-digit ANZSCO occupation, Business Administration Managers is reduced by 146 in
2018.
2. Recovery through domestic supply and alternative migration pathways:
• The total working age population is reduced by 6547 in 2018 and smaller amounts in
2019-2021 (assuming the reduction in migration is gradually replaced by migrants on
other programs). Note the working age population “recovers” more slowly than the
supply of bachelor degree-management workers because we assume some of the
recovery of the “Bachelor degree – management” skill group is supplied from the
domestic population.
• Total employment is reduced by the same amount as the working age population, i.e.
6547 in 2018 and smaller amounts thereafter.
3. Consequent Labour Market Adjustments:
• Model closure – with total employment and the working aged population both
determined exogenously, the model endogenously determines the unemployment
rate. With total employment assumed to follow the growth path exogenously
imposed, the model endogenously determines the real wage.
Figure 2 summarises the resultant significant changes assumed in total employment and in
working age population for accounting workers.
2017 2018 2019 2020 2021 2022 2023 2024
0
persons, cumulative deviation from
-6547
baseline
-10547
-11047
-12547 -12547 -12547 -12547 -12547
-14047
-15547 -15547 -15547 -15547
Total employment, Bachelor degree in management Working age population
F IGURE 2: NEW SCENARIO ASSUMED FOR WORKING AGE POPULATION AND EMPLOYMENT OF WORKERS
WITH A BACHELOR DEGREE IN MANAGEMENT
12
APPLIED ECONOMICS www.appliedeconomics.com.auInsights from Scenario One Modelling of Impacts
We describe here the impacts in key dimensions of the economy resulting from the reductions
specified in removal of accounting from the MLTSSL. As seen in Figure 2, there is a migration-
related reduction in accounting employment of over 12,000 and of the total so qualified of
over 15000.
What these reductions do for the accounting sector and the wider economy assuming some
domestic supply response and other migration pathway response, is the subject of this section
of the report.
Impact on accountancy
A key feature of accounting is that more than 75 per cent of accounting services are into
intermediate production, and a further 14 per cent are sold into investment. Accounting
services face little competition from international imports. As such, demand for accounting
services is very inelastic.
When growth in the supply of labour to accounting services is reduced, growth in accounting
output slows. Because demand for accounting services is very inelastic, this leads to
accelerated growth in the price of accounting services, which is passed on to consumers of
accounting services, as is seen in Figure 3.
percentage deviation from baseline
1.08 1.06 1.10 1.10 1.08 1.05 1.03
0.00
-0.35
-0.45 -0.43
-0.50 -0.51 -0.51 -0.51 -0.51
-0.57 -0.64 -0.64
-0.64 -0.65 -0.64
2017 2018 2019 2020 2021 2022 2023 2024
accounting price index
accounting output
accounting employment (wage bill weights)
F IGURE 3: IMPACT ON ACCOUNTING OUTPUT, PRICE INDEX AND EMPLOYMENT
In Figure 3, the quantity of accounting output falls slightly, but because of the price increase,
there is an increase in revenue in the accounting industry. Also, there is a temporary increase
in capital rental returns in accounting but this is eliminated by an increase in investment.
Imports of accounting services increase but from a small base (Figure 4).
13
APPLIED ECONOMICS www.appliedeconomics.com.aupercentage deviation from baseline 3.32 3.43 3.37 3.31 3.26 3.21
3.07
1.08 1.06 1.10 1.10 1.08 1.05 1.03
0.80
0.00 0.05 0.08 0.06 0.05
-0.19
-0.34
2017 2018 2019 2020 2021 2022 2023 2024
accounting price index accounting wage index
accounting capital rental price index
F IGURE 4: IMPACT ON ACCOUNTING PRICE INDEX, WAGE INDEX AND CAPITAL RENTAL PRICE INDEX
For any year, cumulative deviation results can be interpreted as the difference between the
“policy” scenario and the baseline (what otherwise would have been). For example, in Figure 3
we see that the result for the accounting price index in 2024 is 1.03. This means that in 2024,
the accounting price index is 1.03 per cent higher than it otherwise would have been in 2024,
as a result of the changes listed above.
Figure 5 shows two measures of employment in the accounting industry. The “wage bill
weights” measure calculates employment as an aggregate of all occupations weighted by
wages, while the “persons” measure is a simple headcount of employment. The implication of
the difference between the measures is that the reduction in employment is biased towards
university-qualified accountants whose wage is higher than the industry average. Note that
the industry as a whole includes lower-cost activities such as book-keeping.
0.15
percentage deviation from
0.07
0.00 0.00 0.01 0.00 0.00 -0.01
2017 2018 2019 2020 2021 2022 2023 2024
-0.13
baseline
-0.24
-0.31 -0.32 -0.33 -0.33 -0.34
-0.45
-0.57
-0.64 -0.65 -0.64 -0.64 -0.64
accounting employment (wage bill weights) accounting capital stock
accounting employment (persons)
F IGURE 5: IMPACT ON INPUTS TO ACCOUNTING
14
APPLIED ECONOMICS www.appliedeconomics.com.auFigure 5 also shows a small response in the capital stock of the accounting sector. In the VUEF
model, capital response always lags by a year. The increase in the rate of return in capital in
2018 stimulates investment in 2018, delivering a larger capital stock in 2019.
Aggregate demand for accounting is inelastic because of the high proportion of sales to
intermediate usage. The production structure of the model imposes ‘Leontief technology’, ie
inputs in fixed proportions, on intermediate use, meaning that intermediate demand is
unresponsive to price. Demand for intermediate inputs is therefore reduced only if industry
output is reduced. Demand for domestically produced intermediate inputs may be replaced
by imports.
In the case of accounting inputs, imports do increase, but do not comprise a significant
proportion of supply. Export demand for accounting services is more responsive to price.
Exports comprise only a small proportion of the sales of accounting services, but a reduction in
exports of accounting services accounts for most of the decline in accounting output.
The three sources of reduced sales – a smaller domestic market, a reduction in the domestic
share of the domestic market, and a reduction in exports – are illustrated in Figure 6 below.
2017 2018 2019 2020 2021 2022 2023 2024
0.00
contribution to percentage
-0.12 -0.13
deviation from baseline
-0.17 -0.19 -0.18 -0.16 -0.14
-0.05 -0.05 -0.05
-0.05 -0.05 -0.05
-0.05
-0.20
-0.23 -0.36
-0.29 -0.31 -0.33 -0.35
Local market Domestic share Exports
F IGURE 6: DECOMPOSITION OF IMPACT ON SALES OF ACCOUNTING SERVICES
Wider impact
Short run and long run impacts on GDP can be verified by further calculations. In 2018, the
supply of workers with a bachelor degree in management is exogenously reduced by 1.15 per
cent, to represent the removal of accountants from the MLTSSL. These workers contribute
around 6.8 per cent of aggregate wage-bill weighted labour input, and labour contributes
around 60 per cent to GDP. By assumption, the capital stock for 2018 is put in place
exogenously by investment already undertaken in 2017, before the shock is known. The
impact on GDP of removing these workers is therefore approximately 1.15% * 6.8% * 60 % =
0.05%. This simple calculation verifies the modelled result for 2018 (Figure 7).
In the long run, say by 2024, the supply of workers with a bachelor degree in management has
been exogenously reduced by a cumulative 1.8 per cent. In the long run, the capital stock is
assumed to have had time to adjust so that rates of return are back at their base case levels,
which effectively means that the accumulated percentage change in the capital stock is the
15
APPLIED ECONOMICS www.appliedeconomics.com.ausame as it is for labour. The long run impact on GDP of removing the accountants is therefore
6.8% * 1.8% = 0.12%, which verifies the modelled result for 2024 (Figure 7).
0.00 0.00
2017 2018 2019 2020 2021 2022 2023 2024
percentage deviation from baseline
-0.02
-0.05
-0.06
-0.08 -0.07
-0.09 -0.08
-0.09
-0.10
-0.11
-0.12 -0.12 -0.12 -0.12 -0.12
-0.14 -0.14
-0.14 -0.14
-0.15
GDP Effective labour Capital
F IGURE 7: IMPACT ON GDP, LABOUR AND CAPITAL
Impact on labour and GDP per capita
Accountants are highly qualified and earn a wage that is above average, reflecting a high
marginal product of labour. The reduction in effective employment is therefore greater in
percentage terms than the reduction in employment by headcount. This is true within the
accounting industry (Figure 5) but it is also apparent at the national level. As a result, GDP per
capita declines, as shown in Figure 8.
2017 2018 2019 2020 2021 2022 2023 2024
0.00
percentage deviation from baseline
-0.02
-0.03
-0.04 -0.05
-0.05 -0.05 -0.05 -0.05
-0.08
-0.09
-0.11 -0.11
-0.12 -0.12 -0.11
-0.12
-0.14 -0.14
-0.14 -0.14
-0.15
Employment (persons) Effective labour GDP per capita
F IGURE 8: IMPACT ON EMPLOYMENT , EFFECTIVE LABOUR AND GDP PER CAPITA
16
APPLIED ECONOMICS www.appliedeconomics.com.auThe impact on real GDP per capita is one summary measure of the overall impact of the policy.
A better measure of the impact on the welfare of the domestic population is the impact on
real gross national income (GNI) per capita. In the context of this policy, the main difference is
in the price deflator used. (GNI also accounts for foreign remittances, which are assumed to
have only a small impact in this analysis).
Figure 9 show that the terms of trade (the ratio of the price of exports to the price of imports)
initially declines and then accelerates above its baseline level. This indicates that imports
initially become expensive relative to domestic income, which includes income from sales of
exports. In other words, the purchasing power of domestic income is reduced. Beyond 2020,
when the terms of trade begin to increase, this effect is reversed, and real gross national
income per capita increases relative to real GDP per capita.
It remains to understand the drivers of the terms of trade result. The increase in the terms of
trade in the long run is the result of the reduction in employment and GDP shown in Figure 7.
Assuming Australia has some market power in exporting, a slightly smaller economy means
that the Australian currency is able to appreciate slightly. The short run decline in the terms of
trade is the result of reduced investment activity in the short run.
As the workforce declines, the capital stock also needs to decline for rates of return on capital
to return to their base case levels. This requires a fall in investment in the short run, which is
offset by a temporary move towards trade surplus – an increase in exports and decrease in
imports. The increase in exports causes the temporary fall in the terms of trade.
percentage deviation from baseline
0.04 0.04
0.04
0.03
0.02
0.00
2017 2018 2019 2020
-0.01 2021 2022 2023 2024
-0.01 -0.01
-0.02
-0.02 -0.02 -0.02 -0.02 -0.03
-0.03
-0.03
-0.04 -0.05 -0.05 -0.05 -0.05
GDP per capita Real GNI per capita Terms of trade
Figure 9: Impact on GDP per capita, GNI per capita and the terms of trade
Impact on occupations
Long run changes in the relative wages of the occupations indicate pressures in the labour
market. Wages for accountants increase by more than 5 per cent relative to the baseline.
Wages for selected other occupations – the most positively and negatively affected – are
shown in Figure 10 below. In general, there is a positive impact on the wages of occupations
that, like accountants, are supplied by workers with a bachelor degree in management. These
occupations also suffer a shortage of supply, as suitably qualified workers are attracted away
17
APPLIED ECONOMICS www.appliedeconomics.com.aufrom these occupations and into accounting. Note that ANZSCO minor group 132 (Business
administration managers) includes the unit group 1322 (Finance managers) which is also
subject to an exogenous reduction in supply, albeit much smaller than the reduction in
accountants.
Declining wages are most apparent in the trades, including plumbers, bricklayers, glaziers and
so forth. This is a result of the decline in investment and domestic incomes. Investment in
dwellings is particularly negatively affected, with negative consequences for residential
construction and employment of the trades occupations.
percentage deviation from
0.26
baseline, 2024
0.17 0.16
0.12 0.12 0.12 0.11 0.10 0.09
-0.15-0.15-0.15-0.15-0.15-0.15-0.17-0.17
F IGURE 10: IMPACT ON WAGES , SELECTED OCCUPATIONS, 2024
The impact on employment by occupation is, as expected, most significant for Accountants
(Figure 11). However, there is a negative impact on employment in all occupations as a
consequence of the reduction in GDP. Apart from Professionals, there is an appreciable
impact on Other Professionals, Managers, Technicians and trades workers and Clerical and
administrative workers. The negative impact on the trades workers is a consequence of
reduced investment, particularly in dwellings, that also drives the fall in wages for these
occupations as discussed previously.
Employment of Managers, Other Professionals and Clerical and administrative staff is also
reduced because of the overall decline in the accounting industry, and because some suitably
qualified workers choose to become accountants instead of managers or clerical workers.
Note that the initially imposed reduction in supply of accountants of over 6000 workers is
never realised, because workers substitute into accounting from other occupations. The initial
decline in employment of accountants is only just over 2,000 workers for this reason.
18
APPLIED ECONOMICS www.appliedeconomics.com.au2017 2018 2019 2020 2021 2022 2023 2024
0
Managers
-2000
deviation from baseline, persons
Accountants
-4000
-6000 Other
Professionals
-8000
Tech and trades
-10000 Community
Clerical
-12000
Sales
-14000 Machinery Op
Labourers
-16000
-18000
F IGURE 11: IMPACT ON EMPLOYMENT BY OCCUPATION (ANZSCO MAJOR GROUP )
19
APPLIED ECONOMICS www.appliedeconomics.com.auAlternative Scenario Comparison
To test simulation results against some alternative assumptions can be a useful methodology.
It allows examination of alternative assumptions, and sensitivity of results to these. For the
modelling in this report, we have included a further scenario (“Scenario Two”) which makes
different assumptions as to the degree of responsiveness in other labour supply pathways for
accountancy responding to the removal of accountants from the MLTSSL list. The MLTSSL cut is
the same but responsiveness in the labour market does not follow through domestic supply
movements and other migration pathways.
In this further illustrative Scenario (2), the removal of accountants from the SOL manifests as a
permanent reduction in the growth rate of accountants, and a continual reduction in the stock
of accountants in the workforce, as shown in Figure 12. But the growth rate of the population
is assumed to be unaffected, meaning that while total immigration is unchanged, the
composition of immigration is permanently altered. This simulation is unlikely to play out in
the long run, but the results illustrate the impacts on the accounting industry of a situation in
which neither the domestic nor immigrant labour market respond to a growing shortage of
accountants.
This may seem less realistic than the major MLTSSL scenario featured above in this report. But
it may be argued that given the lags inherent in much study and professional experience for
accreditation, and also given uncertainty over whether MLTSSL might be extended to a wider
ambit than SOL so limiting substitute pathways, that such a scenario is still feasible. Hence this
alternative and its results are presented here for comparison. And perhaps the likely outcome
could be somewhere between the two. If this is so, then the two scenarios define the likely
bounds of policy impact, and Scenario Two is of genuine interest as well as Scenario One.
This Scenario Two remains still a “what-if” analysis – that is, the results from the scenario are
contingent on the assumed changes in the underlying composition of the workforce.
The scenario is still evaluated using the Victoria University Employment Forecasting (VUEF)
computable general equilibrium model of the Australian economy with particular detail in the
labour market
2017 2018 2019 2020 2021 2022 2023 2024
0 0 0 0 0 0 0 0
persons, cumulative deviation
-6547
-13094
from baseline
-19641
-26188
-32735
-39282
-45829
Total employment, Bachelor degree in management Working age population
F IGURE 12: ASSUMED IMPACTS ON EMPLOYMENT AND WORKING AGE POPULATION, SCENARIO 2
20
APPLIED ECONOMICS www.appliedeconomics.com.auIn this simulation, the working age population is assumed to remain on its baseline trajectory,
as are the participation rate and unemployment rate. As aggregate employment is thus
unchanged, results for macroeconomic indicators relative to the baseline are driven by
compositional effects only. Because accountants are highly skilled relative to the population
on average, the economy-wide effective labour input declines, and GDP per capita also
declines, as shown in Figure 15.
2017 2018 2019 2020 2021 2022 2023 2024
0.00 0.00 0.00 0.00 0.00 0.00 0.00 0.00
percentage deviation from baseline
-0.01
-0.02
-0.03
-0.04
-0.04
-0.05
-0.05
-0.06 -0.06
-0.07 -0.07
-0.08 -0.08
-0.09
Employment (persons) Effective labour GDP per capita
F IGURE 13: IMPACT ON EMPLOYMENT , EFFECTIVE LABOUR AND GDP, SCENARIO 2
A brief comparison of GDP results from the two scenarios reveals that the fall in GDP is larger
in scenario 1. A key assumption under scenario 1 is that population growth slows somewhat as
a consequence of the reduction in migrant accountants, whereas in scenario 2, migrant
accountants are assumed to be replaced by other migrants such that the population remains
on its baseline growth path. Because the assumptions for population growth differ between
the two scenarios, the appropriate indicator for comparison of the scenarios is GDP per capita.
In scenario 1, this differs from the GDP result, while in scenario 2, in which population growth
is unchanged, percentage deviation results for GDP and GDP per capita are the same.
Figure 14 shows that, until 2020, results for GDP per capita from the two scenarios are very
close. From 2021 onwards, the impact in scenario 1 of stabilising accountant numbers with
more entrants from the domestic market and via other migration streams starts to show, with
GDP per capita stabilising at 0.05 per cent below the baseline. On the other hand, the
permanent reduction in the growth rate of accountants assumed in scenario 2 feeds into a
continuous decline in GDP per capita as shown in Figure 14.
The fall in GDP however is much larger for scenario 1. It allows population to fall, relative to
the baseline as the accounting migration is cut, whereas scenario 2 keeps population as for the
baseline.
21
APPLIED ECONOMICS www.appliedeconomics.com.au2017 2018 2019 2020 2021 2022 2023 2024
0.00
percentage deviation from baseline
-0.01
-0.02
-0.03
-0.03
-0.04 -0.05
-0.05 -0.05 -0.05 -0.05 -0.05
-0.06
-0.07
-0.08
-0.09
-0.11
-0.12 -0.12 -0.12 -0.12
GDP, scenario 1 GDP per capita, scenario 1
GDP and GDP per capita, scenario 2
F IGURE 14: COMPARISON OF GDP RESULTS, SCENARIOS 1 AND 2
The reduction in availability of suitable workers curtails output from the accounting industry
(Figure 15). As the supply of accountants falls further below the baseline, so does output and
employment in the accounting industry. As outlined earlier, demand for accounting services is
relatively inelastic, and consequently the price index for accounting grows. Strong growth in
the accounting price index is reflected in the accounting wage index and rental price, or gross
operating surplus in the accounting industry, as shown in Figure 16.
percentage deviation from baseline
1.53 1.61
1.35 1.44
1.23
1.09 1.10
0.00
-0.30
-0.38 -0.35
-0.49 -0.42 -0.48
-0.57 -0.53 -0.59
-0.64 -0.71 -0.65
-0.78 -0.85
2017 2018 2019 2020 2021 2022 2023 2024
accounting price index
accounting output
accounting employment (wage bill weights)
F IGURE 15: IMPACT ON ACCOUNTING OUTPUT, PRICE INDEX AND EMPLOYMENT, SCENARIO 2
22
APPLIED ECONOMICS www.appliedeconomics.com.aupercentage deviation from baseline 5.04
4.75
4.45
4.13
3.79
3.40
3.03
1.44 1.53 1.61
1.23 1.35
1.09 1.10
0.00 0.02 0.11 0.05 0.03 0.03
-0.14
2017 2018 2019 2020 2021 2022 2023 2024
accounting price index accounting wage index accounting capital rental price index
F IGURE 16: IMPACT ON ACCOUNTING PRICE INDEX, WAGE INDEX AND CAPITAL RENTAL PRICE INDEX,
SCENARIO 2
As for scenario 1, with the reduction in available labour, the accounting industry becomes
more capital intensive, increasing its capital stock slightly (Figure 17). Again, the difference
between the employment headcount and effective employment measured in wage bill weights
reveals a compositional change towards lower-skilled workers in the accounting industry.
percentage deviation from baseline
0.20 0.17 0.15 0.15 0.14 0.13
0.00 0.00
2017 -0.06
2018 2019 2020 2021 2022 2023 2024
-0.13 -0.17 -0.19 -0.23 -0.26 -0.30
-0.38
-0.49
-0.57
-0.64
-0.71
-0.78
-0.85
accounting employment (wage bill weights) accounting capital stock
accounting employment (persons)
F IGURE 17: IMPACT ON INPUTS TO ACCOUNTING , SCENARIO 2
Results for the decomposition of the sales of accounting services (Figure 18) also reveals
similar results to scenario 1, with the majority of the reduction in accounting services absorbed
by the export sector.
23
APPLIED ECONOMICS www.appliedeconomics.com.au2017 2018 2019 2020 2021 2022 2023 2024
0.00
contribution to percentage deviation -0.06 -0.09 -0.09 -0.09 -0.10 -0.10 -0.11
-0.05
-0.05 -0.05 -0.06 -0.06 -0.06 -0.07
-0.21
-0.23
from baseline
-0.31
-0.35
-0.40
-0.45
-0.51
Local market Domestic share Exports
F IGURE 18: DECOMPOSITION OF IMPACT ON SALES OF ACCOUNTING SERVICES, SCENARIO 2
The impacts on occupation wages indicate where shortages and surpluses of labour may
develop. As for scenario 1, by far the largest positive wage deviation is for accountants,
auditors and company secretaries (ANZSCO 221), for which wages are 8 per cent above
baseline by 2024. Results for the highest and lowest remaining occupations are shown in
Figure 19.
Many of the occupations with a gain in wages are also those which gain the most in scenario 1,
including financial brokers and dealers, advertising managers, sales and marketing
professionals, and accounting clerks. In scenario 1, the occupations which saw the largest
reduction in wages were the trades occupations, which were affected by a reduction in
dwelling investment. In scenario 2, the trades occupations again suffer a negative impact on
wages, but some health-care related occupations, including medical practitioners, health
therapy professionals and nurses, are also among the most negatively impacted.
The negative impact on the wages of health professionals can be attributed to the assumption
that the size of the working age population remains on its baseline trajectory. Recall that we
assume the supply of bachelor degree-qualified management graduates is reduced and
replaced by uniform expansion in all remaining qualification groups. Cohorts of workers with
qualifications that can supply occupations such as ANZSCO 221 (accountants, auditors and
company secretaries) will supply more workers to this occupation and fewer to other
occupations (such as financial brokers and dealers, advertising managers and other
occupations shown in the left half of Figure 19).
24
APPLIED ECONOMICS www.appliedeconomics.com.au2.00
percentage deviation from baseline, 1.50
1.00
0.50
0.00
2024
-0.50
-1.00
F IGURE 19: IMPACT ON WAGES , SELECTED OCCUPATIONS, 2024, SCENARIO 2
This puts upward pressure on the wages in these occupations. However, workers with
qualifications in unrelated fields, such as health or trades, are not in a position to take
advantage of the opportunity to enter accounting-related occupations. As a result, the
assumed increase in supply of workers of all qualifications (other than bachelor degree in
management) puts downward pressure on the wages of workers in health and the trades.
2017 2018 2019 2020 2021 2022 2023 2024
2000
DEVIATION FROM BASELINE, PERSONS
1000
0
-1000
-2000
-3000
-4000
-5000
Managers Accountants (O221) Other Professionals
Tech and trades Community Clerical
Sales Machinery Op Labourers
F IGURE 20: IMPACT ON EMPLOYMENT BY OCCUPATION (ANZSCO MAJOR GROUP ), SCENARIO 2
In Figure 20, the total impact on employment is broken down into the eight ANZSCO major
group categories, and accountants. Unlike in scenario 1, where there was a fall in all
categories of employment, in this scenario, the net impact on employment is zero by
assumption. Other than accountants and managers, employment in all occupations increases.
25
APPLIED ECONOMICS www.appliedeconomics.com.auEmployment of accountants falls sharply in the first year of the simulation by assumption. The
supply of workers with a bachelor degree in management is reduced by assumption, and this
cohort is also assumed to supply fewer workers to the ANZSCO 221. From 2019 onwards, the
supply of workers with a bachelor degree in management continues to fall (see Figure 12) but
the cohort reduces its supply of workers to all of the occupations which it supplies. As a result,
employment of accountants continues to fall, but at a slower rate.
As of 2016, we estimate that slightly over 20 per cent of workers with a bachelor degree in
management work in ANZSCO 221. The supply of this cohort is reduced by more than 45,000
persons relative to baseline by 2024 in this simulation. We might expect that if 20 per cent of
these workers are accountants, employment of accountants would fall by 9,000 persons
relative to baseline, yet the fall is around half this amount. The discrepancy is explained by an
increase in supply to ANZSCO 221 from other qualification groups, including management
qualifications at the levels of post-graduate and advanced diploma. This suggests that workers
that are either over-qualified or under-qualified for accountancy work may be drawn into
ANZSCO 221.
26
APPLIED ECONOMICS www.appliedeconomics.com.auConclusions
While the inflow of permanent migrants under occupational skill listings in Australia represents
a small absolute number in any single year, there are important cumulative effects over time
and ripple effects through the economy. This is shown, by the modelling in this report, to apply
for a single but key profession such as accounting.
If accountant entry via MLTSSL was stopped, compared to a situation where it continued as
before, the modelling shows that there would be significant and adverse consequences. This
applies across the range represented by the two scenarios of reduced accountancy migration
modelled for this report.
For those scenarios, within accounting itself there would be a rise in accounting cost. For
incumbents this is welcome, but the reduced availability of accounting services and higher
accounting costs for others are significant negatives. The negatives ultimately feed through as
reduced GDP and GDP per capita.
The impact for accountancy is diminished if, and when, other residents move across to
accounting and domestic accounting graduate supply increases and substitute migrant
pathways are allowed to operate. Accounting service exports fall as the costs rise and imports
of such services increase.
Some consequent flow-on effects, especially of loss of staff from elsewhere to accountancy, do
benefit wages in those recruitment source areas. But the cost rises of accounting and related
services are such that the level of activity elsewhere is reduced, just as in accounting itself.
With reduced GDP, wages in trades and labour areas are adversely affected, especially for
semi-skilled workers and labourers.
The long-run impact is decline for the economy in employment, GDP and capital formation.
The major overall indicator, GDP per capita falls under both Scenarios, and falls progressively
where there is no other accounting supply response to assist.
To put this in numbers, removal of some 6000 accountants annually from MLTSSL leads by
2024 to an estimated loss of GDP of up to 0.12 per cent and of GDP per capita as much as 0.08
per cent compared to the baseline case (where the intake of accountants is maintained in the
MLTSSL list).
The cut of 6547 accountants (ANZSCO categories 221and 132) falls to zero in three years for
the economy in scenario one as substitution takes place. This produces over three years an
accumulated total loss of 12,547 employed accountants, but with no new further loss
thereafter.
For scenario two, the cut remains in place thereafter for the whole projection period. No
substitution occurs and there is a continued and accumulating loss of the stock of accountants
over time, growing each year when new accountants would otherwise have joined the
Australian workforce from overseas.
The precise trajectory will depend on how responsive the alternative accounting supply
pathways would be over what time scale, and how flexible the broader labour market and
other arrangements would be.
27
APPLIED ECONOMICS www.appliedeconomics.com.auHowever,with an inflexible scenario on the labour supply side contrasted with a three-year
adjustment track alternative scenario in this modelling, the outcome is likely to be within those
bounds. That is, because of this modest policy change annual real ($2016) GDP would be $1.5-
$2.5 billion less than it otherwise would have been in 2024.
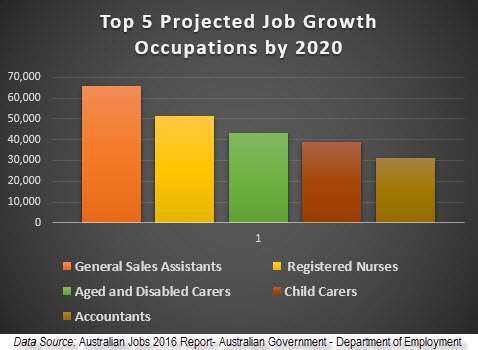
The Commonwealth Department of Employment has recently listed accountants as
representing the third largest occupation for projected job growth by 2020 (Figure 21). To
remove accountancy from the skilled permanent immigration program occupational listings
would seem most ill-advised in terms of this requirement and in terms of the likely adverse
economic impacts also revealed by the modelling in this report.
Figure 21: Projected Job Growth by Occupation by 2020: Top Five Occupations
28
APPLIED ECONOMICS www.appliedeconomics.com.auReferences
Applied Economics (2016), The Labour Market for Accountants and the Skilled Occupations List,
A report to CPA Australia and Chartered Accountants Australia and New Zealand, November
Department of Employment (2016), Australian Jobs 2016- Report, Canberra: Australian
Government Department of Employment.
Dixon, J. (2016a), Victoria University Employment Forecasts Information Paper. Available from
author on request.
Dixon, J. M. (2016, October). Victoria University Employment Forecasts for Australia, 2016-17
to 2023-24. Subscription product.
Dixon, J. M., & Wittwer, G. (2015). The Labour Module in a dynamic, regional CGE model. CoPS
Working Paper G-257 .
Dixon, J. M., Dixon, P. B., Giesecke, J. A., & Rimmer, M. T. (2014). Quantifying "Dog Days".
Economic Papers , 33:3 pp. 203-219.
Dixon, P. B., & Rimmer, M. T. (2002). Dynamic General Equilibrium Modelling for Forecasting
and Policy: A Practical Guide and Documentation of MONASH. North Holland Publishing
Company.
Giesecke, J. A., & Madden, J. R. (2013). Evidence-based regional economic policy analysis: the
role of CGE modelling. Cambridge Journal of Regions, Economy and Society , Vol 6, pp 285-301.
Giesecke, J. A., & Madden, J. R. (2013). Regional Computable General Equilibrium Modelling. In
P. B. Dixon, & D. W. Jorgenson, Handbook of Computable General Equilibrium Modelling (pp.
Vol 1A pp 379-470). Elsevier.
Meagher, G. A., & Pang, F. (2011). Labour Market Forecasting, Reliability and Workforce
Development. CoPS/IMPACT Working Paper Number G
29
APPLIED ECONOMICS www.appliedeconomics.com.auAPPENDIX: TECHNICAL APPENDIX ON MODEL
CHARACTERISTICS
Vic-Uni Model
At the core of VUEF is the Vic-Uni model, a highly detailed and modern computable general
equilibrium (CGE) model of the Australian economy. The Vic-Uni model is a descendant of the
well documented MONASH model (Dixon and Rimmer 2002). A recent example of a
comprehensive forecasting simulation derived from the Vic-Uni model is J.Dixon et al (2014).
The model features several decision-making agents – industries (more than 100), investors,
households, external trading partners, and government – making decisions on the supply and
use of commodities (more than 100, corresponding to the industries) and factor inputs, and
whether to source commodity purchases from the domestic economy or trading partners.
Three blocks of equations describe this process:
1. Agent decision-making equations, including equations describing
a. cost minimisation by producers,
b. utility maximisation by households,
c. purchases by government, generally policy-driven,
d. the allocation of investment funds in response to risk-adjusted rates of return,
and
e. external trade.
2. Equations describing the price system.
a. Basic prices are derived from a zero pure profit condition on producers
b. Purchaser prices are derived by adding relevant margins and taxes. Every
agent in the model has a separate purchaser price identified for each
commodity.
3. Market clearing equations to ensure supply equates to demand for every commodity.
These equations are sufficient to endogenously determine the price and quantity of every
produced commodity identified in the model.
For non-produced commodities – factor inputs and imports sourced from outside Australia –
these equations are sufficient to explain price or quantity, but not both. For these
commodities, we assume:
1. that the national supply of land is fixed, although it may shift between uses,
2. that the national supply of labour is determined through a series of supplementary
equations linking it to national population,
3. that the industry-specific supply of capital is determined through additional dynamic
linkage equations to previous-period capital stocks and investment, and
4. that foreign currency prices of imports are exogenous to the model.
Finally, a block of macroeconomic accounting identities is included in the model for the
reporting of variables such as GDP, the terms of trade, the real exchange rate, and other key
macroeconomic indicators.
30
APPLIED ECONOMICS www.appliedeconomics.com.auYou can also read