Public Version Review of EAPL gas forecasts for the Moomba-Sydney pipeline - May 2003
←
→
Page content transcription
If your browser does not render page correctly, please read the page content below

Public Version

Review of EAPL gas forecasts for
  the Moomba-Sydney pipeline

           Prepared for Agility Management Pty Limited
                                     on behalf of EAPL
                                           May 2003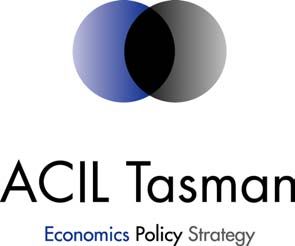
ACIL Tasman Pty Ltd
ABN 68 102 652 148
Internet www.aciltasman.com.au

Melbourne office                         Perth office
Level 6, 224-236 Queen Street            Level 29, The Forrest Centre
Melbourne VIC 3000                       221 St Georges Terrace
Telephone (+61 3) 9600 3144              Perth WA 6000
Facsimile (+61 3) 9600 3155              PO Box 7505
Email     melbourne@aciltasman.com.au    Cloisters Square
                                         Perth WA 6850
                                         Telephone (+61 8) 9480 3762
                                         Facsimile (+61 8) 9481 3177
Canberra office                          Email     perth@aciltasman.com.au
103-105 Northbourne Avenue
Turner ACT 2612
GPO Box 1322
Canberra ACT 2601                        Sydney office
Telephone (+61 2) 6249 8055              PO Box 170
Facsimile (+61 2) 6257 4170              Northbridge NSW 1560
          (+61 2) 6249 7455              Telephone (+61 2) 9958 6644
Email     canberra@aciltasman.com.au     Facsimile (+61 2) 8080 8142
                                         Email     sydney@aciltasman.com.au

Brisbane office
Level 15, 127 Creek Street
Brisbane QLD 4000
GPO Box 32
Brisbane QLD 4001
Telephone (+61 7) 3236 3966
Facsimile (+61 7) 3236 4399
Email     brisbane@aciltasman.com.au

For information on this report

Please contact:

Michael Hitchens
Telephone (02) 62498055
Mobile    0404822308
Email     m.hitchens@aciltasman.com.au
© ACIL Tasman Pty Ltd This work is copyright. The Copyright Act 1968 permits fair dealing for study, research, news reporting, criticism or review. Selected passages, tables or diagrams may be reproduced for such purposes provided acknowledgment of the source is included. Permission for any more extensive reproduction must be obtained from Kelly Milne at ACIL Tasman on (03) 9600 3144. Reliance and Disclaimer The professional analysis and advice in this report has been prepared by ACIL Tasman for the exclusive use of the party or parties to whom it is addressed (the addressee) and for the purposes specified in it. This report is supplied in good faith and reflects the knowledge, expertise and experience of the consultants involved. The report must not be published, quoted or disseminated to any other party without ACIL Tasman’s prior written consent. ACIL Tasman accepts no responsibility whatsoever for any loss occasioned by any person acting or refraining from action as a result of reliance on the report, other than the addressee. In conducting the analysis in this report ACIL Tasman has endeavoured to use what it considers is the best information available at the date of publication, including information supplied by the addressee. Unless stated otherwise, ACIL Tasman does not warrant the accuracy of any forecast or prediction in the report. Although ACIL Tasman exercises reasonable care when making forecasts or predictions, factors in the process, such as future market behaviour, are inherently uncertain and cannot be forecast or predicted reliably. ACIL Tasman shall not be liable in respect of any claim arising out of the failure of a client investment to perform to the advantage of the client or to the advantage of the client to the degree suggested or assumed in any advice or forecast given by ACIL Tasman.
Review of EAPL gas forecasts for the Moomba-Sydney pipeline

Contents
Executive summary                                                               vi
1   Introduction and methodology                                                 1
2 Non-electricity gas demand                                                     2
    2.1 Methodology for non-electricity demand                                   2
    2.2 The forecasts of non-electricity demand                                  4

3 Electricity gas demand                                                         7
    3.1 Methodology for electricity gas demand                                   7
        3.1.1 EAPL                                                               7
        3.1.2 ACIL Tasman                                                        7
        3.1.3 Implications of the NSW greenhouse benchmark scheme                9
    3.2 Forecasts of gas demand for electricity                                 11

4 Determining the share of NSW/ACT gas demand among
  MSP, EGP and CSM                                                              12
    4.1 Sharing methodology                                                     12
        4.1.1 EAPL methodology for assigning demand to pipelines                12
        4.1.2 ACIL Tasman methodology                                           13
    4.2 Forecast shares of NSW/ACT gas demand                                   16
        4.2.1 CSM                                                               16
        4.2.2 EGP                                                               17
        4.2.3 MSP                                                               21
    4.3 Conclusion                                                              28

5 Quantity of gas on the Victoria/NSW interconnect                              29
    5.1 Interconnect methodology                                                29
    5.2 Interconnect forecasts                                                  30

A PowerMark                                                                     33
B GasMark                                                                       36

Figure 1: Trends in NSW gross final demand and energy use in manufacturing       3
Figure 2: EAPL, ABARE and ACIL Tasman forecasts of non-electricity gas demand    5
Figure 3: Victoria commercial, residential and manufacturing gas consumption     6
Figure 4: Regional average wholesale electricity prices 2003-2012                9
Figure 5: Gas demand for electricity generation in NSW/ACT                      11
Figure 6: Potential CSM supply                                                  17

                                                                                iv
Review of EAPL gas forecasts for the Moomba-Sydney pipeline
Figure 7: Forecast gas flow on the EGP 18
Figure 8: EGP gas flows as estimated by GasMark – southern gas scenario left-hand
chart and northern gas scenario right-hand 19
Figure 9: EGP gas flows – with tariff response in the northern gas scenario 20
Figure 10: EGP gas flow – with EGP tariff response in the northern gas scenario and
additional CSM supply in the southern gas scenario 21
Figure 11: MSP total gas flows – southern gas scenario left-hand chart and northern
gas scenario right-hand chart 22
Figure 12: Gas flows on the MSP to meet NSW/ACT demand 23
Figure 13: Gas flows on the MSP to meet NSW/ACT demand − with a competitive
tariff response on the EGP 24
Figure 14: Gas flows on the MSP to meet NSW/Act demand − with a competitive
tariff response on the EGP and additional CSM supply 25
Figure 15: Hypothetical gas swap scenario 26
Figure 16: Forecast of total interconnect flows (competitive tariff response by the
EGP in the northern scenario) 31
Figure 17: ACIL Tasman and EAPL forecast of MSP − with flows to Victoria and
EGP tariff response in the northern scenario 32
Figure 18: ACIL Consulting Electricity Market Model – PowerMark 34
Figure 19: LHS - Projected annual energy requirements (GWh), RHS - comparison of
projected peak winter and summer demands (MW) 34
Table 1: Projected additions of new generating capacity in NSW 8
Table 2: Gas resource assumptions for the northern gas supply scenario (Scenario 1) 14
Table 3: Gas resource assumptions for the southern gas supply scenario (Scenario 2) 15
Table 4: Projected annual sent-out energy requirements (GWh) 35
Table 5: Comparison of projected sent-out peak winter and summer demands (MW) 35
vReview of EAPL gas forecasts for the Moomba-Sydney pipeline
Executive summary
The objective of this report is to determine whether, in ACIL Tasman’s
opinion, the EAPL methodology and the forecast volumes for the Moomba-
Sydney Pipeline (MSP) are capable of meeting the regulatory criterion of the
“best estimate arrived at on a reasonable basis”.
Key considerations in ACIL Tasman’s assessment of the possible gas flows in
the Moomba-Sidney pipeline (MSP) are:
• forecasting of gas demand and supply over a 20 year period of time is a
most imprecise task;
• the change in the historical pattern of gas deliveries into NSW (from
Moomba) due to the existence of the EGP and contracts being entered
into by AGL Wholesale Gas Limited (from Gippsland);
• the prospective future changes in the gas delivery patterns that are
dependent on where and when new, competitive gas supplies will be
sourced to meet demand;
• the possible responses to market developments by an increasing number of
pipeline owners and gas producers;
• interpretation of public information about current and emerging contracts
for the EGP and MSP;
• estimation of the impact of emerging technology such as CSM; and
• understanding the potential implications of more sophisticated market
developments such a swaps.
A key outcome of ACIL Tasman’s review of the EAPL forecasts is the
potential impact of different scenarios about the timing and amounts of new
gas discoveries that could influence flows on the MSP. Importantly, not only
is the analysis of how NSW/ACT demand might be met significant for
forecasting flows on the MSP, but also how Victoria demand is met, potentially
by flows on the MSP via the interconnect.
As demonstrated in the report, the plausible outcomes may be significantly
different a single forecast of throughput on the MSP, such as that estimated
by EAPL, needs to be developed with care bearing in mind the purpose of the
forecast.
Taken as a whole, ACIL Tasman concludes that the EAPL forecast of gas
flows through the MSP is based on sound methodology. Further, as the
estimates fall within the bounds of the ACIL Tasman scenarios of future gas
supply developed in this report, the EAPL forecast flows on the MSP are
Executive summary viReview of EAPL gas forecasts for the Moomba-Sydney pipeline
considered to be ‘reasonable best estimates’, reflecting a balanced outlook for
supply of gas from northern and southern basins.
Nevertheless, ACIL Tasman has identified areas of the EAPL methodology
and forecasts that should be given further consideration. These include:
• the methodology used by EAPL to apply ABARE forecast growth volumes
for non-electricity gas demand to 2020 should be amended to apply
ABARE’s forecast growth rates to the EAPL 2003 base year demand,
subject to ABARE growth rates post 2016 being reasonable;
• the methodology to extrapolate post 2020 (and post 2016 if ABARE
growth rates are not reasonable) could take account of the experience in
the Victoria gas market;
• some account may need to be made for new small co-generation being
promoted by the NSW greenhouse benchmark scheme for electricity
retailers, although the amounts are likely to be small; and
• some consideration may need to be given to the potential impact of
Hunter Valley CSM on gas-fired electricity demand late in the period.
Executive summary viiReview of EAPL gas forecasts for the Moomba-Sydney pipeline
1 Introduction and methodology
ACIL Tasman has been engaged by Agility Management Pty Limited (acting as
regulatory advisers on behalf of EAPL) to review the EAPL forecasts of gas
transmission through the Moomba-Sydney Pipeline (MSP) for the period to
2023. The EAPL forecasts are being made in the context of the regulation of
tariffs.
Consequently, in undertaking this task, ACIL Tasman’s objective is to
determine whether, in ACIL Tasman’s opinion, the methodology and the
forecast volumes are capable of meeting the regulatory criterion of the “best
estimate arrived at on a reasonable basis”.
There are four key areas of investigation that are required in order to make
estimates of the gas volumes for the MSP through to 2023:
• forecasts of the non-electricity gas demand in NSW/ACT, including
residential, commercial and industrial demand;
• forecasts of power generation gas demand in NSW/ACT;
• the allocation of NSW/ACT demand between MSP, the eastern gas
pipeline (EGP) and local coal seam methane (CSM); and
• forecasts of gas flowing through the Victorian interconnect and, hence,
some sections of the MSP.
ACIL Tasman observes that the forecasting of gas demand and supply over a
20 year period of time is a most imprecise task. Within this period of time
several economic cycles may have taken place to influence demand, existing
gas fields will have significantly lower remaining reserves, new gas fields will
have been discovered, the configuration of the pipeline network will have
changed and government policies will have changed. The set of ‘best estimates
arrived at on a reasonable basis’ is large.
The following chapters of this report examine the ‘appropriateness’ of the
EAPL methodology and the ‘reasonableness’ of the forecast volumes for each
of the four key areas. In each chapter, ACIL Tasman's approach to the task has
been to:
• familiarise itself with the EAPL forecasts;
• assess the methodology, assumptions and forecasts used by EAPL;
• seek clarification and further information from Agility on methodology,
assumptions and forecasts; and
• apply a reality check to the EAPL forecasts using ACIL Tasman’s
methodologies and forecasts.
Introduction and methodology 1Review of EAPL gas forecasts for the Moomba-Sydney pipeline
2 Non-electricity gas demand
Non-electricity gas demand is defined by EAPL to include consumption by the
residential, commercial and industrial sectors of NSW and the ACT. EAPL
(and ABARE) has excluded gas used in large-scale co-generation of electricity
in industrial operations and conventional gas-fired electricity generation.
However, EAPL’s (and ABARE’s) forecasting methodology (described below),
which relies on historical ABARE data that includes existing small-scale gas co-
generation, results in growth in small-scale co-generation in the industrial
sector to be included in this non-electricity demand forecast.
2.1 Methodology for non-electricity demand
EAPL has used a two-stage methodology to estimate non-electricity gas
demand:
• ABARE’s forecasts of gas demand supplied to EAPL in March 2003
(unpublished) that is projected from 2000-01 historical data to 2019-20
(noting that, consistent with historical data, this ABARE forecast includes
small-scale co-generation); and
• adjustment of the ABARE forecasts to take account of
– the inclusion of ethane in the ABARE industrial forecasts, which is not
relevant to natural gas demand that could be supplied via the MSP
– the inclusion of gas demand for co-generation of electricity at Sithe
Smithfield
– the availability of historical gas demand data, which has been used by
EAPL to adjust the ABARE forecasts downward in 2003 to match
known pipeline deliveries into NSW for the years 2000 to 2002.
Using this methodology, EAPL have:
• subtracted the ethane and Sithe Smithfield demand from the ABARE
forecast to 2020;
• used the ABARE volume growth in petajoules (PJ) over the period to 2020
(resulting in an average annual growth rate of about 2.2% over the 17 years
compared with ABARE’s 2% over 10 years);
• for the period to 2020, applied the volume growth to the base actual
demand in 2003; and
• projected the post 2020 demand at 1% growth per annum on the
assumption that, by this time, the gas market should be near saturation.
Non-electricity gas demand 2Review of EAPL gas forecasts for the Moomba-Sydney pipeline
ACIL Tasman’s view is that, in a long-term forecast of this type, the
appropriate methodology is the use of macroeconomic forecasts of the type
undertaken by ABARE. In making these macroeconomic forecasts, ABARE
modelling is informed by historical trends and relationships between gas
demand and drivers such as State Final Demand (SFD), population growth,
relative energy prices and technological change. ABARE also uses information
about major projects to inform the forecasts. For these reasons, ACIL
Tasman also uses ABARE forecasts of these sectors of gas demand in its
GasMark model of the eastern states gas market.
Nevertheless, it is worth reflecting on the aggregate nature of the forecast and
the implications, particularly in the context of regulating tariffs. In broad
terms, NSW gas demand is shared between residential, commercial and
industrial consumption in the ratio 15:10:75 that is, industrial demand is by
far the largest gas use in the State. Figure 1 shows data comparing growth in
NSW SFD with growth in the manufacturing sector’s use of electricity and gas.
While there is a clear positive correlation between SFD and electricity use, the
relationship with gas use is less clear.
Figure 1: Trends in NSW gross final demand and energy use in
manufacturing
250 90.00
80.00
200 70.00
60.00
PJ
150
50.00
$Billion
40.00
100
30.00
50 20.00
10.00
0 0.00
SFD 1996-97$ Series1 Electricity Natural Gas
Source: ABARE and ABS
Non-electricity gas demand 3Review of EAPL gas forecasts for the Moomba-Sydney pipeline
This lack of relationship between gas use in NSW manufacturing and State
economic growth helps explain the low overall rate of growth in gas demand
forecast by ABARE (average 2%) compared with SFD of 3.2%.
In summary, ACIL Tasman agrees with the general approach that EAPL has
adopted to forecast this segment of the gas market. However, there are two
points of detail in the methodology used by EAPL that could be improved:
• EAPL have applied the ABARE forecast annual volume growth to the
2003 base volume out to 2020, whereas to be consistent with the
macroeconomic modelling approach, it is the ABARE annual growth rates
to 2020 that should be applied to the 2003 base volume
– EAPL’s methodology will marginally overestimate gas demand to 2020;
and
• EAPL have applied a growth rate of x% per annum post 2020 rather than
extrapolate the ABARE growth rate. While it is expected that, as gas
increases its penetration into all sectors, growth rates decline in comparison
to general economic growth rates, nevertheless the average growth rate in
gas demand would not abruptly fall from an average of 2% to x% per
annum
– EAPL could examine a smoother transition to lower annual growth
rates, and ACIL Tasman suggests a possible approach in section 2.2
below.
While the use of the ABARE forecast could be expected to deliver a
reasonable best estimate of demand, it is worth commenting that demand may
turn out to be higher or lower the uncertainties about forecasting demand
over 20 years should be recognised.
2.2 The forecasts of non-electricity demand
Figure 2 shows the comparable EAPL and ABARE forecasts, and an ACIL
Tasman forecast that is based on a 2001 ABARE forecast. ACIL Tasman
notes that:
• the EAPL and ABARE forecasts are compatible to 2020, taking account of
the adjustment to reflect actual pipeline flows from 2000 to 2002;
• EAPL’s use of x% average growth post 2020 is apparent
– after consultation with ACIL Tasman, Agility has identified that there is
an error in the spreadsheet calculating the x% growth which should be
corrected by EAPL (the corrected data is shown in the figure); and
Non-electricity gas demand 4Review of EAPL gas forecasts for the Moomba-Sydney pipeline
• the EAPL and ABARE forecasts show an upturn in demand from 2016 to
2020, which is not consistent with the known pattern of gas penetration in
mature markets that sees slower rates of growth over time
– the ACIL Tasman forecast (based on a 2001 ABARE forecast) shows
the expected slow reduction in growth rate over time as the NSW
market matures
– suggesting the average growth rate now forecast by ABARE (and
EAPL) may over-estimate demand in the last quarter of the period.
Figure 2: EAPL, ABARE and ACIL Tasman forecasts of non-electricity gas
demand
Residential, industrial, commercial
170.0
160.0
150.0
140.0
PJ
130.0
120.0
110.0
100.0
2002
2003
2004
2005
2006
2007
2008
2009
2010
2011
2012
2013
2014
2015
2016
2017
2018
2019
2020
2021
2022
2023
ABARE EAPL AT total
Source: ACIL Tasman
ACIL Tasman suggests there are good indicators of trends in non-electricity
gas demand growth rates in Victoria that should guide the trend in growth
rates for NSW/ACT. Figure 3 shows the gas demand growth, and rates of
growth, over the last 30 years in Victoria. It is apparent that the Victorian
market has reached maturity by the early 1980’s. Thereafter, the trend in gas
demand growth rates is for a slow steady decline. ACIL Tasman would expect
a similar trend in NSW/ACT gas demand growth rates over the next 20 years.
Non-electricity gas demand 5Review of EAPL gas forecasts for the Moomba-Sydney pipeline
Figure 3: Victoria commercial, residential and manufacturing gas consumption
250 24%
Gas demand (% change)
19%
200
Gas demand (PJ)
14%
150
9%
100
4%
50
-1%
0 -6%
Gas demand Gas demand
Source: ABARE, ACIL Tasman
ACIL Tasman concludes that the new ABARE forecast growth rates adopted
by EAPL may overestimate non-electricity gas demand from around 2016 to
2020. EAPL should pursue this with ABARE. On the other hand, EAPL
possibly underestimates demand from 2020-23 by using an average 1% growth
rate from 2020, and this underestimate is compounded by the modelling error
noted above.
A better approach might be, from 2016, to adopt the pattern of growth similar
to that seen in the mature Victoria market. This pattern of growth suggests a
growth rate of around 1.7% per annum from 2015-16, declining steadily to
around 1% per annum from 2022-23.
Non-electricity gas demand 6Review of EAPL gas forecasts for the Moomba-Sydney pipeline
3 Electricity gas demand
3.1 Methodology for electricity gas demand
3.1.1 EAPL
Following the deregulation of electricity markets and the creation of the
National Electricity Market (NEM), macroeconomic modelling of potential
fuel sources for electricity generation has not produced robust results. Rather,
industry has relied on micro-economic models of generator bidding behaviour,
such as ACIL Tasman’s PowerMark, to understand the trends in the market.
In its forecast of gas demand for electricity generation in NSW and the ACT,
EAPL has used an informal approach consisting of:
• use of the NSW Ministry of Energy and Utilities “Statement of System
Opportunities” (SSO), published in June 2002, to determine the extra
generation capacity required to meet the ‘base probable’ electricity demand
to 2010/11;
• use of the greenhouse scenarios in the SSO that estimated gas-fired
generation requirements for the whole NEM;
• conversion of the NEM gas-fired generation requirements to NSW
requirements using NSW’s share of total NEM electricity demand (being
37%);
• using market intelligence, construction of a schedule of 1125 MW of new
gas-fired plant to be commissioned in NSW over the period to 2023 and
estimation of the petajoules of gas demanded using appropriate operating
assumptions; and
• making assumptions about the location of the new plant to determine
whether the gas required for generation would be supplied via the MSP or
the EGP.
While no formal model is used, EAPL’s approach mirrors many of the steps
incorporated in modelling of the NEM.
3.1.2 ACIL Tasman
ACIL Tasman uses its PowerMark model of the NEM to inform, among other
things, decisions by clients about building new power stations and determining
fuel sources for those new power stations. Attachment A provides a
description of PowerMark.
Electricity gas demand 7Review of EAPL gas forecasts for the Moomba-Sydney pipeline
ACIL Tasman uses the NEMMCO Statement of Opportunities (SOO) to
develop electricity demand profiles for PowerMark (note: the NSW “Statement
of System Opportunities” used by EAPL was derived by the NSW Ministry of
Energy and Utilities from the 2001 SOO a new MEU SSO is not yet
available). The SOO for 2002 includes electricity demand scenarios that
incorporate the effect of some government policies, and ACIL Tasman
augments this where possible to reflect those government policies not
accounted for in the SOO. For example, ACIL Tasman has taken account of
the NSW greenhouse benchmark scheme (see section 3.1.3) and the
Queensland 13% gas-fired generation scheme in its ‘base case’ modelling.
In essence, new electricity generating plant is determined in the modelling
based on known plans to expand brownfield sites plus additions of new sites in
each NEM region. ACIL Tasman’s aim in modelling a ‘base case’ scenario is
to schedule new capacity by NEM region in a manner that has the effect of
keeping the load weighted wholesale NEM price across the regions at around
$40/MWh, being the long-run new entrant price for gas-fired generation. This
scheduling of new capacity is informed by the availability of fuel type and
delivered price in each NEM region. The dispatch of each generator, and
hence annual fuel use, is determined by the modelled bidding of that generator
into the NEM pool.
ACIL Tasman’s current ‘base case’ view about new capacity in NSW is shown
in Table 1. That view is based on detailed annual modelling of the NEM to
2012 and ‘spot’ modelling of the year 2015. ACIL Tasman has not modelled
later years in its current ‘base case’, but has extrapolated from 2015.
Table 1: Projected additions of new generating capacity in NSW
NSW ‘base case’ capacity schedule
Liddell U3 - return to full-time service in 2004
Liddell U4 - return to full-time service in 2005
Bayswater - +40MW per unit Nov 2005 – 2006
Munmorah U3 - return to full-time service in 2005
Wallerawang U7 - return from seasonal service in 2007
Munmorah U4 - return to full-time service in 2008
NE CCGT - 350MW in 2009
NE Peaker - 400MW in 2009
NE CCGT - 350MW in 2015
NE Coal – 600MW in 2016
NE CCGT - 400MW in 2018
NE Coal – 300MW 2018
Source: ACIL Tasman
Electricity gas demand 8Review of EAPL gas forecasts for the Moomba-Sydney pipeline
Figure 4 is an example of a typical model output from our most recent
PowerMark. The figure displays regional average electricity pool prices from
2003-2012. This represents our ‘base case’ view of the electricity market over
the projection period.
The low prices in Queensland in the next few years are the outcome of recent
new coal capacity and the government’s 13% gas scheme, which will bring
forward new gas-fired generation that would have otherwise occurred later in
the decade. ACIL Tasman expects prices to converge to around $40/MWh.
Figure 4: Regional average wholesale electricity prices 2003-2012
$50
$45
$40
($/MWh)
$35
$30
$25
$20
2003 2004 2005 2006 2007 2008 2009 2010 2011 2012
Year ending in June
Snowy Victoria NSW SA Queensland Tasmania
Source: ACIL Tasman
3.1.3 Implications of the NSW greenhouse benchmark scheme
In terms of gas use, ACIL Tasman’s view is that the impact of the NSW
greenhouse benchmark scheme for electricity retailers will be three-fold:
• ‘above baseline’ use of gas in existing gas-fired generators connected to the
NEM grid will be encouraged by the ability to create and sell NSW
Greenhouse Abatement Certificates (NGACs) at a premium above the
market wholesale electricity price
– the impact on gas use in NSW, however, will be negligible as the only
existing gas-fired generator of note, Sithe Smithfield, is already
operating at full capacity;
• investment in conventional gas-fired electricity generation or large-scale co-
generation, whether in NSW or in other States connected to the NEM grid,
will be made more profitable as NGACs are able to be sold for a premium
above the market wholesale electricity price
– ACIL Tasman’s view is that the impact does not necessarily have the
effect of bringing forward gas-fired generation in NSW
Electricity gas demand 9Review of EAPL gas forecasts for the Moomba-Sydney pipeline
– because new gas-fired generation is expected at an earlier date in both
Queensland and South Australia (and possibly Victoria), sufficient
NGACs are likely to be created by these plant (and investment in other
eligible activities in NSW and elsewhere) before new generation is
induced by the scheme in NSW
– the proposals for large-scale co-generation at Botany Bay, Kurnell, Lake
Illawarra and Port Kembla of the late 1990s remain dormant; and
• enterprises located in NSW will also be able to sell NGACs where they
install co-generation plant to replace electricity purchased from the grid
– ACIL Tasman is not aware of any specific modelling undertaken to
estimate the impact of the NSW benchmark scheme on increased
small-scale co-generation in NSW
– however, in its work for the NSW Ministry of Energy and Utilities1,
Frontier Economics forecast that demand-side management, which is
defined to include small-scale co-generation, might replace around
2,500 GWh of electricity generation in 2003 declining to around
500GWh by 2012
– according to the listing of demand-side management opportunities
identified by Frontier2, the least-cost, and hence most likely to be first
adopted, opportunities are in a variety of energy efficiency applications
– small-scale co-generation is relatively expensive, and if it were to
contribute 100GWh by 2012, would increase gas demand by about 1PJ
per annum.
ACIL Tasman’s conclusion is, on the modelling available, that the NSW
benchmark scheme is unlikely to significantly increase demand for gas for
electricity generation within NSW.
In terms of the EAPL methodology, it is recalled from Chapter 2 that the
ABARE (and EAPL) forecasts on non-electricity gas demand include the
forecast for increases in existing small-scale co-generation. In the absence of
better information, it may be appropriate for EAPL to make some allowance
(perhaps up to 1PJ per annum by 2012) for the potential increase in gas use by
new small-scale co-generation induced by the NSW benchmarks scheme.
1 Benchmarks Position Paper: Greenhouse-related licence conditions for electricity retailers Appendix A,
MEU, December 2001.
2 ibid, Appendix B.
Electricity gas demand 10Review of EAPL gas forecasts for the Moomba-Sydney pipeline
3.2 Forecasts of gas demand for electricity
Figure 5 compares the EAPL and ACIL Tasman forecasts for gas for
electricity generation in NSW/ACT. The following are noted:
• EAPL’s informal methodology produces a forecast very similar to ACIL’s
formal model-based approach, demonstrating that the electricity market
intelligence that underlies both approaches is similar;
• EAPL carries a gas demand for the Sithe Smithfield plant at 12.8PJ per
annum, whereas ACIL Tasman has an estimate of 8.9PJ per annum that is
outdated; and
• both forecasts are based on simple extrapolations beyond 2012.
On this analysis, the EAPL forecast is reasonable.
Neither the EAPL nor the ACIL Tasman forecasts recognise the potential for
one of the new gas-fired generation plants projected for NSW to be fuelled by
CSM, thereby by-passing both the EGP and the MSP. This possibility is
represented on the ACIL Tasman forecast by the flat dashed line from 2019
onwards in Figure 5. The assumption is that the third CCGT scheduled could
be sited in the Hunter Valley and fuelled by CSM. This possible outcome is
discussed further in Section 4.2.1 below.
Figure 5: Gas demand for electricity generation in NSW/ACT
Gas-fired electricity generation
90.0
80.0
70.0
60.0
50.0
PJ
40.0
30.0
20.0
10.0
0.0
2002
2003
2004
2005
2006
2007
2008
2009
2010
2011
2012
2013
2014
2015
2016
2017
2018
2019
2020
2021
2022
2023
EAPL AT AT (additional CSM)
Data source: ACIL Tasman
Electricity gas demand 11Review of EAPL gas forecasts for the Moomba-Sydney pipeline
4 Determining the share of NSW/ACT gas
demand among MSP, EGP and CSM
4.1 Sharing methodology
This section contains a summary of the methodologies applied by EAPL and
ACIL Tasman to estimate the shares of NSW/ACT gas demand accounted for
by coal seam methane (CSM), EGP and MSP. Gas demand comprises non-
electricity (residential, industrial, commercial) and electricity demand. The
methodologies utilised by EAPL and ACIL Tasman to project gas demand for
these categories have been described in Chapters 2 and 3, respectively.
The implications of transporting gas through the upstream section of the MSP
(and the Victoria/NSW interconnect) to supply gas to meet Victoria demand
are discussed in Chapter 5.
4.1.1 EAPL methodology for assigning demand to pipelines
EAPL has sequentially allocated gas demand to CSM and EGP, with the
remainder of total NSW/ACT gas demand being allocated to the MSP.
The Sydney Gas CSM share of demand was assigned by forecasting two
production stages. Stage 1 (2003 onwards) assumes increasing gas production
rising to a peak delivery of 4.5 PJ per annum in 2008 xxx xxxxxxxxx xx xxxx
xxxx xx xxxx. xxxx x xx xxxxxx xx xxxxxxx xx xxxx, xxxx x xxxxxx xxxxxx
xxxxxxxxx xxxxxx xx xxxx x, xxxxxxx x xxxx xxxxxxx xx x xx xxx xxxxx xx
xxxx xxxx xxxx xx xxxxxxxxx xxx xxx xxxxxxxx xx xxx xxxxxxxxx xxxxxx.
Gas for electricity supplied through the EGP was allocated as follows:
• Tallawarra, a licenced power station site near Lake Illawarra, to be supplied
from the EGP, since it is adjacent to that pipeline and it minimises
electricity distribution charges; and
• additional increments of capacity (excluding Tallawarra) would be supplied
xx% by the MSP and xx% by the EGP.
For non-electricity, the estimates of individual sources of gas throughput on
the EGP were derived as follows:
• in NSW, historical gas loads taken over by the EGP (BHP Newcastle and
Pt Kembla, Sithe, estimates for other foundation customers/retailers such
as Energy Australia and Country Energy);
• plus estimates of EGP deliveries to regional NSW (Cooma, Bombala,
Nowra) and to the ACT; and
Determining the share of NSW/ACT gas demand among MSP, EGP and CSM 12Review of EAPL gas forecasts for the Moomba-Sydney pipeline
• plus estimates of more recent load ‘switching’ – that is, new NSW retailers
using the EGP and AGL Wholesale Gas supplementing its Moomba
supplies with further gas from the EGP, as recently announced by AGL.
These individual sources were assumed to be held constant at a "base" level
after 2003 (except for AGL Wholesale Gas, as set out below).
Growth in the EGP deliveries is then accounted for by:
• assuming that AGL Wholesale Gas has bought additional supplies from
the Bass Strait producers via the EGP
– these peak at xx.x xx pa by 2009 and are held constant thereafter; and
• assuming the EGP captures xx% of non-electricity market growth in NSW
and adding the EGP's estimated share of new gas for generation.
The total of the base EGP throughput plus growth from 2004 gives the total
NSW/ACT demand supplied by EGP to 2023. MSP supply was then derived
by subtracting gas supplied on the EGP and CSM from NSW/ACT demand.
4.1.2 ACIL Tasman methodology
ACIL Tasman has projected gas supply by pipeline through its GasMark model
(see Attachment B for a description of the model). Potential demand has been
assumed to remain constant, although actual demand met will depend on the
delivered price of gas.
The timeframe being considered here (2002-2023) is a lengthy one in
modelling terms. There is considerable uncertainty in dealing with such a
timeframe. ACIL Tasman has dealt with the uncertainty by developing two
potential scenarios of how the future gas market may unfold rather than relying
on one projection. The scenarios are the northern gas supply scenario
(Scenario 1) and the southern gas supply scenario (Scenario 2).
The main supply assumptions for Scenario 1 are set out in Table 2. In Scenario
1, northern gas fields are dominant due to relatively large discoveries of gas
assumed in the Timor Sea and PNG, and pipeline delivery to Moomba. New
discoveries and reserve additions in the Gippsland and Otway Basins are
assumed to be limited by comparison.
The new discoveries for Gippsland total 1,015 PJ and for Otway offshore
200PJ to 2023. The assumed discoveries for Gippsland are consistent with the
amount estimated in recent work by the US Geological Survey at the 95%
confidence level3. This then is a conservative estimate for southern gas supply.
3 Oil and Gas Resources of Australia 2000, Geoscience Australia, 2001.
Determining the share of NSW/ACT gas demand among MSP, EGP and CSM 13Review of EAPL gas forecasts for the Moomba-Sydney pipeline
Table 2: Gas resource assumptions for the northern gas supply scenario (Scenario 1)
Total new
Peak Rem aining
discoveries,
Field nam e Field # Portfolio Start year production Peak year reserves
additions to
(PJ/Year) (PJ)
reserves, 2002-
2023 (PJ)
Gippsland 1 ESSO / BHPBilliton 1970 325 2010 7690 1015
SWQ 2 Santos 1994 120 2001 2255 690
CBSA 3 Santos 1969 160 2001 2516 460
Otw ay Onshore 4 Misc 1979 25 2004 155 140
Bow en/Surat 5 OCA/Santos 1970 20 1999 218 100
Amadeus 6 Magellan 1985 35 1999 488 0
Bayu Undan 7 Phillips/Woodside 2006 195 2007 4900 1550
PNG 8 PNG JV 2007 350 2010 6600 2375
CSM Bow en 9 Bow en 2000 40 2010 800 1160
CSM Surat 10 Surat 2001 30 2010 500 1650
CSM Sydney 11 Sydney 2001 12 2005 200 1100
Katnook 12 AWE 1997 20 2003 84 77
Otw ay Offshore 13 Woodside/Origin 2006 75 2006 1100 200
Bass 14 AWE/Cal Energy/Origin 2003 23 2004 378 110
Gilmore 15 Energy Equity 1998 1.0 2001 40 10
CSM Moranbah 16 CH4 2005 20 2006 500 450
Minerva 17 BHP Billiton 2004 55 2005 317 0
Timor Sea 18 Other 2007 300 2007 3400 900
Source: ACIL Tasman
The key supply assumptions behind Scenario 2 are set out in Table 3. Scenario
2 assumes much larger discoveries of gas in the Gippsland and Otway Basins
compared with Scenario 1 (consistent with the US Geological Survey mean
estimates for new discoveries of gas). The assumed discoveries and additions
to reserves allow greater peak production in Scenario 2 for Gippsland (450 PJ
per annum) and Otway Offshore (125 PJ per annum) relative to Scenario 1
(350PJ per annum and 75 PJ per annum respectively).
These new discoveries would have the effect of increasing the commercial risks
of attempting to deliver Timor Sea gas to Moomba. The assumption is that, in
the face of these risks, such a pipeline would not be built.
The prospects for PNG gas are, however, a different matter. Although there
remains considerable uncertainty about the actual start-up date, ACIL
Tasman’s view is that PNG gas will be delivered to Queensland in the forecast
period. Consequently, in both scenario 1 and 2 the option of PNG gas, or
Queensland gas displaced by PNG gas, being sold into southern markets is
available in the modelling.
ACIL Tasman has conducted GasMark model runs for each of the scenarios.
Determining the share of NSW/ACT gas demand among MSP, EGP and CSM 14Review of EAPL gas forecasts for the Moomba-Sydney pipeline
Table 3: Gas resource assumptions for the southern gas supply scenario (Scenario 2)
Peak Rem aining Total new
Field nam e Field # Portfolio Start year production Peak year reserves discoveries,
(PJ/Year) (PJ) additions to
reserves, 2002-
2023 (PJ)
Gippsland 1 ESSO / BHPBilliton 1970 450 2010 7690 4100
SWQ 2 Santos 1994 120 2001 2255 690
CBSA 3 Santos 1969 160 2001 2516 460
Otw ay Onshore 4 Misc 1979 25 2004 155 140
Bow en/Surat 5 OCA/Santos 1970 20 1999 218 100
Amadeus 6 Magellan 1985 35 1999 488 0
Bayu Undan 7 Phillips/Woodside 2006 195 2007 4900 0
PNG 8 PNG JV 2007 300 2010 6600 0
CSM Bow en 9 Bow en 2000 40 2010 800 1160
CSM Surat 10 Surat 2001 30 2010 500 1650
CSM Sydney 11 Sydney 2001 12 2005 200 1100
Katnook 12 AWE 1997 20 2003 84 77
Otw ay Offshore 13 Woodside/Origin 2006 125 2006 1100 1200
Bass 14 AWE/Cal Energy/Origin 2003 23 2004 378 110
Gilmore 15 Energy Equity 1998 1.0 2001 40 10
CSM Moranbah 16 CH4 2005 20 2006 500 450
Minerva 17 BHP Billiton 2004 55 2005 317 0
Timor Sea 18 Other 2007 200 2007 3400 0
Source: ACIL Tasman
Are the northern and southern gas scenarios plausible?
ACIL Tasman takes the view that there are many plausible scenarios that could
be constructed for gas supply to NSW/ACT (and other markets) in the period
to 2023. While there are very many variables to deal with, it is the case that the
remaining reserves from existing discoveries of gas in the main basins the
Cooper/Eromanga, Gippsland, and Otway are not sufficient to meet
potential demand at current real prices beyond about 2010. Consequently, the
size and timing of new discoveries of gas will have a significant bearing on how
demand is met.
ACIL Tasman has constructed two plausible, regionally dominant scenarios of
the potential sources of supply for NSW/ACT and Victoria gas markets. The
northern supply scenario is triggered by low discoveries of gas in the
Gippsland and Otway basins. The southern supply scenario demonstrates how
large discoveries in these basins could delay new supply from the Timor Sea,
but not from PNG, until after the forecast period.
Experience would suggest, however, that some middle course would probably
eventuate through incremental change in gas reserves. For example, it may be
Determining the share of NSW/ACT gas demand among MSP, EGP and CSM 15Review of EAPL gas forecasts for the Moomba-Sydney pipeline that a combination new gas discoveries made in the Cooper/Eromanga, Gippsland and Otway Basins in a similar time period to continue a gradual shift from historical supply from the north (Moomba) toward a ‘balance’ between supply sources. Hence, the amounts of gas transported on the MSP versus the EGP are similarly influenced. Consequently, ACIL Tasman’s methodology may be seen as a means of estimating the bounds of reasonable forecast flows on the MSP. 4.2 Forecast shares of NSW/ACT gas demand 4.2.1 CSM Figure 6 shows the projected CSM supply by ACIL Tasman and EAPL, both of which are based on Sydney Gas Company information. Further, as discussed in section 3.2, ACIL Tasman has also raised the possibility of Hunter Valley CSM supplying a CCGT late in the period. CSM supply has been held constant across the two ACIL Tasman gas supply scenarios. ACIL Tasman forecasts higher supply by CSM over the projection period compared with the EAPL forecast. ACIL Tasman’s view is that, if the initial stages of production by the Sydney Gas Company proceed, then production would expand very quickly. In addition, based on the technological developments taking place in Queensland, there must be some possibility that a third CCGT scheduled for 2018 might be best sited in the Hunter Valley. If this were the case, then this would raise the opportunity for around 15PJ per annum of CSM to be utilised instead of natural gas by 2023, with implications for the MSP and/or the EGP. Determining the share of NSW/ACT gas demand among MSP, EGP and CSM 16
Review of EAPL gas forecasts for the Moomba-Sydney pipeline

Figure 6: Potential CSM supply

                                                                          Sydney CSM

      30

      25

      20
 PJ

      15

      10

       5

       0
           2002

                  2003

                         2004

                                2005

                                       2006

                                              2007

                                                     2008

                                                            2009

                                                                   2010

                                                                          2011

                                                                                 2012

                                                                                        2013

                                                                                                2014

                                                                                                       2015

                                                                                                              2016

                                                                                                                     2017

                                                                                                                            2018

                                                                                                                                   2019

                                                                                                                                          2020

                                                                                                                                                 2021

                                                                                                                                                        2022

                                                                                                                                                               2023
                                          EAPL                       AT                        AT (additional CSM)

Data source: ACIL Tasman

4.2.2       EGP

Impact of gas supply scenarios
Figure 7 shows a comparison between the ACIL Tasman modelled scenarios
and the EAPL forecasts for gas flows on the EGP. EAPL’s methodology for
forecasting market share results in a reasonably steady growth for EGP.

Determining the share of NSW/ACT gas demand among MSP, EGP and CSM                                                                                                    17
Review of EAPL gas forecasts for the Moomba-Sydney pipeline
Figure 7: Forecast gas flow on the EGP
EGP
140
120
100
80
PJ
60
40
20
0
2002
2003
2004
2005
2006
2007
2008
2009
2010
2011
2012
2013
2014
2015
2016
2017
2018
2019
2020
2021
2022
2023
EAPL
AT South
AT North (no competitive tariff response on EGP)
Source: ACIL Tasman
ACIL Tasman’s methodology results in quite different outcomes that
encompass the EAPL forecast. The GasMark results are best explained by
examining the profile of contracts understood to be held by the EGP and by
the two gas supply scenarios assumed by ACIL Tasman.
Figure 8 is the output from GasMark for the EGP under Scenarios 1 (right-
hand chart) and 2 (left-hand chart). The charts show:
• the impact of the existing contracts estimated by ACIL Tasman, which
make up the bulk of EGP supply in the first half of the period; and
• the impact in the later half of the projection period of the assumptions
about northern and southern gas supply.
In ACIL Tasman’s Scenario 1, significant new discoveries and reserve
additions in the northern gas fields encourages the construction of a pipeline to
supply Moomba with Timor Sea gas. The limited gas reserves in southern gas
basins means that these producers prefer the higher margins of supplying gas
to the Victoria market rather than competing with the new supplies, even
though the latter are likely to be delivered at a higher price than current
supplies. The outcome is to place significant downward pressure on EGP
tariffs if the existing supply contracts are to be renewed (although no tariff
response is included in these charts). In this case, the modelled flows on the
EGP could be as low as a few petajoules by 2016.
Determining the share of NSW/ACT gas demand among MSP, EGP and CSM 18Review of EAPL gas forecasts for the Moomba-Sydney pipeline
Figure 8: EGP gas flows as estimated by GasMark – southern gas scenario left-hand chart and northern
gas scenario right-hand
Southern gas scenario Northern gas scenario
120 120
100 100
80 80
Throughput (PJ)
Throughput (PJ)
60 60
40 40
20 20
0 0
2002
2003
2004
2005
2006
2007
2008
2009
2010
2011
2012
2013
2014
2015
2016
2017
2018
2019
2020
2021
2002
2003
2004
2005
2006
2007
2008
2009
2010
2011
2012
2013
2014
2015
2016
2017
2018
2019
2020
2021
Existing Contracts Gippsland Bass Existing Contracts Gippsland Bass
Data source: ACIL Tasman
Clearly, in the circumstances of the northern gas supply scenario, the EGP is
not viable beyond about 2013. The more likely outcome would be for the
EGP to respond with tariff concessions.
Figure 9 shows the effect of a competitive lowering of tariffs on the EGP in
the northern gas scenario. Despite a competitive lowering of tariffs, supply on
the EGP does not grow in the second half of the projection period. The key
reason is again that the modest additions to reserves in the Gippsland and
Otway Basins are directed by those producers to the higher returns to be had
from the Victoria gas market.
In summary, the EGP is vulnerable in a scenario where there are limited new
discoveries of gas in southern basins.
Determining the share of NSW/ACT gas demand among MSP, EGP and CSM 19Review of EAPL gas forecasts for the Moomba-Sydney pipeline
Figure 9: EGP gas flows – with tariff response in the northern gas scenario
EGP
140
120
100
80
PJ
60
40
20
0
2002
2003
2004
2005
2006
2007
2008
2009
2010
2011
2012
2013
2014
2015
2016
2017
2018
2019
2020
2021
2022
2023
EAPL
AT South
AT North (competitive tariff response on EGP)
Source: ACIL Tasman
The point is clearly demonstrated in ACIL Tasman’s Scenario 2, and shown in
the left-hand chart of Figure 8. In this scenario, significant discoveries and
additions to reserves in the Gippsland and Otway Basins discourage the
construction of a pipeline to supply gas from the Timor Sea to Moomba. The
competitively priced gas available from Gippsland, which is now excess to
Victorian demand, would encourage producers to continue to capture NSW
markets supplying gas on the EGP. Substantial penetration into southern
markets by gas from the north would be delayed beyond the forecast period.
Impact of CSM
Figure 10 shows the potential displacement of supply on the EGP, in the
southern gas scenario, from additional CSM being used for electricity
generation late in the projection period.
This has not been modelled by GasMark, and the outcome shown would be
subject to debate about whether the gas supply displaced would have been
delivered by the EGP or by the MSP. ACIL Tasman’s judgement is that, if it is
gas displaced from the EGP, then this is most likely the case in the southern
gas scenario. As already discussed, in the northern gas scenario, the EGP
struggles to be competitive, and it is more likely that CSM replaces flows in the
MSP in this scenario.
Determining the share of NSW/ACT gas demand among MSP, EGP and CSM 20Review of EAPL gas forecasts for the Moomba-Sydney pipeline
Figure 10: EGP gas flow – with EGP tariff response in the northern gas
scenario and additional CSM supply in the southern gas scenario
EGP
140
120
100
80
PJ
60
40
20
0
2002
2003
2004
2005
2006
2007
2008
2009
2010
2011
2012
2013
2014
2015
2016
2017
2018
2019
2020
2021
2022
2023
EAPL
AT South
AT North (competitive tariff response on EGP)
AT South (additional CSM)
Source: ACIL Tasman
4.2.3 MSP
Impact of the gas supply scenarios
Figure 11 shows the GasMark modelled total flows (to meet NSW/ACT
demand and to augment supplies to Victoria) on the MSP by source for each
of the ACIL Tasman scenarios.
Determining the share of NSW/ACT gas demand among MSP, EGP and CSM 21Review of EAPL gas forecasts for the Moomba-Sydney pipeline
Figure 11: MSP total gas flows – southern gas scenario left-hand chart and northern gas scenario right-
hand chart
Southern gas scenario Northern gas scenario
250 250
200 200
Throughput (PJ)
Throughput (PJ)
150 150
100 100
50 50
0 0
2002
2003
2004
2005
2006
2007
2008
2009
2010
2011
2012
2013
2014
2015
2016
2017
2018
2019
2020
2021
2002
2003
2004
2005
2006
2007
2008
2009
2010
2011
2012
2013
2014
2015
2016
2017
2018
2019
2020
2021
Existing Contracts SWQ CBSA Otw ay Onshore PNG Otw ay Offshore Existing Contracts SWQ CBSA Bayu Undan Timor Sea
Data source: ACIL Tasman
For GasMark, the NSW/ACT demand for gas supplied through the MSP is
represented by the Dalton – Wilton portion of the pipeline plus deliveries to
central NSW and the ACT, net of deliveries to Victoria on the interconnector.
Taking these modelled gas flows, and removing the flows to Victoria, Figure
12 compares projected supply on the MSP by ACIL Tasman and EAPL to
meet NSW/ACT demand. Consistent with the equivalent scenarios for the
EGP, the ACIL Tasman forecasts show lower flows on the MSP in the first
half of the period, and the two gas supply scenarios bound the EAPL forecast
in the later part of the period.
Determining the share of NSW/ACT gas demand among MSP, EGP and CSM 22Review of EAPL gas forecasts for the Moomba-Sydney pipeline
Figure 12: Gas flows on the MSP to meet NSW/ACT demand
MSP
200
160
120
PJ
80
40
0
2002
2003
2004
2005
2006
2007
2008
2009
2010
2011
2012
2013
2014
2015
2016
2017
2018
2019
2020
2021
2022
2023
EAPL
AT South
AT North (no competitive tariff response on EGP)
Source: ACIL Tasman
Figure 13 displays the effect of the competitive tariff response by the EGP to
increase flows in the northern gas scenario. In this case, the ACIL Tasman
scenarios more closely bound the EAPL forecast. Again, in the first half of the
period, ACIL Tasman shows lower flows on the MSP (corresponding to ACIL
Tasman’s estimates of higher contracts on the EGP).
Equally, although not modelled by ACIL Tasman, in the southern gas scenario
it might be expected that the MSP would respond to lower gas flows with a
competitive tariff response.
Determining the share of NSW/ACT gas demand among MSP, EGP and CSM 23Review of EAPL gas forecasts for the Moomba-Sydney pipeline
Figure 13: Gas flows on the MSP to meet NSW/ACT demand − with a
competitive tariff response on the EGP
MSP
200
160
120
PJ
80
40
0
2002
2003
2004
2005
2006
2007
2008
2009
2010
2011
2012
2013
2014
2015
2016
2017
2018
2019
2020
2021
2022
2023
EAPL
AT South
AT North (competitive tariff response on EGP)
Source: ACIL Tasman
ACIL Tasman has commented on the risks to the EGP associated with limited
new gas discoveries in southern basins. Figure 12 and Figure 13 show the risks
to the MSP of significant new gas discoveries in these basins.
CSM impact
Figure 14 displays the impact of increased CSM supply in the northern
scenario where there has already been a competitive tariff response on the
EGP to the high northern gas supply. As discussed earlier, it is in these
circumstances that the use of CSM to supply electricity generation is more
likely to impact on the MSP (as opposed to the EGP).
Determining the share of NSW/ACT gas demand among MSP, EGP and CSM 24Review of EAPL gas forecasts for the Moomba-Sydney pipeline
Figure 14: Gas flows on the MSP to meet NSW/Act demand − with a
competitive tariff response on the EGP and additional CSM supply
MSP
200
160
120
PJ
80
40
0
2002
2003
2004
2005
2006
2007
2008
2009
2010
2011
2012
2013
2014
2015
2016
2017
2018
2019
2020
2021
2022
2023
EAPL
AT South
AT North (competitive tariff response on EGP)
AT North (competitive tariff response on EGP and additional CSM)
Data source: ACIL Tasman
Implications of swaps
Gas “swaps” have the potential to further complicate the picture with regard to
pipeline flows, and hence revenues. A gas swap occurs when two suppliers
enter into an agreement whereby each makes physical delivery to the other’s
customer such that both contractual supply commitments are fulfilled without
the necessity of physical transport between the original supplier−customer
pairs.
This can be illustrated with a hypothetical example (see Figure 15). In this
example, two gas supply contracts are assumed to exist. The first relates to
supply of gas from the Cooper Basin in South Australia to a customer in
Melbourne, via the MSP mainline, the New South Wales–Victoria
interconnector and the northern Victorian transmission system (the
“contractual path” for Contract 1). The second is for supply of gas from the
Gippsland Basin to a customer in Sydney via the EGP (the “contractual path”
for Contract 2).
Determining the share of NSW/ACT gas demand among MSP, EGP and CSM 25Review of EAPL gas forecasts for the Moomba-Sydney pipeline
Figure 15: Hypothetical gas swap scenario
Cooper Moomba
Basin
Physical
Path 2
Young
Contractual
Path 1
Wagga Wagga Sydney
Culcairn
Contractual
Path 2
Melbourne
Gippsland
Basin
Physical
Path 1
Data source: ACIL Tasman
Depending on the nature of the transportation arrangements relating to the
two gas supply contracts, it may be commercially attractive for the producers
to enter into a swap arrangement that would result in:
• some or all of the Sydney customer’s contractual entitlements being
supplied by gas from the Cooper Basin producer, delivered via the MSP
mainline (the "physical delivery path" for Contract 2); and
• some or all of the Melbourne customer’s contractual entitlements being
supplied by gas from the Gippsland Basin producer, delivered via the
southern Victorian transmission system (the "physical delivery path" for
Contract 1).
Under this swap arrangement, gas notionally delivered from the Cooper Basin
into Melbourne would not travel across the interconnector or the northern
Victorian transmission system into Melbourne, and could therefore potentially
avoid transmission charges for those systems. Similarly, the gas notionally
delivered from the Gippsland Basin into Sydney would not travel across the
EGP, and would avoid charges for use of that system.
Whether or not there is a commercial incentive to enter into a swap
arrangement will depend among other things upon the nature of the
transportation contracts associated with the counter-party gas sales agreements.
In the example set out above, there may be no advantage to be gained from the
Determining the share of NSW/ACT gas demand among MSP, EGP and CSM 26Review of EAPL gas forecasts for the Moomba-Sydney pipeline swap if both contracts have associated ship-or-pay commitments to the operators of the pipeline on the contractual pathways. In such circumstances, the swap will only occur if the price differential available is sufficient to meet any ship-or-pay costs and still yield a margin to the parties entering into the swap arrangement. However, to the extent that the transportation agreements contain flexibility provisions that allow the producers, without incurring any penalty, to vary the quantities of gas submitted for transportation, a swap arrangement could allow transportation costs to be avoided. In the extreme, the gas sales contracts could be settled without making any corresponding agreements for transport on the contractual pathways, in anticipation of a swap arrangement being negotiated. For example, in the hypothetical situation described above, the Cooper Basin producer could enter into Contract 1 for sale of gas into Melbourne without making any transportation arrangements involving use of the interconnector or the northern Victorian transmission system if, at the time of entering into the contract, the swap arrangement was anticipated. Some of the same principles apply to backhaul transportation: gas supply contracts involving backhaul transportation may simply act to reduce the physical forward haul flow through the relevant pipeline (and therefore, potentially, the revenues attributable to that pipeline). ACIL Tasman’s modelling using GasMark does not routinely take into account gas swaps. For modelling purposes, it is assumed that allocations of gas from a producer to a customer occurs via the least cost available pipeline path or, in the case of existing contracts, via the specified pipeline path. Calculated pipeline flows and revenues therefore reflect an assumption that physical delivery of all gas allocations occurs via the least-cost path (effectively the "contractual path"). Swap arrangements have the potential to modify the modelled pipeline flows, and therefore the implied revenue outcomes for particular pipeline segments. Each swap arrangement is likely to result in increased flows in one or more pipelines, at the expense of flows in another pipeline or pipelines. However, the net result of increased use of swaps will be to allow producers and consumers to optimise physical transportation of gas in the satisfaction of supply contracts. This will in turn reduce total payments for pipeline transportation — that being the underlying rationale for the use of swap agreements. As the number of alternative gas suppliers in eastern Australia rises and the level of interconnection of the transmission pipeline network increases further, more opportunities for swaps will arise and the use of swap mechanisms will become more widespread. The overall effect will be to increase the efficiency of the system by offering additional flexibility in contracting arrangements. However, pipelines such as the MSP, which are part of an integrated pipeline Determining the share of NSW/ACT gas demand among MSP, EGP and CSM 27
You can also read