February 2018 - University of Otago
←
→
Page content transcription
If your browser does not render page correctly, please read the page content below
Dunedin Energy Study 2016/2017

              February 2018

                          pg. 0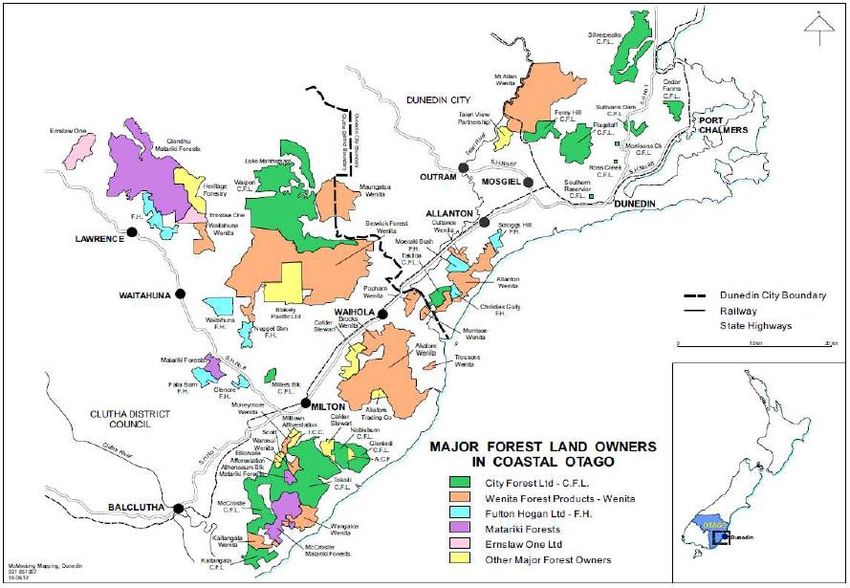
Dunedin Energy Study 2016/2017

Prepared for:

Dunedin City Council (DCC), New Zealand

Prepared by:

Warren Fitzgerald

Centre for Sustainability, PO Box 56, University of Otago

Dunedin, New Zealand

February 2018

                                                                                  pg. 1
Dunedin Energy Study 2016/2017
Table of Contents
EXECUTIVE SUMMARY 3
OVERVIEW 6
LIQUID FOSSIL FUELS 9
PETROL AND DIESEL 9
LPG 12
ELECTRICITY 16
BIOMASS 23
WOOD PELLETS 23
WOODCHIPS 25
OAT HUSKS 26
FIREWOOD 26
TOTAL WOOD FUELS 28
COAL 29
SULPHUR 31
GREENHOUSE GAS EMISSIONS 32
NATIONAL COMPARISONS 33
CONCLUSIONS 37
pg. 2Dunedin Energy Study 2016/2017
Executive summary
The Dunedin Energy Study is a joint research project between the Dunedin City Council
(DCC) and the Centre for Sustainability at the University of Otago. The study takes stock
of, and analyses energy inputs into the city of Dunedin.
In this study, “Dunedin” refers to the area under jurisdiction of the Dunedin City Council
(DCC), which is surrounded by Waitaki District in the north, Central Otago District in the
west, Clutha District in the south and the Pacific Ocean in the east.
This is the third consecutive year this study has been run and investigates energy
consumption within Dunedin during the 2017 financial year (2017FY), referring to the
financial year period 1 July 2016 – 30 June 2017. The first Dunedin Energy Study
investigated the 2014 calendar year.
This study is an action under the DCC’s Energy Plan 1.0, which recognises the need to
encourage research that will enable the monitoring of Dunedin's energy uses and
inputs. It will also help inform and assist with implementing other Energy Plan 1.0's
actions, such as the Electric Vehicles action (promoting EV uptake and supporting
infrastructure development) and Biomass action (expanding the production and use of
biomass energy).
This study was conducted between December 2017 and February 2018, and provides
an estimation of the total amount of each energy type used within the city, along with
an indication of the end uses of energy, and energy-related greenhouse gas emissions.
The project relied entirely on the willingness of many businesses and organisations who
supplied data. The project’s partners are extremely grateful to all participating
individuals and organisations who dedicated a considerable amount of time to sourcing,
compiling and providing relevant data.
Summary of energy inputs
A total of 13.53 PJ of energy was consumed in Dunedin during the 2017FY.
Diesel is the single largest energy source consumed in Dunedin, making up 29% of all
energy use within the city. This is followed by electricity (23%), petrol (20%), biomass
(17%), coal (5%), LPG (4%) and sulphur (1%). These energy inputs are summarised in
Figure 1.
pg. 3Dunedin Energy Study 2016/2017
60%
50% LPG
40%
Diesel
30%
20% Oat Husks
Wood Pellets
Woodchips
10% Petrol
Firewood
0%
Liquid Fuels Electricity Biomass Coal Sulphur
Figure 1: Energy consumption profile for Dunedin city during the 2017FY
Sources of energy
A total of 79% of the energy used in Dunedin during the 2017FY was sourced from
outside the city boundaries. All petrol, diesel, LPG, coal and sulphur are imported into
Dunedin from other regions in New Zealand or from overseas. The majority of
Dunedin’s electricity use (82%) is derived from the national grid, and nearly all wood
pellets are imported from Taupō based processors.
Locally sourced energy inputs are entirely made up of biomass (97% locally sourced)
and electricity (18% locally sourced). During the 2017FY, 0.566 PJ of electricity was
produced from locally embedded generators. It is assumed that firewood (self-collected
and retail) is sourced from within the city boundaries. Approximately 1.394 PJ of
firewood was consumed in Dunedin in the 2017FY.
Overall, 21% of the total energy used in Dunedin during the 2017FY was locally
sourced. This comprised of 17% from biomass (mainly firewood and wood chips) and
4% from locally embedded electricity generation.
It should be noted that Waipori (hydro) and Mahinerangi (wind) power schemes are
located outside the city limits but are considered ‘local’ as the generated electricity is
fed directly into the Dunedin electricity network.
Renewable sources
Around 37% of Dunedin’s total energy consumption was from renewable sources. This
is comprised of 20% from renewable electricity and 17% from biomass. In comparison,
pg. 4Dunedin Energy Study 2016/2017
approximately 40.2% of energy consumed nationally in 2016 was from renewable
sources1.
In the 2017FY, around 85% of electricity supplied to Dunedin was generated from
renewable resources. For the purpose of this study, all biomass (predominately wood)
fuels are also considered renewable.
Greenhouse gas emissions
During the 2017FY, approximately 642.1 kt CO2-e (kilotonnes of CO2-equivalent
greenhouse gas emissions) was attributed to energy use in Dunedin. Over 76% of these
emissions are attributed to liquid fossil fuel (petrol, diesel and LPG) consumption, 13%
was attributed to electricity use in the city, 9% to coal use and 2% to biomass (mainly
wood products).
500
LPG
400
Diesel
300
200
100 Petrol
0
Liquid Fuels Electricity Biomass Coal
Figure 2: Greenhouse gas emissions associated with Dunedin's energy consumption
during the 2017FY
Comparability to previous Dunedin Energy Studies
In 2014 the Dunedin Energy Baseline Study was completed. The baseline study was the
first attempt to capture energy sources supplied to Dunedin. This third consecutive
Dunedin Energy Study has further refined the data collection and analysis methodology
developed in the previous studies. This study can be compared to the 2016FY results,
but it should be noted that some changes have been made in this study. These changes
are detailed in the relevant section, and where applicable, results from previous years
have been updated to match the current methodologies used in this study.
1
Data sourced from MBIE, Energy in New Zealand 2017: http://www.mbie.govt.nz/info-services/sectors-
industries/energy/energy-data-modelling/publications/energy-in-new-zealand/#data
pg. 5Dunedin Energy Study 2016/2017
Overview
About Dunedin
In this study, “Dunedin” refers to the area under jurisdiction of the Dunedin City Council
(DCC), which is surrounded by Waitaki District in the north, Central Otago District in the
west, Clutha District in the south and the Pacific Ocean in the east (Figure 3).
Dunedin had a population of 120,249 in 2013 (Statistics NZ, Census 2013)2. Dunedin is
the second largest city in the South Island and the largest in the Otago Region. It has
2.8% of New Zealand’s population (Statistics NZ, Census 2013) and is the 5th largest in
size of the 67 districts in New Zealand.
Figure 3: Dunedin City Boundaries
In terms of employment, the three largest industries in Dunedin are education and
research (6,990 full time equivalents), tourism (3,134 full time equivalents) and primary
processing (1,687 full time equivalents)3.
2
Updated statistics will be available after the national census on the 6th March 2018
3Source: http://www.dunedin.govt.nz/__data/assets/pdf_file/0017/511433/2014-Economic-Profile-of-the-Otago-
Region-and-Dunedin-City-FINAL.pdf
pg. 6Dunedin Energy Study 2016/2017
Dunedin had a gross domestic product (GDP) of $5.314 billion in 2014 (Otago Economic
Overview, 2014). The University of Otago is Dunedin’s largest employer contributing
approximately 17% of Dunedin’s GDP4.
Comparative growth
Statistics New Zealand has projected 5 that Dunedin should experience medium
population growth, at approximately 0.5% a year between 2013 and 2018. In 2014 there
was 2.4% economic growth 6 . Both population and economic activity are usually
positively correlated to energy consumption. It is important to keep this in mind when
analysing the fuel use trends throughout this report.
About the Dunedin Energy Study
In 2014 the Dunedin Energy Baseline Study was completed. At the time, there was no
single source of information of the amount of energy consumed in Dunedin – including
households, transport, businesses, education, farming and industry. This information is
important for informing the development of strategies for the future of the City. In 2014
the DCC joined the Compact of Mayors, which is a global coalition of city leaders who
have pledged to cut greenhouse gas emissions and prepare for the future impacts of
climate change. The Dunedin Energy Study is an important action under the DCC’s
Energy Plan 1.0 to improve the understanding of energy consumption within the
district.
The Dunedin Energy Study focuses on end use energy within Dunedin, as well as energy
imported into Dunedin and energy produced/generated in Dunedin. The study looks at
consumer energy inputs only, not energy embedded in goods and services.
The primary aim of the current Dunedin Energy Study is to build on previous studies to
start to expose energy use trends. Further refinements to data collection and analysis
have been made to help improve some of the data gaps from previous reports. Data is
presented for the 2017 financial year (2017FY - 1 July 2016 to 31 June 2017).
Much of the data collated in this report was not publicly available and relied on the
participation and willingness of the businesses and organisations who supplied it.
Where available, more in-depth data is presented to show temporal and spatial
patterns of energy use.
The only similar source of information that shows energy use by geographic region in
New Zealand is the Energy End Use Database held by the Energy Efficiency and
Conservation Authority (EECA), which has an estimate for energy used by the Otago
4 Source: University of Otago Annual Report 2015
5 Source: Statistics New Zealand: Subnational Population Projections: 2013(base)–2043
6 Source: Business and Economic Research Limited’s 2014 Economic Profile of the Otago Region and Dunedin City
pg. 7Dunedin Energy Study 2016/2017
Region for 2012 calendar year. A comparison between the findings of this report and
those from the Energy End Use Database is included in the National Comparisons
section (page 34).
Research was undertaken by researchers at the University of Otago. Ethical approval
was granted for the research project. Individuals and organisations participating in the
study were given options regarding the anonymity and confidentiality of the data
provided. Where requested, anonymity has been preserved by aggregating the energy
inputs by fuel type. The raw data collected is securely stored at the University of Otago
and is only available to the study’s primary investigators.
Conversion Factors
Energy data was originally gathered in the units used in that sector. To enable
comparisons, all were converted to the common unit of petajoules (PJ). 1 PJ is
equivalent to 1,000,000,000 MJ. Conversion factors based on net calorific values were
used to convert fuel quantities from the originally reported units as follows:
Energy Form Conversion7 Density8
Electricity 3.6 MJ/kWh N/A
Petrol 35.08 MJ/L 0.73 kg/L
Diesel 38.45 MJ/L 0.83 kg/L
LPG 26.44 MJ/L 0.53 kg/L
Coal 24.303 MJ/kg
Firewood 16.74 MJ/kg 556 kg/m3
Wood pellets 17.17 MJ/kg 640 kg/m3
Wood chips (35% moisture) 8.22 MJ/kg 736 kg/m3
These conversion rates are consistent with previous studies.
7Statistics New Zealand “New Zealand Energy Use: Services sector 2013”
(http://www.stats.govt.nz/browse_for_stats/industry_sectors/Energy/EnergyUseSurvey_HOTP13/Data%20Quality.
aspx#energy); EECA Business “Biomass calorific value calculator” (https://www.eecabusiness.govt.nz/tools/wood-
energy-calculators/biomass-calorific-value-calculator/)
8New Zealand Centre for Advanced Engineering “New Zealand Energy Information Handbook”
(https://ir.canterbury.ac.nz/bitstream/handle/10092/11527/EIH3.pdf?sequence=1)
pg. 8Dunedin Energy Study 2016/2017
Liquid fossil fuels
Methods and Assumptions
Liquid fuels used in Dunedin include petrol, diesel and liquefied petroleum gas (LPG).
These fossil fuels are imported from outside the DCC area.
In this section, petrol and diesel are presented separately from LPG.
Petrol and diesel
Petrol and diesel supply in Dunedin
Petrol and diesel is imported into Dunedin through Port Otago. There are ten companies
that sell petrol and diesel in significant quantities in Dunedin: BP NZ LTD, Chevron
CALTEX, Exxon MOBIL, Z Energy, McKeown & Graham, Allied Petroleum, CRT Farmlands
Fuel, RD Petroleum Ltd, GULL NZ Ltd and Nelson Petroleum Distributors.
The data on Dunedin’s petrol and diesel supplies were compiled using tax data collected
by DCC. DCC collects a Local Authorities Fuel Tax under the Local Government Act 1974,
whereby all quantities of these fuels sold (that comply with the Act) need to be
disclosed and tax files returned. This includes fuel that is distributed through retail and
wholesale outlets, but does not include fuel used to generate electricity, aviation fuel,
LPG, or fuels used for commercial shipping.
The data is collected by DCC for the Tax Area of Coastal Otago, and includes both the
quantities of petrol and diesel sold and the corresponding tax payable. The Tax Area of
Coastal Otago includes geographical regions outside the jurisdiction of DCC (and
therefore outside the study area). The area was defined in 1971 as Dunedin City;
Oamaru, Port Chalmers, St. Kilda, Green Island, Mosgiel, Balclutha, Kaitangata and
Milton Boroughs; and Waitaki, Waikouaiti, Waihemo, Taieri, Bruce and Clutha Counties.
Of these areas, Oamaru and Waihemo lie to the north of Dunedin in what is now Waitaki
District, and Balclutha, Kaitangata and Milton Boroughs, and Clutha County lie to the
south in what is now Clutha District.
DCC uses the comparative percentage of rates incomes in the portions of the three
territorial authorities (Dunedin City, Waitaki District and Clutha District) that lie within
the defined Coastal Otago Tax Area to allocate tax revenue. In the 2017FY the Dunedin
City percentage was 70.44%. This has been applied to the petrol and diesel tax data to
estimate the share of these fuels used in Dunedin.
This study has adopted the ‘percentage of rates income’ method so as to be consistent
with DCC’s strategy for allocation of the fuel taxes. This is consistent with previous
Dunedin Energy Studies.
pg. 9Dunedin Energy Study 2016/2017
Prior to 1 July 2015, the DCC fuel tax data is not separated by fuel type, so the average
proportion of 40% petrol and 60% diesel from 2016FY data was applied to estimate fuel
quantities for the 2015 financial year.
0.3000
0.2500
0.2000
PJ
0.1500
2015 2016 2017
0.1000
Figure 4: Petrol energy sales in Dunedin
0.4500
0.4000
0.3500
PJ
0.3000
0.2500
2015 2016 2017
0.2000
Figure 5: Diesel energy sales in Dunedin
Comparing the total amount of petrol and diesel sold in Dunedin with that imported via
Port Otago, it is apparent that the other regions outside of Dunedin also source their
fuels through Port Otago. Approximately 39.6% of the amount of petrol and diesel
imported through Port Otago was consumed within Dunedin.
pg. 10Dunedin Energy Study 2016/2017
Petrol and diesel consumption in Dunedin
An approximation has been made to account for the transboundary use of transport
fuels. Some of the petrol and diesel purchased in Dunedin service stations will be used
in vehicles that drive beyond the city, and some vehicles coming into the city will have
purchased their petrol and diesel elsewhere. For the purposes of this study it has been
assumed that these quantities would be similar and therefore cancel each other out.
Fuels used to generate electricity are not subject to the Local Authorities Fuel Tax and
therefore not included in Figures 4 and 5. During periods of high electricity demand, the
local network company can request large users to reduce their consumption, which
they are compensated for. This is known as congestion period demand (CPD) and there
are usually 20-30 requests per annum. CPD periods in the 2017FY totalled 113.5 hours.
Various locations around Dunedin consume diesel to run electrical generators for this
purpose and as emergency backup. Three of the largest users in Dunedin (University of
Otago, Dunedin Airport and the Southern District Health Board) consumed a total of
0.002 PJ of diesel to run their generators during the 2017FY. Cumulatively these
organisations make up approximately 20% of the 62 generators registered for demand
response in Dunedin. Assuming all large users within Dunedin have a similar capacity to
generate electricity during peak periods, all generator fuels would contribute an
additional 0.01 PJ (equivalent to 0.26% of total diesel use).
Most of the petrol and diesel consumed within Dunedin is used as transport fuels for
on-road use. Some fuels are used for other purposes such as running machinery, farm
use and for home heating; the relative quantities of these are unknown but their
cumulative values are contained within the DCC fuel tax data. Fuels used to run
electrical generators are a negligible component compared to transport fuels.
A total 6.55 PJ of fuel, comprised of 2.65 PJ of petrol and 3.90 PJ of diesel, was
consumed within Dunedin during the 2017FY.
pg. 11Dunedin Energy Study 2016/2017
LPG
LPG supply in Dunedin
There are four LPG wholesalers in Dunedin: Genesis (Nova), Contact (Rockgas), Elgas
and Ongas. This is distributed to customers either in bottles, tanks or on the local
reticulated LPG network.
Most LPG arrives in Dunedin via coastal shipping, which is then collected and stored by
a logistics handling company in Dunedin. Three of these wholesalers receive their LPG
supply via this method, while the fourth receives the majority of their LPG supplies via
rail directly from the gas fields in Taranaki. This supply was interrupted by the Kaikōura
earthquake on 14th November 2016 and all LPG was temporarily transported via coastal
shipping until an alternative source could be obtained. This has been taken into account
when analysing the provided data.
A model was created based on historic growth rates of LPG consumption and maritime
import data to try and analyse the effect of the Kaikōura earthquake. A moving average
was used to remove the monthly variability caused by the bulk shipments of LPG. Figure
6 shows that both the model and moving average of imports accurately matches the
seasonal variations in LPG consumption. The November 2016 earthquake destroyed
the railway line, which was used to import some LPG into Dunedin, subsequently
resulting in a greater amount of LPG being imported by sea. From the divergence seen
in Figure 6 after November 2016, it was possible to calculate that approximately 36% of
LPG used in Dunedin was previously imported by rail. Previous years’ results have been
updated to reflect this finding.
Supply Averaged Imports Model
Figure 6. Modelled and actual maritime imports of LPG into Dunedin (units removed for
confidentiality)
pg. 12Dunedin Energy Study 2016/2017
As far as can be established, LPG imported into Dunedin is distributed all around the
southern half of the South Island 9 . We have adopted the assumption that this is in
proportion to population, which results in 36% share for Dunedin.
A total of 0.596 PJ of LPG was supplied to Dunedin during the 2017FY
LPG consumption in Dunedin
LPG is used in Dunedin for multiple purposes including industrial applications,
residential use and transport.
Monthly data of LPG consumption and moving average data of imports has been used
to analyse consumption patterns; this is currently the best representation of actual LPG
usage for Dunedin.
0.080
0.070
0.060
LPG Supply (PJ)
0.050
0.040
0.030
0.020
0.010 2015 2016 2017
-
Figure 7: Annual LPG supply trends
Figure 7 shows the monthly trends of LPG supplied to Dunedin. This shows an increase
in consumption over winter months as LPG is a common heating fuel source in the city.
LPG consumption has been increasing at approximately 3% per annum over the
previous 6 years (from 2010 to 2016).
9
The areas supplied roughly correspond to the districts of Dunedin City; Clutha, Central Otago, Queenstown Lakes
(2013 census population: 202,467); Southland, Invercargill City, Gore (2013 census population: 93,339); roughly
half of Westland (i.e. 4,153 based on 2013 census) and about two -thirds of Timaru (i.e. 28,993 based on 2013
census). The total population supplied was therefore estimated to be 328,952. Dunedin’s population of 120,249
amounts to 36% of this total.
pg. 13Dunedin Energy Study 2016/2017
Commercial LPG use in Dunedin
EECA has a Heat Plant Database that contains public information about boilers in New
Zealand10. A similar dataset was obtained from Ahika and the Bioenergy Association of
New Zealand (BANZ). Both datasets were compiled and validated against actual
consumption data from the University of Otago, Dunedin City Council and the Southern
District Health Board.
Commercial LPG demand was equivalent to 0.287 PJ during the 2017FY.
Residential LPG use in Dunedin
Many households in Dunedin use LPG for water heating, space heating and cooking.
There is currently no way of determining how much LPG is used residentially and for
what exact purpose the LPG is being used in the household. Approximations have been
made based on census results and should be updated after the completion of the 2018
census.
A linear regression of census data from 2001, 2006 and 2013 was used to predict that
5,263 Dunedin households used bottled or reticulated gas as a heating fuel in 2017FY.
The Home Heating Report11 from 2005 estimates that households that use gas would
use an average of 2kg of gas per day in both winter and non-winter months.
Dunedin’s residential LPG use was approximately 0.19 PJ in the 2017FY.
LPG used for transport in Dunedin
LPG is also used as a transport fuel. In Dunedin, there are four petrol stations that sell
LPG. These are Burnside Service station, Green Island; Complete Auto Repairs Ltd,
Hillside Road; Caltex City North and Mobil Anzac Ave.
As at 2014, there were 83 LPG and 3 CNG vehicles in Otago12. This has been scaled in
proportion to population (Dunedin contains 60% of Otago’s population) and therefore
it is assumed that there are 52 LPG vehicles in the city. This corresponds to
approximately 619,200km13 of travel by LPG vehicles. LPG vehicles use 10-20% more
10The EECA heat plant database was last reviewed in 2014 and there may be subsequent changes which have not
been captured on this list.
11Source: Ministry for the Environment, 2005. Warm Homes Technical Report: Home Heating Methods and Fuels in
New Zealand. (Prepared by Emily Wilton)
12Source: Ministry of Transport. It should be noted that this was a count of light vehicles, it does not include other
types of LPG vehicles, for example, forklifts.
13 Source: http://www.transport.govt.nz/assets/Uploads/Research/Documents/New-Zealand-Vehicle-fleet-stats-
final-2013.pdf
pg. 14Dunedin Energy Study 2016/2017
fuel than petrol vehicles and so an LPG consumption of 8.671 litres per 100 km has been
assumed.
Approximately 0.0014 PJ of LPG is used for transportation in Dunedin on an annual
basis.
Demand
Supply
0.000 0.100 0.200 0.300 0.400 0.500 0.600 0.700
Supply Commercial Residential Transport
Figure 8: Comparison of LPG supply and demand in Dunedin for the 2017FY
In the 2017FY, 80% of the assumed LPG supply is accounted for by the calculated
demand for LPG in Dunedin. Calculated supply and demand do not correspond as well
as in previous Dunedin Energy Studies, primarily due to the greater amount of LPG
which is now assumed to be imported into Dunedin. The calculated imports were
updated after the Kaikōura earthquake prevented any rail shipments, which was
previously the largest uncertainty for LPG data in this study.
A total LPG demand of 0.479 PJ was calculated for Dunedin during the 2017FY.
pg. 15Dunedin Energy Study 2016/2017
Electricity
Methods and assumptions
The data on electricity used in Dunedin comes from the lines companies, the energy
advisory company Energy Link and the Electricity Authority database of installed
capacity14 of distributed generation.
There are two main lines companies that operate in Dunedin: Aurora and Otago
PowerNet. Aurora operates in the urban and suburban areas of Dunedin whereas Otago
PowerNet operates in the rural outskirts surrounding the Dunedin urban centre.
Dunedin, which includes the settlements of Hyde, Middlemarch, Clarks Junction,
Hindon, Waitati and Karitane, represents only a small portion of Otago PowerNet’s
territory.
Figure 9: Location of the Aurora network
(green) and Otago PowerNet network (blue) in
relation to Dunedin
In Aurora’s 2017 disclosure year15 there were 54,687 ICPs16 on their network, while
PowerNet had a total of 2,989 ICPs as at January 201817.
14 Installed capacity is the maximum production capacity.
15Auroras reporting period is from 1st April to 31st March whereas the financial year for the rest of this report is 1st
July to 31st June.
16An ICP is an individual connection point; this is the physical point of connection on a network at which a retailer
will be deemed to supply electricity to a consumer. (Electricity Authority, 2016 - http://www.ea.govt.nz/glossary/)
17 There is no monthly breakdown of ICPs on the PowerNet network.
pg. 16Dunedin Energy Study 2016/2017
Electricity supply in Dunedin
Dunedin was supplied with a total of 3.152 PJ of electricity during the 2017FY
Electricity supply from the national grid
During the 2017FY, Dunedin consumed 3.152 PJ of electricity. This was comprised of
2.585 PJ (82%) from the national grid and 0.566 PJ (18%) supplied by generation
embedded in the local network.
Although Dunedin’s electricity is largely generated from renewable South Island
locations, it is integrated within the wider national grid where all demands and supplies
are connected. If a certain demand was therefore removed from the system, the excess
electricity would be used elsewhere within the network. For this reason, national
averages have been used for the renewable proportion of electricity generation, as well
as the subsequent emissions factors for this generation, regardless of whether it was
generated locally or supplied by the national grid.
84.7% of New Zealand’s electricity generation was from renewable sources during the
2017FY.
Local Generation
There are a variety of different electricity generators embedded within the Dunedin
electricity network. Table 1 provides a summary of the known local generators and the
energy sources they use.
To describe these locally embedded generators more fully, we have split them into
three scales: large generators (over 50 MW); mid-scale generators (0.1 MW to 5 MW)
and small-scale (less than 0.1 MW).
pg. 17Dunedin Energy Study 2016/2017
Table 1: Local electricity generation in Dunedin for the 2017FY
Name of Total electricity Total installed
Generating Energy
connected supplied capacity
company type
generator (MWh) (MW)
Waipori 33kV –
Deep Stream 1A, TrustPower Ltd Hydro 50,897 53
Large
2A
generators
Waipori 33kV -
TrustPower Ltd Wind 108,555 36
Mahinerangi
Ravensdown Process
Ravensdown Ltd 566 3
Generation steam
Container Port Port Otago Ltd Liquid fuel 20 1.6
Mid-scale Waste Water Dunedin City
generators Biomass 8 1
Treatment Plant Council
Dunedin
Dunedin Airport International Liquid fuel 0 0.6
Airport Ltd
Various Distributed 253 Individual
Small- Solar 924.518 0.84
Generators connections
scale
Various Distributed 7 Individual
generators Wind 49.619 0.023
Generators connections
Total 161,020 62.1
Large generation schemes
There are two large distributed generation schemes that supply Dunedin with
electricity. These are the Waipori hydropower scheme and the Mahinerangi wind
power scheme. These two systems work in synergy with each other, allowing water to
be preserved while the wind farm is generating. Although both generation schemes lie
outside of Dunedin, they feed directly into Dunedin’s 33 kV network and have therefore
been included in the local generation for Dunedin.
The Waipori hydropower scheme has total of four stations along the Waipori River with
a combined installed capacity of 84 MW, plus an additional 5 MW of capacity at the
Deep Stream hydro scheme. Only 53 MW of this is connected directly into Dunedin’s
Aurora network via a 33 kV transmission network from the Waipori 1A, 2A and Deep
Stream generators to the Halfway Bush substation. Excess generation from the Waipori
18
Solar calculations are based on assumption that the solar panels are north facing at are tilted at 45 degrees. The
solar calculator at https://www.energywise.govt.nz/tools/solar-calculator/ was used to find a conversion rate of
1100kWh/kW a year.
19
Energywise assumes that small wind turbines generate at on 10 to 40% of their rated capacity every hour and so
for this study it has been assumed that on average wind turbines operate at 25% capacity. Therefore, a conversion
rate of 2190kWh/kW a year. https://www.energywise.govt.nz/at-home/generating-energy/small-wind-turbines/ -
Energyoutputofsmallwindturbines
pg. 18Dunedin Energy Study 2016/2017
2A, 3 and 4 generators, is fed into the national grid via a 110 kV transmission line to the
Berwick substation located on the Taieri plains.
Stage 1 of the Mahinerangi wind farm was commissioned in 2011 and contains 12
turbines with a total installed capacity of 36 MW. These were tied into the 33 kV
transmission network from Deep Stream and subsequently all 36 MW of capacity is fed
into the Dunedin network via the Halfway Bush substation. Consent has been granted
for an additional 160 MW of wind generation at the Mahinerangi site, although this
would require upgrades to the transmission network.
The 33 kV Waipori transmission network is currently insufficient to support the full
generating capacity of all the generators installed on it. The various generators are
therefore operated in synergy with each other to allow hydro capacity to be stored
while the Mahinerangi wind farm is generating, all while working within the limits of
the transmission system. To balance out any excess generation, Waipori 2A is
connected to both the local Dunedin network and the national grid so that no
generating capacity is wasted.
In Aurora’s April 2016 – March 2017 financial year Dunedin was supplied with 50,897
MWh (0.1832 PJ) of hydro-generated electricity from the Waipori/Deep Stream system
and 108,555 MWh (0.3908 PJ) of wind-generated electricity from Mahinerangi.
Data is presented in Figure 10 for electricity supplied into the local Dunedin network
from the Waipori, Deep Stream and Mahinerangi generation schemes over the previous
four disclosure years. Some variation is present in both the hydro and wind generated
electricity which is supplied to Dunedin, however any long-term trends may be
influenced by the transmission limits more so than the generation potential.
180,000
160,000 Hydro Wind
Electricity Supplied (MWh)
140,000
120,000
100,000
80,000
60,000
40,000
20,000
-
2014 2015 2016 2017
Figure 10: Electricity supplied directly into Dunedin’s local network from Waipori/Deep
Stream (hydro) and Mahinerangi (wind) generators.
pg. 19Dunedin Energy Study 2016/2017
Mid-scale generation
Mid-scale local generators of electricity are those that have 0.1 MW to 5 MW in
capacity. These include Ravensdown Ltd (from process steam), Port Otago’s container
port (from liquid fuels), and the DCC’s waste treatment plant (from biogas). The
Dunedin Airport also has 0.6 MW of synchronised generation capacity but does not
export any into the local network.
1,200.0
Process Steam
1,000.0
Electricity Supplied (MWh)
Liquid Fuel
800.0
Biomass
600.0
400.0
200.0
-
2014 2015 2016 2017
Figure 11: Electricity supplied by fuel type from mid-scale generators embedded within
the local Dunedin network.
There has been an overall downward trend in the electricity supplied from these mid-
scale distributed generators from 2,031 MWh (0.0073 PJ) for the 2014FY to 594 MWh
(0.0021 PJ) for the 2017FY.
Small-scale distributed generation
Small-scale generators of electricity are those that produce less than 0.1 MW.
As of the 30th of June 2017, there were 253 solar systems and seven wind turbines
connected to the Dunedin electricity network. This corresponds to a calculated
electricity generation of 924.5 MWh (0.0033 PJ) from solar and 49.6 MWh (0.0002 PJ)
from wind for the 2017FY.
pg. 20Dunedin Energy Study 2016/2017
1
0.9
0.8
Installed capacity (MW)
0.7
0.6
Solar
0.5
0.4 Wind
0.3
0.2
0.1
0
Figure 12: Cumulative small-scale installed capacity on the local Dunedin network.
Photovoltaic solar installations in Dunedin have increased 420% in the three-year
period from the end of the 2014FY till the end of the 2017FY. This growth rate appears
to be slowing from around 72% p.a. in the 2015FY, to 35% p.a. in the 2016FY and 10%
p.a. in the 2017FY.
Wind turbine installations in Dunedin have increased 350% in the same three-year
period. Due to the relatively low number of wind turbines installed, this growth has
been relatively stepwise, with an average of one new turbine installed every seven
months during this period.
Large Wind
67.42% Solar
0.57%
Small Wind
0.03%
Biomass
0.01%
Liquid Fuel Process Steam
Hydro 0.01% 0.35%
31.61%
Figure 13: Electricity generated within the Dunedin network during the 2017FY.
pg. 21Dunedin Energy Study 2016/2017
Figure 13 shows the comparative production from locally embedded generators. The
mid-scale and small-scale generators make up less than 1% of the total local
generation, with solar producing the majority of this.
Electricity demand in Dunedin
In the 2017FY, Aurora reported that 48% (380 GWh) of the electricity distributed on its
network was consumed by 47,716 residential connection points; 51% (409 GWh) was
consumed by the 6,967 non-domestic connection points and 1% (7 GWh) was used for
street lighting. Average network losses for the Aurora network during the 2017FY were
5.8%. Network losses are caused by heat generation in powerlines and transformers,
and represents the difference between the amount of electricity which enters the local
grid and that which is delivered to customers.
The Otago PowerNet network had 2,989 ICPs within Dunedin which consumed 29 GWh
of electricity with average network losses of 7.5%.
In the 2017FY 96.7% of Dunedin’s electricity was supplied by Aurora. This network
includes most of the urban areas of Dunedin and is served by the Halfway Bush and
South Dunedin grid exit points. The remaining 3.3% of Dunedin’s electricity was
supplied by PowerNet, which mainly includes the rural areas within the city boundary
and is served by the Halfway Bush and Naseby grid exit points.
pg. 22Dunedin Energy Study 2016/2017
Biomass
There are three main categories of wood that are used in Dunedin: wood pellets,
woodchips and firewood. These three wood fuels are used in different ways with
woodchips primarily being used for industrial boilers, whereas wood pellets and logs
(i.e. firewood) are used in both boilers and residential heating.
Wood fuels have multiple retail outlets, as well as direct commercial contracts with
forestry owners and self-collection possibilities. The extremely varied nature in which
wood fuels enter, and are used, in Dunedin make them very difficult to quantify and
represent the largest uncertainty in this study.
Wood pellets
Wood pellet supply in Dunedin
Wood pellets are supplied from a variety of retailers and industrial suppliers around the
city.
These pellets are imported into the city from manufacturers in Taupō (Nature’s Flame)
and Nelson (AzWood) as well as smaller manufacturers from Timaru, Tapanui and
Invercargill.
Due to the distributed nature of wood pellet imports, it is difficult to determine the
exact quantity supplied to consumers within Dunedin. Personal communications with
several industry representatives however, suggests that annual residential pellet supply
is around 2,000 tonnes (0.034 PJ), and annual industrial pellet supply is around 12,000
tonnes (0.206 PJ).
Dunedin was supplied with approximately 0.240 PJ of wood pellets during the 2017FY.
Wood pellet demand in Dunedin
Wood pellet boilers in Dunedin
There are six known wood pellet boilers used at educational facilities within the city.
These all have a rating of between 400 kW and 1460 kW. Personal communications with
several schools suggested that within the 2018FY at least two schools will be installing
new pellet boilers for space heating.
Information was compiled from personal communications, the EECA boiler list and data
provided by Ahika and BANZ to establish a database of commercial boilers in Dunedin.
This database was used to estimate the total installed capacity and fuel demand for
different boiler fuel types within Dunedin. Wood pellet boilers consumed
approximately 0.041 PJ of wood pellets in the 2017 FY.
pg. 23Dunedin Energy Study 2016/2017
Otago University is currently undergoing a move towards more sustainable fuels,
including the use of wood pellets. During the 2017FY, it consumed 0.002 PJ of wood
pellets.
Overall there was 0.043 PJ of wood pellets used in organisational boilers within the
city during the 2017FY.
Residential wood pellet demand
There are two main installers of pellet fires in Dunedin; Otago Pellet Fires and The
Dunedin Fireplace. Comprehensive pellet fire data was not available from all installers,
but at least 220 new pellet fires were installed during 2017 which brings the total
number of recorded pellet fires in Dunedin up to 1633.
It is estimated that 0.0343 PJ of wood pellets were used by Dunedin residents during
the 2017FY.
8.0%
7.0%
6.0%
5.0%
4.0%
3.0%
2.0%
1.0%
0.0%
Outram
Andersons Bay
Brockville-Glenross
Ravensbourne
Mornington
St Leonards
North East Valley-Normanby
Waikouaiti
North Dunedin
Green Island
Wakari
Concord-Burnside
Port Chalmers-CareysBay
Brighton
Waldronville
Mosgiel
Broad Bay-Portobello
Opoho
St Clair
Helensburgh
St Kilda
Roslyn-Belleknowes
Abbotsford
Fairfield
Waitati
Sawyers Bay-Roseneath
Pine Hill
South Dunedin
Glenleith-Woodhaugh
Kaikorai-Kenmure-Bradford
Halfway Bush
Maori Hill-Highgate
Macandrew Bay
Musselburgh
East Taieri
Waverley-Shiel Hill
Caversham-Lookout Point-Calton Hill
Figure 14: Proportion of households with pellet fires by suburb in 2017.
Figure 14 shows the percentage of households in each Dunedin suburb that have pellet
fires installed.
A total of 0.077 PJ of wood pellets were consumed in Dunedin during the 2017FY.
pg. 24Dunedin Energy Study 2016/2017
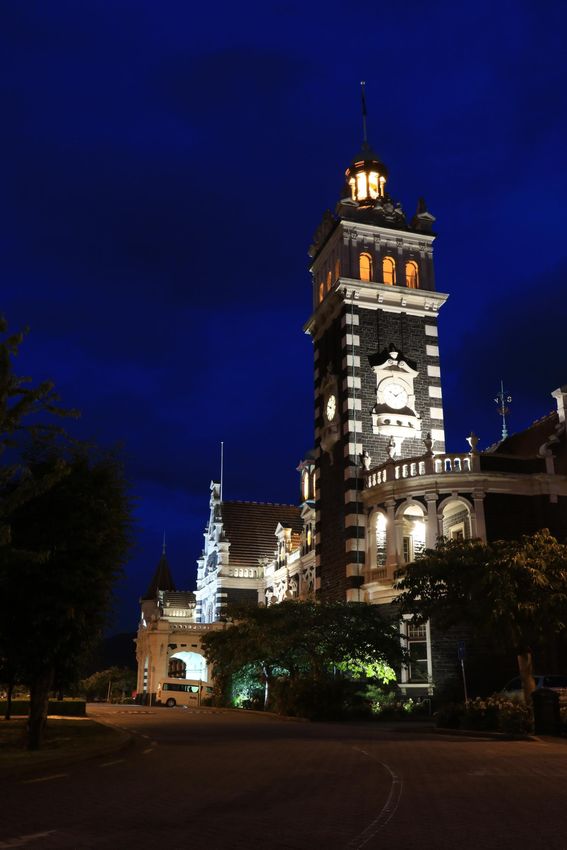
Woodchips
Woodchip supply in Dunedin
Wenita and City Forests are the two main forestry owners and suppliers of wood fuels
in the Dunedin area (Figure 15). These two firms provide logs for firewood and
woodchips to wholesalers or directly to customers. Wholesalers may sell these wood
products directly or pass them on to one of the many retailers of firewood in Dunedin.
A 50/50 split was assumed between woodchips and firewood if more accurate records
were not available.
Figure 15: Major forest land owners in Coastal Otago.
There were approximately 1.431 PJ of woodchips supplied to Dunedin during the
2017FY.
Woodchip demand in Dunedin
Organisational demand
Several data sources were used to calculate the woodchip energy consumed in
organisational boilers within Dunedin. Where available, direct energy consumption
data was used to improve the accuracy of this study. Data was also derived from the
EECA boiler list, Ahika and BANZ, which identified 11 other boilers in Dunedin that use
woodchips as their primary fuel type. During the 2017FY it is estimated that 0.799 PJ of
woodchips were consumed in these boilers.
pg. 25Dunedin Energy Study 2016/2017
The University of Otago and the Southern District Health Board also use woodchips in a
number of their own boilers. During the 2017FY, the university and affiliated residential
colleges consumed 0.021 PJ of woodchips and the hospitals consumed 0.014 PJ of
woodchips.
Overall, 0.834 PJ of woodchips were consumed in organisational boilers within
Dunedin during the 2017FY.
Oat husks
Oat husk demand in Dunedin
Combined data from the EECA boiler list, Ahika and BANZ, has identified two boilers
that use oat husks as a fuel source. These boilers are located at Harraway & Sons Ltd
and are fuelled by the waste husks from their own processing line.
During the 2017FY, it is estimated that 0.043 PJ of oat husks were consumed in these
two boilers.
Firewood
Firewood supply in Dunedin
Commercial firewood supplies are largely met by the two local forestry companies,
Wenita and City Forests (Figure 15). These two firms provide logs for firewood to several
of the main retailers in Dunedin.
In the 2017FY there was 2.91 PJ of logs sold for firewood by forestry owners in
Dunedin.
Residential firewood demand
A linear regression of census data from 2001, 2006 and 2013 was used to predict that
approximately 21,409 Dunedin households used wood as a heating fuel in the 2017FY.
Firewood can either be purchased or obtained from private sources. Data on self-
collected firewood is harder to obtain as it is not recorded anywhere. A survey that the
Ministry for the Environment20 carried out in 2005 concluded that over 60% of wood
used in solid fuel burners and 40% of wood used in multi-fuel burners was self-collected.
20Source: Ministry for Environment, 2005. Warm Homes Technical Report: Home Heating Methods and Fuels in
New Zealand.
pg. 26Dunedin Energy Study 2016/2017
Previous studies either did not include any self-collected firewood, or used survey
results to estimate firewood sources and quantities.
In 2016, a ‘People’s Panel’ survey was created through the DCC and collected data from
349 Dunedin residents. The results showed that of those who used firewood 21, 58%
obtained it through non-retail channels and 42% bought it from a retailer. The results
of this survey correlate well with the 2005 findings from the Ministry for the
Environment.
The People’s Panel survey showed that on average, each household that used firewood
would consume 7.17 cubic metres per year. This includes households that only use
firewood for heating and those that use firewood and other fuels for heating purposes.
It is estimated that Dunedin residents consumed 1.394 PJ (153,500 m3) of firewood in
the 2017FY.
There is a large disparity between the calculated demand and supply of wood fuels for
the local Dunedin market. The oversupply of wood pellets, chips and logs suggests that
not all of the local demand has been accounted for in our models. The reason for this
discrepancy is currently uncertain and requires further investigation.
21 221 out of the 349 respondents to the Peoples Panel survey used firewood in 2016.
pg. 27Dunedin Energy Study 2016/2017
Total wood fuels
Organisational Residential
0.000 0.500 1.000 1.500 2.000 2.500
Figure 16: Comparison of organisational and residential wood fuel demand in Dunedin
during the 2017FY.
Figure 16 shows the ratio of organisational wood fuel use to residential wood fuel use
in Dunedin. During the 2017FY, 39% of wood fuels were used by large organisational
boilers and 61% of wood fuels were used by residential households.
Wood pellets
Woodchips Firewood Oat Husks
0.000 0.500 1.000 1.500 2.000 2.500
Figure 17: Wood fuel use by type during the 2017FY in Dunedin.
Figure 17 shows the breakdown of wood fuel use by type in Dunedin. During the
2017FY, 59% of wood fuels were firewood, 35% were woodchips, 3% were wood pellets
and the remaining 2% were oat husks used by a local food processor.
pg. 28Dunedin Energy Study 2016/2017
Coal
Coal supplies in Dunedin
There are no active coal mines in Dunedin. The closest mine is Kai Point Coal, which is
located near Kaitangata. Personal communications suggest that the majority of coal
supplied within the city is sourced from Kai Point Coal (Otago), Ohai Coal (Southland)
and New Vale Coal (Southland). Some coal may also have been sourced from West
Coast mines22.
Data could not be obtained for the amount of coal supplied to Dunedin-based
customers, so an approximation has been calculated based on coal demand within the
city.
Coal demand in Dunedin
Organisational demand
Data was sourced from the EECA boiler list, Ahika and BANZ to create a database of
known coal boilers within Dunedin. Exact coal consumption data was provided by
several organisations and subsequently these boilers were removed from the database
to improve accuracy and prevent double counting. 49 boilers were identified for which
no specific coal consumption data could be obtained. 41 of these boilers are used for
space heating of primary and secondary schools and it is estimated that they consumed
0.041 PJ of coal during the 2017FY. The remaining eight boilers were used for heating
rest homes, food processing and in the chemical industry. It was calculated that these
boilers consumed 0.183 PJ of coal during the 2017FY.
The Dunedin Energy Centre is the only district heating scheme in Dunedin and provides
steam for process and space heating to several organisations, including the University
of Otago, the Southern District Health Board and Cadbury. They burn a combination of
coal and woodchips to provide this heat to their consumers. In the 2017FY, the Dunedin
Energy Centre consumed 0.398 PJ of coal.
The University of Otago also uses coal at a number of its sites. During the 2017FY, the
University consumed 0.020 PJ of coal. No coal was consumed at any of the University-
affiliated residential colleges.
Approximately 0.641 PJ of coal was consumed in Dunedin boilers during the 2017FY.
22See https://www.nzpam.govt.nz/our-industry/nz-minerals/minerals-data/coal/operating-mines/ for a
description of all New Zealand coal mines.
pg. 29Dunedin Energy Study 2016/2017
Residential demand
A linear regression of census data from 2001, 2006 and 2013 was used to predict that
approximately 3,955 Dunedin households used coal as a heating fuel in 2017.
The People’s Panel survey indicated that households which use coal would consume an
average of 353 kg per year.
It is estimated that Dunedin residents consumed 0.034 PJ of coal in the 2017FY.
Total coal consumption in Dunedin is estimated to be 0.675 PJ for the 2017FY.
Residential
Organisational
0.0 0.1 0.2 0.3 0.4 0.5 0.6 0.7
Figure 18: Comparison of organisational and residential coal use in Dunedin during the
2017FY.
pg. 30Dunedin Energy Study 2016/2017
Sulphur
Ravensdown Fertiliser Co-operative Limited combusts elemental sulphur in the boiler
at its plant in Ravensbourne. The combustion products are processed into acid for use
in the manufacturing of fertiliser at this plant.
The combustion of sulphur produces heat and steam as co-products which are used for
electricity generation and industrial heat. Ravensdown Ltd generated 566 MWh of
electricity in the 2017FY. This electricity is included in the electricity section of this
report.
Based on previous studies, it is estimated that around 0.202 PJ of sulphur would have
been consumed by Ravensdown Ltd during the 2017FY.
pg. 31Dunedin Energy Study 2016/2017
Greenhouse Gas Emissions
Emissions factors were used to determine the greenhouse gas (GHG) emissions in terms
of the energy use (kg CO2-e/unit), as follows:
• Petrol (litre): 2.36
• Diesel (litre): 2.72
• LPG (kg): 3.03
• Electricity (kWh): 0.0918
• Wood (kg): 0.0795
• Coal – sub-bituminous (kg): 2.15
These conversions are consistent with previous Dunedin Energy Studies23 except for the
electricity emissions factor which changes depending on the generation method.
An electricity emissions factor (including distribution losses) for the 2017FY was
calculated based on Ministry of Business, Innovation and Employment (MBIE)
datasets24. Emissions from geothermal electricity generation are considered as fugitive
emissions according to the Intergovernmental Panel on Climate Change (IPCC)
guidelines, so are not included in 'Public Electricity and Heat Production' emissions in
international reporting.
The conversion of sulphur to sulphuric acid at Ravensdown Ltd’s Dunedin factory does
not produce any carbon dioxide emissions, although fluoride and sulphur dioxide
emissions are released during this process. The exact quantities of these are unknown
and are subsequently not included in the following greenhouse gas inventory for the
city. Further research is required in this area.
23
Emissions factors were based on those supplied in the Ministry for the Environment’s Summary of Emissions
Factors for the Guidance for Voluntary Corporate Greenhouse Gas Reporting - 2015
24
Electricity emissions factors calculated from MBIE datasets: http://www.mbie.govt.nz/info-services/sectors-
industries/energy/energy-data-modelling/statistics/greenhouse-gas-emissions
pg. 32Dunedin Energy Study 2016/2017
Table 2: CO2-equivalent emissions from energy use in Dunedin during the 2017FY
Total energy Share of Share of energy
Fuel Total CO2-e (kt)
(PJ) emissions inputs
Petrol 2.653 178.45 28% 20%
Diesel 3.891 275.24 43% 29%
LPG 0.596 36.45 6% 4%
Electricity 3.152 80.38 13% 23%
Wood 2.349 11.15 2% 17%
Coal 0.675 59.74 9% 5%
A total of 641.4 kt of CO2-equivalent were emitted from Dunedin-based energy
consumption during the 2017FY.
pg. 33Dunedin Energy Study 2016/2017
National Comparisons
Comparisons were made with two national datasets: the energy balance tables
produced by MBIE 25 , and the energy end use database produced by EECA 26 . These
datasets have been converted to a per capita basis, based on 2013 census results for
the relevant area’s population.
Energy Balance Tables
This study is compared with national data for the 2016 calendar year. The compared
periods are six months out of alignment but this was the most recent data available and
should provide a close approximation. This comparison is displayed in Table 3.
It should be noted that the national figures cover a much more varied set of activities
than occur in Dunedin. For this reason, not all fuels are available and used in the same
way in Dunedin as they may be in the rest of New Zealand. Specific examples are noted
below.
Table 3: Comparison of per capita energy use of Dunedin residents in the 2017FY to
national averages from 2016.
Dunedin Energy Study National Energy Balance Dunedin Proportion of
Fuel
(MJ/person) (MJ/person) National Average
Petrol 22,060 26,507 83%
Diesel 32,357 29,664 109%
LPG 4,953 1,983 250%
LPG + NG 4,953 21,275 23%
Electricity 26,214 33,074 79%
Wood 19,531 12,639 155%
Coal 5,616 6,289 89%
Dunedin uses 17% less petrol and 9% more diesel than the national per capita average.
LPG usage is much more prevalent in the South Island due to the reticulated natural gas
network servicing a large proportion of the North Island. No natural gas is distributed
in the South Island. This helps explain why Dunedin consumes 2.5 times more LPG than
the national average, which is widely used for cooking and water/space heating. If
natural gas (NG) is included in the national figures, Dunedin uses 77% less gas than the
25
Source: http://www.mbie.govt.nz/info-services/sectors-industries/energy/energy-data-
modelling/publications/energy-in-new-zealand
26 Source: https://www.eeca.govt.nz/resources-and-tools/tools/energy-end-use-database/
pg. 34Dunedin Energy Study 2016/2017
national average. Natural gas is widely used for large scale industrial processes such as
electricity generation and milk drying, none of which occur on Dunedin’s LPG network.
Dunedin consumes 21% less electricity and 55% more wood energy than the national
average. Dunedin has very good access to wood fuels compared to many other New
Zealand centres. It is possible that the greater wood consumption may be offsetting
some of the electrical load used for space heating in other regions.
Dunedin uses 11% less coal than the national average. Nationally, coal is largely used
for industrial processes such as steel manufacturing, electricity generation and milk
drying; in Dunedin the largest use is for district heat. The difference in end use does not
greatly affect the per capita consumption when comparing Dunedin to the rest of New
Zealand.
Energy End Use Database
EECA’s energy end use database provides estimates of the energy used in various New
Zealand regions. The most recent version of this database for Otago is from 2012. This
is compared to the findings from the current study in Table 4.
Table 4: Comparison of per capita energy use of Dunedin residents in the 2017FY to
Otago wide averages from 2012.
Dunedin Energy Study 2012 Otago End Use Dunedin Proportion of
Fuel
(MJ/person) Energy (MJ/person) Otago Average
Petrol 22,060 31,382 70%
Diesel 32,357 28,365 114%
LPG 4,953 7,452 66%
Electricity 26,214 23,910 110%
Wood 19,531 7,638 256%
Coal 5,616 5,422 104%
Table 4 suggests:
• Dunedin uses 30% less petrol and 34% less LPG than the regional average.
• Dunedin uses 14% more diesel and 10% more electricity than the regional average.
• Dunedin’s coal use is similar (+4%) to the regional average.
• Dunedin uses 2.5 times more wood than the regional average. Wood fuels represent
the largest area of uncertainty in this study and requires further investigation.
pg. 35Dunedin Energy Study 2016/2017
Greenhouse gas emissions
The EECA energy end use database also provides estimates of GHG emissions associated
with reported energy use. The most recent version of this database at the national level
is from 2015. This is compared to the findings from the current study on a per capita
basis in Table 5.
Table 5: Comparison of per capita energy emissions of Dunedin residents in the 2017FY
to national averages from 2015.
Dunedin Energy Study National End Use Emissions Dunedin Proportion
Fuel
(t CO2-e/person) (t CO2-e/person) of NZ Average
Petrol 1.484 1.796 83%
Diesel 2.289 2.045 112%
LPG 0.303 0.112 269%
LPG + NG 0.303 1.116 27%
Electricity 0.668 1.191 56%
Wood 0.093 0.022 430%
Coal 0.497 0.572 87%
The per capita emissions are in proportion to the amount of each of the different types
used in Dunedin and nationally. This is shown in Table 3 and explained thereafter. The
major difference between the Dunedin proportion of energy use vs. emissions is for
wood energy. The main reason for this discrepancy is the use of different emissions
factors between datasets. The origin of the emissions factor used in the EECA database
could not be determined and requires further investigation.
pg. 36Dunedin Energy Study 2016/2017
Conclusions
This study has attempted to gather data on all energy inputs into Dunedin. This has
been used to provide a snapshot of energy use in the city and to investigate any
potential trends by comparing to previous Dunedin Energy Studies.
During the 2017 financial year (1st July 2016 to 30th June 2017) a total of 13.52 PJ of
energy was used within Dunedin. 49% of this energy was from petrol and diesel, 4%
from LPG, 23% from electricity, 17% from biomass, 5% from coal and 1% from sulphur.
These proportions are similar to previous studies, but show a small reduction in petrol
and diesel use, and an increase in LPG and biomass consumption.
Some of the data collection and analysis methods have been improved from previous
studies, so it is not always possible to draw direct conclusions about long term trends
for all fuel types. These are specified in the relevant sections, and where applicable,
previous data was updated to represent the new methodologies.
The developments and limitations of this study are summarised below, along with the
implications.
Developments and Limitations
Based on the insights gained through this study, several data collection methodologies
were refined to improve the accuracy of this report. These are summarised below:
• Increased participation from local businesses has improved the accuracy of wood and
coal consumption data.
• Combining and updating data from personal communications, Ahika, the Bioenergy
Association of New Zealand and the Energy Efficiency and Conservation Authority has
improved the known database of Dunedin-based boilers and their fuel types.
• The Kaikōura earthquake temporarily prevented the rail shipments of LPG and forced
all LPG to be supplied by ship. Assuming this event did not affect demand, the available
maritime data allowed the creation of a model to more accurately estimate the amount
of LPG supplied.
pg. 37You can also read