Oracle Hospitality Reporting and Analytics - User Guide - Release 9.0 - Oracle Help Center
←
→
Page content transcription
If your browser does not render page correctly, please read the page content below
Oracle® Hospitality Reporting and
Analytics
User Guide

   Release 9.0
   E72023-06
   March 2020
Oracle Hospitality Reporting and Analytics User Guide, Release 9.0

E72023-06

Copyright © 2000, 2020, Oracle and/or its affiliates. All rights reserved.

This software and related documentation are provided under a license agreement containing restrictions on
use and disclosure and are protected by intellectual property laws. Except as expressly permitted in your
license agreement or allowed by law, you may not use, copy, reproduce, translate, broadcast, modify,
license, transmit, distribute, exhibit, perform, publish, or display any part, in any form, or by any means.
Reverse engineering, disassembly, or decompilation of this software, unless required by law for
interoperability, is prohibited.

The information contained herein is subject to change without notice and is not warranted to be error-free. If
you find any errors, please report them to us in writing.

If this is software or related documentation that is delivered to the U.S. Government or anyone licensing it on
behalf of the U.S. Government, then the following notice is applicable:

U.S. GOVERNMENT END USERS: Oracle programs, including any operating system, integrated software,
any programs installed on the hardware, and/or documentation, delivered to U.S. Government end users are
"commercial computer software" pursuant to the applicable Federal Acquisition Regulation and agency-
specific supplemental regulations. As such, use, duplication, disclosure, modification, and adaptation of the
programs, including any operating system, integrated software, any programs installed on the hardware,
and/or documentation, shall be subject to license terms and license restrictions applicable to the programs.
No other rights are granted to the U.S. Government.

This software or hardware is developed for general use in a variety of information management applications.
It is not developed or intended for use in any inherently dangerous applications, including applications that
may create a risk of personal injury. If you use this software or hardware in dangerous applications, then you
shall be responsible to take all appropriate fail-safe, backup, redundancy, and other measures to ensure its
safe use. Oracle Corporation and its affiliates disclaim any liability for any damages caused by use of this
software or hardware in dangerous applications.

Oracle and Java are registered trademarks of Oracle and/or its affiliates. Other names may be trademarks of
their respective owners.

Intel and Intel Xeon are trademarks or registered trademarks of Intel Corporation. All SPARC trademarks are
used under license and are trademarks or registered trademarks of SPARC International, Inc. AMD, Opteron,
the AMD logo, and the AMD Opteron logo are trademarks or registered trademarks of Advanced Micro
Devices. UNIX is a registered trademark of The Open Group.

This software or hardware and documentation may provide access to or information about content, products,
and services from third parties. Oracle Corporation and its affiliates are not responsible for and expressly
disclaim all warranties of any kind with respect to third-party content, products, and services unless otherwise
set forth in an applicable agreement between you and Oracle. Oracle Corporation and its affiliates will not be
responsible for any loss, costs, or damages incurred due to your access to or use of third-party content,
products, or services, except as set forth in an applicable agreement between you and Oracle.
Contents
    Preface

1   Using Reporting and Analytics
    Using Reporting and Analytics                        1-1
    Choosing a Report Type                               1-1
    Choosing a Dashboard                                 1-2
    Configuration Guidelines                             1-4
    Maintaining Organizations                            1-4
    Maintaining Users and Roles                          1-5
    Maintaining Point-of-Sale Data                       1-5
    Re-Aggregating Data                                  1-6

2   Analysis Reports
    Analysis Report Examples                             2-3
    Report Walkthrough: Revenue and Cost Comparisons     2-6
    Running, Printing, and Exporting Analysis Reports    2-9
    Creating Analysis Reports                           2-10
    Managing Analysis Reports                           2-11
    Analysis Report Permissions                         2-12
    File Permissions and Publishing                     2-12
    Configuring Analysis Report Permissions             2-13
    Publishing an Analysis Report                       2-13
    Analysis Report Date Session Variables              2-14

3   Core Reports
    Running Reports                                      3-1
    Modifying Reports                                    3-1
    Exporting Reports                                    3-3

                                                          iii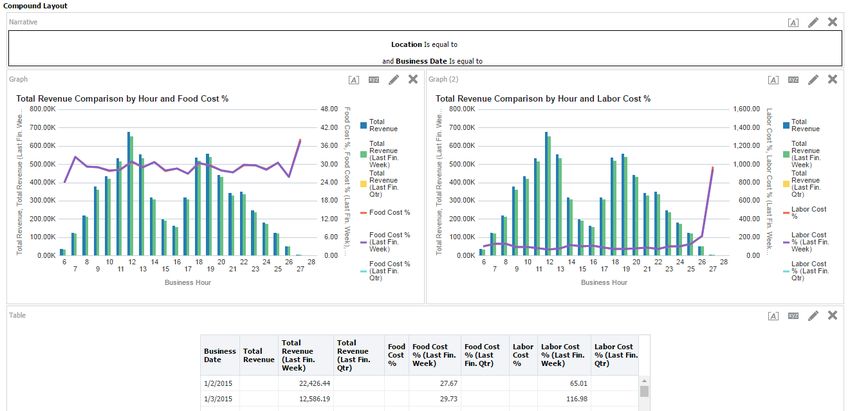
4    Custom Reports in Microsoft Excel
     Installing iQuery                                           4-1
     Building a Custom Report in Microsoft Excel                 4-1

5    Scheduled Reports
     Scheduling Reports for Email Distribution                   5-1

6    Guest Check Information
     Retrieving Information with Check Query                     6-1
     Retrieving Transaction Information with Audit & Analysis    6-2
     Exporting Audit & Analysis Queries                          6-3

7    Manager Communication
     Configuring Manager Log Entry Categories                    7-1
     Working with the Manager Log                                7-1
     Searching the Manager Log                                   7-2
     Adding an Entry to the Manager Log                          7-2
     Updating and Closing an Entry                               7-2
     Adding a Note to the Manager Log                            7-3

8    User Settings
     myPage                                                      8-1
     Configuring myPage Content                                  8-1
     Configuring User Preferences                                8-2

9    Organizational Hierarchies
     Revenue Centers                                             9-2
     Adding Levels                                               9-2
     Adding Locations                                            9-2
     Establishing Relationships Between Levels and Locations     9-3

10   Users and Roles
     Creating Roles                                             10-1
     Adding Users                                               10-2

                                                                  iv
11 End User Access to Content
Creating Portlets 11-1
Assigning Portlets to Roles 11-2
Assigning Side Menus to Roles 11-2
Assigning Reports to Roles 11-2
Outage Alerts 11-3
Setting Outage Alert Recipients 11-3
Installing Remote Transfer Agent (RTA) at a Location 11-3
12 Financial Calendars and Day Parts
Financial Calendars 12-1
Accounting Cycles 12-3
Last Week of the Financial Year 12-5
Creating a Financial Calendar 12-5
Creating a Financial Year with the Automated Wizard 12-6
Creating a Financial Year Manually 12-6
Creating Day Parts 12-7
Overriding Day Parts 12-7
13 Currency and Exchange Rate
Enabling Currency Configuration and Setting the Common Currency 13-1
Adding a Currency Type 13-1
Adding and Updating Exchange Rates 13-2
14 Reason Codes
Creating Reason Codes 14-1
15 Reporting Hierarchies
Creating Reporting Hierarchies 15-1
16 Item Alignment
Master Groups and Master Stores 16-1
Alignment Rules 16-2
Configuring a Master Group 16-3
Assigning a Location as a Master Store 16-3
Assigning Locations to the Master Group 16-4
vCreating Alignment Rules 16-4
Manually Aligning Items 16-5
17 Category Groups
Creating Category Groups 17-1
Creating Category Group Hierarchies 17-1
18 Cost Tiers
Creating Cost Tiers 18-1
Assigning Menu Items to Cost Tiers 18-1
19 Legacy Reports
Converting Interactive Reports to Analysis Reports 19-1
Converting Ad Hoc Reports to Analysis Reports 19-2
20 Standard Export
viPreface
Oracle Hospitality Reporting and Analytics is a web-based application that centralizes
point-of-sale (POS) data to provide operational and analytical insights into business
operations, and to improve efficiency by delivering information to all roles within an
organization.
Purpose
This document is intended for customers subscribed to Oracle Hospitality Reporting
and Analytics Advanced Cloud Services. Customers using Standard Cloud Services
and On-Premise deployments may not have access to all features described in the
documentation. Your organization type can affect visibility and access to features
within Reporting and Analytics.
The navigation instructions throughout the documentation may not accurately depict
the menu layout for your Oracle Hospitality Enterprise Back Office deployment
because administrators can customize the name and organization of the groups and
links in the sidebar menu. Use the navigation instructions provided as a guideline for
locating the links in your deployment, or contact an administrator for assistance.
Audience
Oracle Hospitality Enterprise Back Office documentation applies to the following users:
• Users who perform day-to-day operations with Enterprise Back Office and who
typically do not have permissions to configure applications.
• Administrators who configure and maintain Enterprise Back Office. Administrators
can also have permissions to configure applications.
• System Administrators or Super Administrators who maintain Enterprise Back
Office servers and configuration files, implement initial application settings and
configurations, and maintain back-end processes such as automated jobs and
data interfaces with third-party applications.
Customer Support
To contact Oracle Customer Support, access My Oracle Support at the following URL:
https://support.oracle.com
When contacting Customer Support, please provide the following:
• Product version and program/module name
• Functional and technical description of the problem (include business impact)
• Detailed step-by-step instructions to re-create
• Exact error message received
• Screen shots of each step you take
viiPreface
Documentation
Oracle Hospitality product documentation is available on the Oracle Help Center at
http://docs.oracle.com/en/industries/hospitality/.
Revision History
Table 1 Revision History
Date Description of Change
March 2017 Initial Publication
April 2017 Removed extraneous topics related to legacy
reports.
September 2017 Corrected missing text in the Analysis Reports
topic.
March 2018 Removed the Standard Export chapter and
replaced with reference to the Standard Export
User Guide that can be found in the Enterprise
Back Office 9.0 library.
May 2018 Correction to the functionality listed for
Analysis Reports.
March 2020 Updated Exporting Reports
viii1
Using Reporting and Analytics
Oracle Hospitality Reporting and Analytics is a web-based application that centralizes
point-of-sale (POS) data to provide operational and analytical insights into business
operations, and to improve efficiency by delivering information to all roles within an
organization.
• Using Reporting and Analytics
• Choosing a Report Type
• Choosing a Dashboard
• Configuration Guidelines
• Maintaining Organizations
• Maintaining Users and Roles
• Maintaining Point-of-Sale Data
• Re-Aggregating Data
Using Reporting and Analytics
Users can perform the following non-administrative tasks to retrieve data or to
personalize Reporting and Analytics:
Table 1-1 Using Reporting and Analytics
I Want To Go To
Build or run reports that consolidate and apply Choosing a Report Type
business analytics to Point-of-Sale data.
View dashboards containing pre-constructed Choosing a Dashboard
reports and data visualizations.
Search for details for specific guest checks. Guest Check Information
Read and post comments and status updates Manager Communication
between managers.
View and configure a personal dashboard myPage
containing reports, visualizations, and widgets.
Configure regional settings and personalize User Settings
filter and login defaults.
Choosing a Report Type
Point-of-Sale (POS) applications post data to the Enterprise Back Office database,
and Reporting and Analytics applies business intelligence and analytics to the data to
produce visualizations and reports for analysis and interpretation.
1-1Chapter 1
Choosing a Dashboard
The reports generated by Reporting and Analytics include child reports, or drill-down
reports, which inherit scope and properties from the parent report to display more
extensive and detailed information about the user selection. For example, if you are
looking at a sales report that includes a breakdown of sales by menu item, you can
select a menu item to view a drill-down report containing sales, tax, and service
charge details specific to the selected menu item.
Reporting and Analytics allows you to leverage the following types of reports:
Table 1-2 Report Types
I Want To Go To
Reports that can be customized based on Analysis Reports
specific sets of data from operations subject
areas and with applied business intelligence.
Pre-defined reports that show information Core Reports
targeting specific business operations.
Reports that can be customized with selected Custom Reports in Microsoft Excel
subjects and columns using a Microsoft Excel
plug-in.
Related Topics
• Using Reporting and Analytics
Choosing a Dashboard
Reporting and Analytics dashboards provide a collection of data and visualizations
designed to give you an overview of information on one screen and to allow you to drill
down for more detailed information. Some dashboards show different information
depending on whether your location or organization is set to Table Service
Restaurants (TSR) or Quick Service Restaurants (QSR).
You can add and view the following dashboards:
1-2Chapter 1
Choosing a Dashboard
Table 1-3 Dashboards
Dashboard Description
Operations The top level of the dashboard shows the daily total sales, the
daily transaction count and average, the daily cost of
operations, and the daily adjustments relative to the same day
averages for the previous 8 weeks.
If your location is set as a TSR, the top dashboard shows the
following charts:
• # of Checks and Avg Check
• # Guests & Spend Per Guest (SPG)
And the dashboard drills down to show the following charts:
• Average Check, Number of Checks & Net Sales By
Location
• Net Sales And Average Check By Day Part
• Top 5 Locations By Average Check
If your location is set as a QSR, the top dashboard shows the
following charts:
• # of Trans and Avg Trans
• Sales Per Labor Hour (SPLH)
And the dashboard drills down to show the following charts:
• Average Transaction, Number of Transactions & Net
Sales By Location
• Net Sales And Average Check By Day Part
• Top 5 Locations By Transaction Count
You can filter the dashboard by business date, location,
revenue center, order type, and day part.
If your organization or location uses value-added taxes (VAT),
the top level of the dashboard include the VAT in Net Sales
values, but drill-down charts do not include the VAT.
Sales and Costs The top level of the dashboard shows the daily revenue and
cost, the daily labor and hourly sales, and the daily cost of
goods sold by major group.
You can filter the dashboard by business date, location,
revenue center, order type, and day part.
Service Performance The top level of the dashboard shows the adjustments by hour,
the average check by day part, the sales by order type and
day part, the top and bottom five locations for service
performance, and the top and bottom five employees for
average check.
• TSR: Shows Guest Count by Day Part and Average
Check by Day Part.
• QSR: Shows Average Trans by Day Part and
Adjustment By Hour.
You can filter the dashboard by business date, location,
revenue center, order type, and day part.
Labor The top level of the dashboard shows the weekly labor costs
by job code, and the labor and sales totals by quarter hour.
You can filter the dashboard by business date, location,
revenue center, and day part.
1-3Chapter 1
Configuration Guidelines
Table 1-3 (Cont.) Dashboards
Dashboard Description
Inventory The top level of the dashboard shows the weekly top 20
receiving vendors, the weekly cost sales analysis by major
groups, the comparison of cost by item group, and the top
variance by cost center.
You can filter the dashboard by business date, location, and
cost center.
Note:
Oracle Fusion Middleware Oracle Business Intelligence online Help opens if
you access online Help when creating or editing analysis reports or when
working with dashboards. The Oracle Business Intelligence online Help may
describe functionality not available in Reporting and Analytics.
Related Topics
• Using Reporting and Analytics
Configuration Guidelines
To optimize performance, ensure the quality and accuracy of reports, and maximize
usage of Enterprise Back Office features, make sure that:
• Organization hierarchy is implemented for all locations.
• Financial calendars contain at least three years, and that there are no gaps or
overlaps in dates.
• Day parts cover all 24 hours of each day for all 7 days in a week.
• Master Groups, Master Items, and Master Store are defined to accommodate
menu item linking.
• Maintenance plan is implemented to periodically review and manually correct item
alignment.
• Regional settings such as currency and exchange rates are implemented and
maintained when applicable.
To ensure optimized performance, the Enterprise Back Office web application prompts
authorized users for permission to perform database aggregation, or cleanup, after
changes to certain configurations, such as financial calendar and currency.
Maintaining Organizations
Administrators can configure and maintain levels, locations, and revenue centers in
the Reporting and Analytics organization. Administrators can also configure and
assign financial calendars, day parts, currency, exchange rates, and reason codes for
the whole organization or for each level or location.
1-4Chapter 1
Maintaining Users and Roles
Table 1-4 Managing Organizations
I Want To Go To
Configure the organizational hierarchy by Organizational Hierarchies
maintaining the levels, locations, and revenue
centers in the organization and by modifying
the relationships between levels and locations.
Configure and assign calendar configurations Financial Calendars
and financial calendars.
Configure and assign work day partitions. Financial Calendars and Day Parts
Assign the default and available currency used Currency and Exchange Rate
by the organization and by specific locations.
Configure and assign a list of default reasons Reason Codes
for performing operations such as returns and
voids.
Maintaining Users and Roles
Administrators can create user accounts, create and assign roles, and configure
access and permissions for each role.
Table 1-5 Managing Users and Roles
I Want To Go To
Create and maintain user accounts. Users and Roles
Create and maintain user groups. Users and Roles
Manage content and report permissions for End User Access to Content
user groups.
Maintaining Point-of-Sale Data
Administrators can configure how Oracle Hospitality Reporting and Analytics stores
and maintains data posted by Point-of-Sale applications. The following configurations
allow administrators to set the scope and specificity of reports and business analysis
operations for locations, revenue centers, roles, and so on:
Table 1-6 Managing Point-of-Sale Data
I Want To Go To
Create groups of locations for collecting and Reporting Hierarchies
assembling report totals.
Create and define the master entries under Item Alignment
which all of the same items post and calculate.
Create and define item groupings to control Category Groups
the scope of reports.
Create and assign item sets that are typically Cost Tiers
associated with vendors or sources.
1-5Chapter 1
Re-Aggregating Data
Table 1-6 (Cont.) Managing Point-of-Sale Data
I Want To Go To
Re-aggregate after re-posting data for one or Re-Aggregating Data
more days at a specific location.
Re-Aggregating Data
You can configure a re-aggregation job for specific dates at a single location.
1. Log in to Reporting and Analytics using the M organization and system
administrator credentials.
2. Click System, click OBI Re-aggregation, and then click OBI Re-aggregation.
3. Select your organization, select a location, add or remove dates for re-
aggregation, and then click Save.
1-62
Analysis Reports
Analysis Reports allow you to design and maintain reports and visualizations of data
posted to Enterprise Back Office. Analysis reports are comprised of:
Table 2-1 Analysis Report Components
Analysis Report Component Example
Subject areas represent an The Operations subject area
area of business data that end contains data for operations
users can view in the analysis totals and counts, such as
report, and consist of folders, sales, guests, labor cost, cost
measure columns, attribute of goods, and checks.
columns, hierarchical
columns, and hierarchy levels.
Folders provide a named The Operations subject area
grouping of columns. contains six folders for
attribute columns and one
folder for measure columns,
with a clear name for the
folder containing measure
columns.
Attribute columns hold a flat The Business Date folder
list of values with no contains attribute columns
hierarchical relationships, and such as financial period and
provide scope and constraints calendar month.
to the data presented by a
report. The folders containing
attribute columns unique to
the selected subject area
typically contain
Definitions in their
names.
Hierarchical columns hold The Business Date folder
data values that are organized contains the Calendar Year
using named levels and Hierarchy column, which can
parent-child relationships. drill down into the All Years,
Hierarchical columns allow Calendar Year, Calendar
users to drill down into the Month, and Business Date
data, and their folder name Detail columns.
typically contains
Hierarchy.
2-1Chapter 2
Table 2-1 (Cont.) Analysis Report Components
Analysis Report Component Example
Measure columns hold a list of The Operations subject area
data values that typically contains the Operations
reside in the Business Measures folder, which
Intelligence repository as a contains measure columns
fact table, which can change such as Net Sales, Sales
or be added or aggregated. Count, and Number of
The folders containing Checks.
measure columns typically
contain Measures in their
names.
You can select the operational subject area, or business model, that applies to the
report or visualization you want to view or create, and then you can apply business
analytics by:
• Selecting specific data sets to use in the report, and then applying filters to each
data set.
• Selecting and configuring the resulting appearance of data, such as by rearranging
columns and rows in the table, inserting visualizations and charts, and changing
column labels.
• Adding and configuring user prompts to allow users viewing the report to configure
data filters as needed. For example, you can add a date selection prompt to allow
users to set the range of dates for which they need the report.
Oracle Fusion Middleware Oracle Business Intelligence online Help opens if you
access online Help when creating or editing analysis reports or when working with
dashboards. The Oracle Business Intelligence online Help may describe functionality
not available in Reporting and Analytics.
• Analysis Report Examples
• Report Walkthrough: Revenue and Cost Comparisons
• Running, Printing, and Exporting Analysis Reports
• Creating Analysis Reports
• Managing Analysis Reports
• Analysis Report Permissions
• File Permissions and Publishing
• Configuring Analysis Report Permissions
• Publishing an Analysis Report
• Analysis Report Date Session Variables
Related Topics
• Choosing a Report Type
Related Topics
• File Permissions and Publishing
2-2Chapter 2
Analysis Report Examples
Related Topics
• Scheduled Reports
Analysis Report Examples
The following analysis reports provide examples of how you can leverage and
implement analysis reports to solve business information needs.
Chief Operating Officer
The Chief Operating Officer wants to view a comparison of sales for three signature
hamburgers in different regions, and wants to view a comparison of sales at the district
and location levels. You can create a report that allows the user to drill down the
organizational levels, and to view yearly sales and revenue data that account for VAT
and discounts, as shown in the following image:
Figure 2-1 Example Sales Comparison Report
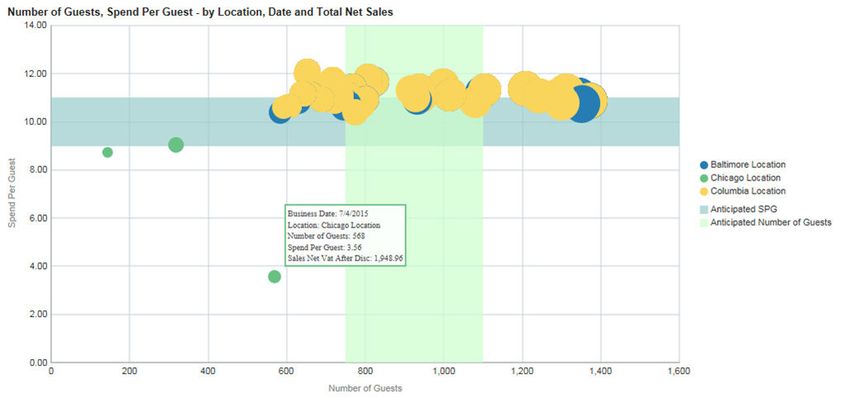
Store Manager
The Store Manager wants to identify the most and least profitable menu items, and to
identify positive and negative sales and cost outliers. You can create a report that
outputs a scatter plot graph to identify positive and negative data outliers. In the
following example, the scatter chart plots the sales and costs of individual menu items
to help you identify the items that sold well with low costs and items that sold poorly
with high costs. The scatter chart also allows you to mouse over data points to identify
specific menu items, as shown in the following image:
2-3Chapter 2
Analysis Report Examples
Figure 2-2 Example Scatter Chart Report for Data Outliers
Loss Prevention Manager
The Loss Prevention Manager wants to identify employees with increasing error
correction totals due to it being a potential sign of fraud. You can create a report that
lists the employees and shows a histogram of their total error corrections, discount
totals, and void totals per week for the previous nine weeks, as shown in the following
image:
2-4Chapter 2
Analysis Report Examples
Figure 2-3 Example Employee Histogram
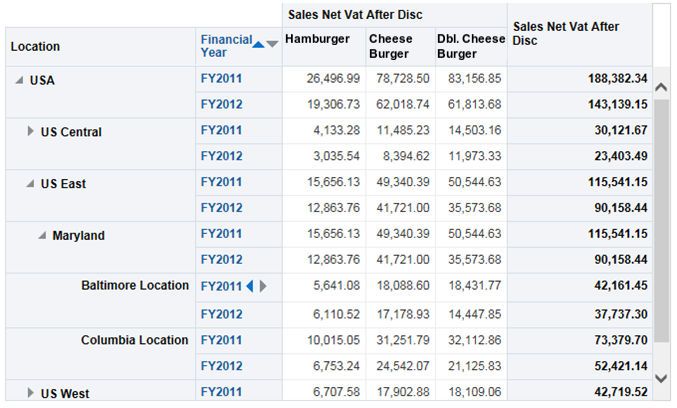
Business Analyst
The Business Analyst wants to determine which locations are most profitable with the
guests they attract, which locations are upselling, which locations could profit by
upselling more items, and which locations have trouble attracting customers. You can
create a report that shows a bubble graph to indicate the number of guests and the
amount spent per guest (SPG), along with scale markers (the blue and green areas) to
identify indicate a target range, as shown in the following image:
2-5Chapter 2
Report Walkthrough: Revenue and Cost Comparisons
Figure 2-4 Example Bubble Graph Report for Number of Guests and Amount
Spend Per Guest
Report Walkthrough: Revenue and Cost Comparisons
This topic provides an example walkthrough of how a store manager can design and
create an analysis report to address a business need.
Identify the Data Shown by the Report
A store manager wants a visualized comparison of revenue and costs between a
single day and a previous day. To determine the data to be shown by the report, the
store manager conceptualizes the information needs and decides that the report
should include:
• The total revenue at a location for each business hour.
• A historical comparison of total revenue for a selected day and a previous day.
• The percentage of revenue consumed by food costs, and the percentage of
revenue consumed by labor costs.
• A historical comparison of the percent of revenue consumed by the respective
costs.
Add Data Columns to the Report
On the Criteria tab, the store manager adds the following basic columns:
• Business Date/Business Date
• Fixed Period/Business Hour
• Operations Measures/Food Cost %
• Operations Measures/Labor Cost%
• Operations Measures/Total Revenue
To set specific previous day intervals, the store manager adds and customizes the
following columns:
2-6Chapter 2
Report Walkthrough: Revenue and Cost Comparisons
• Operations Measures/Food Cost % (Last Financial Week): AGO("Operations
Measures"."Food Cost %", "Business Date"."Financial Year
Hierarchy"."Financial Week",1)
• Operations Measures/Food Cost % (Last Financial Quarter): AGO("Operations
Measures"."Food Cost %", "Business Date"."Financial Year
Hierarchy"."Financial Quarter",1)
• Operations Measures/Labor Cost % (Last Financial Week): AGO("Operations
Measures"."Labor Cost %", "Business Date"."Financial Year
Hierarchy"."Financial Week",1)
• Operations Measures/Labor Cost % (Last Financial Quarter): AGO("Operations
Measures"."Labor Cost %", "Business Date"."Financial Year
Hierarchy"."Financial Quarter",1)
• Operations Measures/Total Revenue(Last Financial Week): AGO("Operations
Measures"."Total Revenue", "Business Date"."Financial Year
Hierarchy"."Financial Week",1)
• Operations Measures/Total Revenue (Last Financial Quarter):
AGO("Operations Measures"."Total Revenue", "Business
Date"."Financial Year Hierarchy"."Financial Quarter",1)
The following image shows an example of a customized column:
Figure 2-5 Total Revenue (Last Financial Quarter) Column Customization
Add Visualizations to the Report
On the Results tab, the store manager begins adding and configuring the report layout
and style. To set up a line-bar graph to show the Total Revenue Comparison by
Hour and Food Cost %, the store manager maps the data columns as shown in the
following image:
2-7Chapter 2
Report Walkthrough: Revenue and Cost Comparisons
Figure 2-6 Total Revenue Comparison by Hour and Food Cost % Graph
Customization
The store manager adds a similar line-bar graph to show Total Revenue Comparison
by Hour and Labor Cost %, and then adds a table to the bottom of the report for a
simple numeric display of the data.
The following image shows the report after the store manager adds the two
visualizations and table:
2-8Chapter 2
Running, Printing, and Exporting Analysis Reports
Figure 2-7 Sales Comparison Report
Running, Printing, and Exporting Analysis Reports
1. Make sure the report you want to run has been published. Reporting and Analytics
only shows reports for which you have access.
2. In the Reporting and Analytics side menu, click the link to go to the More Reports
page. If you cannot find the link, contact your system administrator.
3. Click Analysis Reports, and then click a published report.
2-9Chapter 2
Creating Analysis Reports
4. To run and view the analysis report, select or enter the report parameters, and
then click OK.
5. To clear the report parameters, click Reset.
6. To print the analysis report, click Print, and then select a printable format.
7. To export the analysis report, click Export, and then select a file or data format.
8. To add the analysis report to a collection of reports and dashboards, click Add to
Briefing Book. You can download the briefing book as a PDF or HTML.
Creating Analysis Reports
The Oracle Fusion Middleware User's Guide for Oracle Business Intelligence
Enterprise Edition contains information and instructions for using the analysis editor,
but also contains information for features and functionality not included in the
Reporting and Analytics implementation.
1. In the Reporting and Analytics side menu, click the link to go to the Analysis
Reports page. If you cannot find the link, contact your system administrator.
2. Click Create Analysis, and then click the subject area for which you want to
create the report.
3. Configure the report:
a. On the Criteria tab, drag and drop columns from the Subject Area pane to
the Selected Columns pane to add columns to the report and to configure
default sorting and filters.
b. On the Criteria tab, add, edit, and remove filters in the Filters pane. You must
keep the Business Date and Location filters to allow the report to publish and
to allow ReportMail to work with the report.
c. On the Results tab, preview the appearance and output of the report, and edit
the layout of the report. You can customize the appearance of the report,
change column labels, and apply aggregation rules for direct database
requests.
d. On the Results tab, you can configure rules for data selection in the Selection
Steps pane to refine the data on which the report works.
e. On the Prompts tab, you can add and configure user input prompts in the
Prompts pane to create a form in which users specify their report parameters.
f. On the Prompts tab, you can configure the title, text, and appearance of the
prompts form in the Display pane.
4. To add subject areas to the report:
a. On the Criteria tab, click Show More Buttons in the Subject Area pane.
b. Click Add / Remove Subject Areas, select the subject areas, and then click
OK
5. To add and configure columns for the report:
a. On the Criteria tab, find the columns you want to add to the report in the
Subject Area pane.
If you added another subject area to the report, measure columns do not
return values if the attribute and hierarchy columns in the report do not apply
to all subject areas.
2-10Chapter 2
Managing Analysis Reports
b. Drag and drop the columns to the Selected Columns pane.
c. To configure the sorting order for a column, click the configure icon, select
Sort, and then select the sorting method.
d. To change the aggregation rule for a column, click the configure icon, select
Edit Formula, and then select the Aggregation Rule from the drop-down list.
e. To configure filters for a column, click the configure icon, select Filter, and
then configure the filter for the column.
6. To add a filter for a subject area element that is not a column in the report:
a. On the Criteria tab, click the Create a filter for the current Subject Area
button in the Filters pane.
b. Navigate to the subject area element by which you want to filter, and then click
OK.
c. Configure the filter settings, and then click OK.
7. To add and configure prompts for user input when running the report:
a. On the Prompts tab, click the New button.
b. Select the type of prompt you want to add.
c. Configure the prompt, and then click OK.
8. To configure the prompt form:
a. On the Prompts tab, click the Edit button in the Display pane.
b. Configure the form, such as by setting the title and information text to show
with the user input prompts, and then click OK.
9. Click Save As to save the report in your My Folder. You can now publish the
report.
Related Topics
• Publishing an Analysis Report
Related Topics
• Converting Ad Hoc Reports to Analysis Reports
• Converting Interactive Reports to Analysis Reports
Related Topics
• Analysis Report Date Session Variables
Managing Analysis Reports
If you have access to the Oracle Business Intelligence (OBI) portlet, you can access
the analysis reports that you created and saved to your personal folder.
1. In the Reporting and Analytics side menu, click the link to go to the Analysis
Reports page. If you cannot find the link, contact your system administrator.
2. Click Modify/Delete Analysis.
3. In My Folders, navigate to the analysis report.
4. To edit the analysis report, click Edit. Changes to the report only affect your local
instance and do not affect the published instance of the report. If you want to apply
changes to a published report, you must unpublish and then republish the report.
2-11Chapter 2
Analysis Report Permissions
5. To print the analysis report, right-click the report, click Print, and then select a
printable format.
6. To export the analysis report, right-click the report, click Export, and then select a
file or data format.
7. To delete the analysis report, right-click the report, and then click Delete. This
does not affect the published instance of a report.
8. To make a copy of the analysis report, right-click the report, and then click Copy.
9. To change the filename of the analysis report, right-click the report, and then click
Rename. This does not affect the published instance of a report.
Related Topics
• Publishing an Analysis Report
Analysis Report Permissions
Analysis Reports implement the following user permissions:
• All users with access to OBIEE Analysis can create, preview, modify, and publish
their own reports through the portlet.
Users with the Publish/Un-Publish Analysis permission can publish reports
created by other users.
• All users, regardless of access to OBIEE Analysis, can run published reports, and
can then export, print, add to a briefing book, and copy the analysis XML for the
report output.
Related Topics
• File Permissions and Publishing
• Configuring Analysis Report Permissions
• Publishing an Analysis Report
File Permissions and Publishing
Analysis Reports enforce file permissions by restricting access to the My Folder for
each user account and to the Shared Folder for each organization:
• Only the specific user can view and access the contents of their My Folder.
• All users can view the content of the Shared Folder but cannot enact changes.
When you create an analysis report, the system creates and saves the report in your
My Folder. This prevents all other users from being able to run and perform
modifications on your report.
When you publish the report, the system creates a copy of your saved report in the
Shared Folder, and allows users without access to the OBIEE Analysis portlet to
run the report.
Related Topics
• Analysis Reports
2-12Chapter 2
Configuring Analysis Report Permissions
Related Topics
• Analysis Report Permissions
• Configuring Analysis Report Permissions
• Publishing an Analysis Report
Configuring Analysis Report Permissions
1. In the Reporting and Analytics side menu, click the link to go to the Role Portlets
Administrator For page. If you cannot find the link, contact your system
administrator.
2. Select the user role for which you want to configure analysis reports publishing
permissions, and then click Configure.
3. Add the OBIEE Analysis portlet, or select OBIEE Analysis and then click Edit.
4. Select or unselect Publish/Un-Publish Analysis, and then click Save.
Related Topics
• File Permissions and Publishing
• Analysis Report Permissions
• Publishing an Analysis Report
Publishing an Analysis Report
1. In the Reporting and Analytics side menu, click the link to go to the Analysis
Reports page. If you cannot find the link, contact your system administrator.
2. Click Publish Analysis.
3. Use the filters to find and select the report for which you want to configure
permissions, and then click Publish.
4. Select whether to configure permissions for the report at the Roles level or at the
individual Users level.
You cannot configure a report to have both role-level and user-level permissions.
For example, if you configure role-based permissions for a report, and then
configure user-based permissions, the user-based permissions overwrite the role-
based permissions.
5. Use the lists and arrows to add or remove permissions, and then click Save.
Related Topics
• Creating Analysis Reports
Related Topics
• Managing Analysis Reports
Related Topics
• File Permissions and Publishing
• Analysis Report Permissions
• Configuring Analysis Report Permissions
2-13Chapter 2
Analysis Report Date Session Variables
Analysis Report Date Session Variables
You can use the Oracle Business Intelligence function or session variables installed by
Reporting and Analytics as described in the following tables when configuring formulas
and columns for dates in Analysis Reports.
All examples assume that:
• The Point-of-Sale application at the store runs End-of-Day (EOD) operations every
day, even when the store remains closed.
• The starting day of the week for the 4-4-4 financial year is Thursday.
Today and Yesterday
The Today and Yesterday variables do not work based off of the current calendar
date, as described in the following table:
Table 2-2 Today and Yesterday
Session Variable Name Description Examples
To-day The most recent day that a If a store opens Monday,
guest check was entered into December 27 and you run a
the system. report for Today:
• Before entering a guest
check, the report runs for
Sunday, December 26. In
this situation, the system
continues to recognize
Sunday as To-day
because that remains the
most recent day that a
guest check was entered
into the system.
• After entering a guest
check, the report runs for
Monday, December 27. In
this situation, the system
recognizes that the new
guest check was entered
on Monday, December
27, and therefore
recognizes Monday as
the latest day that a guest
check was entered into
the system.
2-14Chapter 2
Analysis Report Date Session Variables
Table 2-2 (Cont.) Today and Yesterday
Session Variable Name Description Examples
Yesterday The most recent closed (full) If a store opens Monday,
business day. December 27, and you run a
report for Yesterday, the
report runs for Sunday,
December 26.
If your store runs EOD
operations at 7 PM and you
run the report at 9 PM, the
report runs for Monday,
December 27, because the
EOD operation has closed the
Monday business day.
Days
You can use the following variables to perform calculations based on a specific day
relative to the most recent closed business day, or Yesterday.
Table 2-3 Day Session Variables
Session Variable Name Description Examples
SameDayLastWeek The day that is one financial If a store opens Monday, May
week prior to Yesterday. 28, and you run a report for
SameDayLastWeek, the
report runs for Sunday, May
20.
2-15Chapter 2
Analysis Report Date Session Variables
Table 2-3 (Cont.) Day Session Variables
Session Variable Name Description Examples
SameDayLastYear The day that is one financial The current day is Monday,
year prior to Yesterday. May 28. When a report runs to
calculate revenue for
SameDayLastYear, the report
calculates the revenue for
Sunday, May 28 the previous
year.
SameDateLastYear The same date as Yesterday The current day is Monday,
in the previous financial year. May 28. When a report runs to
calculate revenue for
SameDateLastYear, the report
calculates the revenue for
Saturday, December 27 the
previous year.
Weeks
You can use the following variables to perform calculations based on a specific week.
2-16Chapter 2
Analysis Report Date Session Variables
Table 2-4 Week Session Variables
Variable Name Description Examples
Past7Days The seven most recent full If a store opens Monday, May
(closed) business days. 28, and you run a report for
Past7Days, the report runs for
Monday, May 21 to Sunday,
May 27.
CurrentFinancialWeek The financial week that If a store opens Monday, May
includes Yesterday. 28, and you run a report for
CurrentFinancialWeek, the
report runs for Thursday, May
24 to Wednesday, May 30.
LastWeekFinancial The financial week that If a store opens Monday, May
includes SameDayLastWeek. 28, and you run a report for
LastWeekFinancial, the
system determines
SameDayLastWeek is
Sunday, May 20, and the
report runs for Thursday, May
17 to Wednesday, May 23.
2-17Chapter 2
Analysis Report Date Session Variables
Table 2-4 (Cont.) Week Session Variables
Variable Name Description Examples
LastWeekWTDFinancial The days in the previous If a store opens Monday, May
financial week up to and 28, and you run a report for
including SameDayLastWeek. LastWeekWTDFinancial, the
system determines
SameDayLastWeek is
Sunday, May 20, and the
report runs for Thursday, May
17 to Sunday, May 20.
SameWTDLastYearFinancial The days in the corresponding If a store opens Monday, May
financial week in the previous 28, and you run a report for
financial year up to and SameWTDLastYearFinancial,
including SameDayLastYear. the system determines
SameDayLastYear is Sunday,
May 28, and the report runs
for Wednesday, May 24 to
Sunday, May 28.
Months
You can use the following variables to perform calculations based on a specific month.
2-18Chapter 2
Analysis Report Date Session Variables
Table 2-5 Month Session Variables
Variable Name Description Examples
CurrentMonth The days in the current If a store opens Monday, May
calendar month up to and 28, and you run a report for
including Yesterday. CurrentMonth, the report runs
for Tuesday, May 1 to Sunday,
May 27.
LastMonthMTD The days in the previous If a store opens Monday, May
calendar month up to and 28, and you run a report for
including the same date as LastMonthMTD, the report
Yesterday. runs for Tuesday, May 1 to
Sunday, May 27.
2-19Chapter 2
Analysis Report Date Session Variables
Table 2-5 (Cont.) Month Session Variables
Variable Name Description Examples
SameMTDLastYear The days in the same If a store opens Monday, May
calendar month of the 28, and you run a report for
previous year, up to and SameMTDLastYear, the report
including the same date as runs for Monday, May 1 to
Yesterday. Saturday, May 27 for the
previous year.
Financial Periods
You can use the following variables to perform calculations based on a specific
financial period.
2-20Chapter 2
Analysis Report Date Session Variables
Table 2-6 Financial Period Session Variables
Variable Name Description Examples
CurrentFinancialPeriod The days in the current If a store opens Monday, May
financial period up to and 28, and you run a report for
including Yesterday. CurrentFinancialPeriod, the
report runs for Thursday, May
3 to Sunday, May 27.
LastPeriodPTDFinancial The days in the previous If a store opens Monday, May
financial period up to and 28, and you run a report for
including the day in the period LastPeriodPTDFinancial, the
that corresponds to Yesterday. report runs for Thursday, April
5 to Sunday, April 29.
2-21Chapter 2
Analysis Report Date Session Variables
Table 2-6 (Cont.) Financial Period Session Variables
Variable Name Description Examples
SamePTDLastYearFinancial The days in the same financial If a store opens Monday, May
period of the previous financial 28, and you run a report for
year, up to and including the SamePTDLastYearFinancial,
same day as Yesterday. the report runs for
Wednesday, May 3 to
Saturday, May 27.
Financial Quarters
You can use the following variables to perform calculations based on a specific
financial quarter.
2-22Chapter 2
Analysis Report Date Session Variables
Table 2-7 Financial Quarter Session Variables
Variable Name Description Examples
CurrentFinancialQuarter The days in the current If a store opens Monday, May
financial quarter up to and 28, and you run a report for
including Yesterday. CurrentFinancialQuarter, the
report runs for Thursday,
February 8 to Sunday, May
27.
2-23Chapter 2
Analysis Report Date Session Variables
Table 2-7 (Cont.) Financial Quarter Session Variables
Variable Name Description Examples
LastQuarterQTDFinancial The days in the previous If a store opens Monday, May
financial quarter up to and 28, and you run a report for
including the day in the CurrentFinancialQuarter, the
quarter that corresponds to report runs for Thursday,
Yesterday. November 16 to Sunday,
February 7.
2-24Chapter 2
Analysis Report Date Session Variables
Table 2-7 (Cont.) Financial Quarter Session Variables
Variable Name Description Examples
SameQTDLastYearFinancial The days in the same financial If a store opens Monday, May
quarter of the previous 28, and you run a report for
financial year, up to and SameQTDLastYearFinancial,
including the same day as the report runs for Thursday,
Yesterday. February 8 to Saturday, May
27.
2-25Chapter 2
Analysis Report Date Session Variables
Table 2-7 (Cont.) Financial Quarter Session Variables
Variable Name Description Examples
2-26Chapter 2
Analysis Report Date Session Variables
Years
You can use the following variables to perform calculations based on a specific year.
Table 2-8 Year Session Variables
Variable Name Description Examples
CurrentYear The days in the current If a store opens Monday, May
calendar year up to and 28, and you run a report for
including Yesterday. CurrentYear, the report runs
for Monday, January 1 to
Sunday, May 27.
LastYearYTD The days in the previous If a store opens Monday, May
calendar year, up to and 28, and you run a report for
including the respective day LastYearYTD, the report runs
for Yesterday. for Sunday, January 1 to
Saturday, May 27 for the
previous calendar year.
CurrentFinancialYear The days in the current If a store opens Monday, May
financial year up to and 28, and you run a report for
including Yesterday. CurrentYear, the report runs
for Thursday, June 1 to
Sunday, May 27.
LastYearYTDFinancial The days in the previous If a store opens Monday, May
financial year, up to and 28, and you run a report for
including the respective day LastYearYTD, the report runs
for Yesterday. for Wednesday, June 1 to
Saturday, May 27 for the
previous financial year.
Related Topics
• Creating Analysis Reports
Related Topics
• Financial Calendars and Day Parts
2-273
Core Reports
Reporting and Analytics installs core reports, which are pre-defined reports that show
information targeting specific business operations. The core reports do not include
core reports from other regions such as EMEA, customized reports, and reports
installed by other Enterprise Back Office products. You can configure the core reports
to handle information from within a certain date range or from data that applies to a
certain organizational level, such as a revenue center or a location.
For example, you can use the Daily Operations Summary report as part of your start-
of-day process to review high-level operations data for the previous business day at a
specific store. You can then run the report for all locations and compare the store to
the whole enterprise.
• Running Reports
• Modifying Reports
• Exporting Reports
Related Topics
• Choosing a Report Type
Related Topics
• Scheduled Reports
Running Reports
1. In the Reporting and Analytics side menu, click the link to go to the More Reports
page. If you cannot find the link, contact your system administrator.
2. In the Reports list, click the report name, and then click the specific report.
3. Click Run Report.
Modifying Reports
1. In the Reporting and Analytics side menu, click the link to go to the More Reports
page. If you cannot find the link, contact your system administrator.
2. In the Reports list, click the report name, and then click the specific report.
3. On the Modify Report tab, modify the report as described in the following table:
3-1Chapter 3
Modifying Reports
Setting Description
Business Dates Select business dates for the report by
performing one of the following:
• Select the range of dates for the report
from the drop-down list.
• Click Business Dates to open the
calendar view.
You can select dates in the calendar view
using the following methods:
• Click a single day.
• Click the month name to select all the
days in the month.
• Click the day column header to select
all those days in the month.
• Click the numbered week to select all
the days in that week.
• Press and hold the Ctrl key to select
multiple days.
Locations Select the locations for which the report
returns data.
Revenue Centers Select the revenue centers for which the
report returns data.
Order Types Select the order types for which the report
returns data.
4. On the Preferences tab, specify how Reporting and Analytics saves reports as
described in the following table:
Option Description
Save When you select the report from the
Reporting and Analytics home page side
menu, the report runs with the settings you
selected in step 3.
For example, if you configure the Daily
Operations report to search by the location
Maryland, USA and then click Save, all
users running the Daily Summary report
generate a report for the location
Maryland, USA unless they change the
search settings.
Restore defaults Restores the factory defaults for the report.
Save as Saves the report with the settings you
selected in step 3 as a custom report in
Other Reports.
For example, you can configure the Daily
Operations report for a specific organization
and save it as an alternate version of the
Daily Operation report, as shown in the
following image:
5. On the Favorite tab, specify settings as described in the following table:
3-2Chapter 3
Exporting Reports
Setting Description
Set as Favorite Makes the report easier to access.
Reporting and Analytics adds a star next to
the report name and adds it to the Reports
section of the home page side menu.
Set as Home Report You can configure your personal settings to
open the report when you log in to Reporting
and Analytics.
Configuring User Preferences provides
more information.
Enable Auto Run Controls if the report runs after you click the
report. If you turn off this setting, you have
to click Run Report every time you want to
run the report.
6. Click Run Report.
Exporting Reports
You can export reports as file formats configured by administrators, such as PDF,
Microsoft Excel, and comma-separated values.
1. Run a report or modify and then run a report.
2. Click the export format icon next to the Favorites tab.
3. Save the exported file.
When you save to a CSV file, Reporting and Analytics inserts comma delimiters
with double-quotation text qualifiers. Some reports also contain the following
mathematical symbols: + - =. The symbols can cause formatting issues when you
open a CSV file in Microsoft Excel.
3-34
Custom Reports in Microsoft Excel
iQuery is a Microsoft Excel plug-in that enables you to create reports using selected
subjects and columns.
For example, if you want a start-of-day report that replaces the Operating Metrics
section of the Daily Operations Summary report with information about the three best-
selling items for that day and some labor performance and efficiency analysis, you can
create a report with the fields you want to see. You can then save the custom report
into Reporting and Analytics so you can launch the report from the sidebar.
• Installing iQuery
• Building a Custom Report in Microsoft Excel
Related Topics
• Choosing a Report Type
Related Topics
• Scheduled Reports
Installing iQuery
1. Close Microsoft Excel if it is open.
2. In the Reporting and Analytics side menu, click the link to go to the iQuery
Download page. If you cannot find the link, contact your system administrator.
3. Click Install MICROS iQuery - Office 2007+ and then save iQuerySetup.exe
to a temporary location on your computer.
4. Double-click the iQuerySetup.exe file and then follow the prompts to install the
software.
5. Validate the installation:
a. Open Microsoft Excel.
b. Locate the iQuery plug-in, and then open iQuery.
The location varies depending on the version of Microsoft Excel. For example,
in Microsoft Excel 2013, access iQuery from the ADD-INS ribbon.
c. Log in to iQuery.
Building a Custom Report in Microsoft Excel
1. Select a query subject.
2. Select the column data that appears in the spreadsheet when you run the query.
Use the up and down arrows to adjust the order of the columns in the
spreadsheet. For example, if you move a column to the top of the list, that column
is the first column in the spreadsheet.
4-1Chapter 4
Building a Custom Report in Microsoft Excel
3. To apply a mathematical operation to column data, select it from the Operation
drop-down list.
4. Specify filters to refine query results:
a. Select a business date or date range.
b. Select locations.
c. Select revenue centers for the locations.
d. Select other filters.
5. Define the order in which iQuery sorts the data.
6. Click Preview to verify that the query returns the correct results.
If the preview does not return results or returns too many rows, change query
settings and the preview the query again.
7. Click Run to show the results in Microsoft Excel.
8. Save the query.
To save the query on your computer so you can run it at a later time from
Microsoft Excel, click Query. iQuery does not save the business date because you
change the date each time you run the query.
To save the query as a report, click Report. Users assigned to the role for
accessing custom reports can run the report from Reporting and Analytics.
4-25
Scheduled Reports
You can use Report Mail to schedule reports to run at a specified date and time, and
to distribute the report by email to a user or role.
For example, you can configure Report Mail to generate and send an inventory report
every morning so that you can check on re-stocks or pre-prepared food.
• Scheduling Reports for Email Distribution
Related Topics
• Choosing a Report Type
Related Topics
• Analysis Reports
• Core Reports
• Custom Reports in Microsoft Excel
Scheduling Reports for Email Distribution
1. In the Reporting and Analytics side menu, click the link to go to the Report Mail
Administration Menu page. If you cannot find the link, contact your system
administrator.
2. Click Report Mail, and then click Add.
3. On the Content tab, specify email content as described in the following table:
Setting Description
Type Select the report type.
Report Selection Select the report. For long lists of reports,
specify search criteria to locate the report.
Preferences Specify delivery preferences. The report you
select determines the preferences that
appear.
If you select multiple locations, Reporting
and Analytics sends one report for each
location.
If you select Consolidated, Reporting and
Analytics sends aggregate report data for all
locations in one email.
Reporting and Analytics sends each report
in a separate email. If you select Zip
multiple files, Reporting and Analytics
sends one mail with a ZIP file containing the
report files.
4. On the Name tab, specify email settings as described in the following table:
5-1You can also read