European Digital Elevation Model Validation against Extensive Global Navigation Satellite Systems Data and Comparison with SRTM DEM and ASTER GDEM ...
←
→
Page content transcription
If your browser does not render page correctly, please read the page content below
International Journal of
           Geo-Information

Article
European Digital Elevation Model Validation against
Extensive Global Navigation Satellite Systems Data
and Comparison with SRTM DEM and ASTER
GDEM in Central Macedonia (Greece)
Antonios Mouratidis 1, *            and Dimitrios Ampatzidis 2
 1    Department of Physical and Environmental Geography, Aristotle University of Thessaloniki,
      54124 Thessaloniki, Greece
 2    Federal Agency for Cartography and Geodesy, Richard-Strauss-Allee 11,
      60598 Frankfurt am Main, Germany; Dimitrios.Ampatzidis@bkg.bund.de
 *    Correspondence: amourati@geo.auth.gr

 Received: 11 January 2019; Accepted: 25 February 2019; Published: 28 February 2019

 Abstract: Digital elevation models (DEMs) are a widely used form of topographic information,
 with some of the most popular being the Shuttle Radar Topography Mission (SRTM) DEM and the
 Advanced Spaceborne Thermal Emission and Reflection Radiometer Global Digital Elevation Model
 (ASTER GDEM). These two sources of topographical information are the main constituents of the
 European Union Digital Elevation Model (EU-DEM), which is a relatively new dataset of the EU’s
 Copernicus Land Monitoring Service. In this context, the purpose of this study was to validate
 EU-DEM for its vertical accuracy and to compare it with SRTM DEM and ASTER GDEM data. This
 was achieved in a Geographic Information System (GIS) environment, using extensive—in the order
 of tens of thousands of points—geodetic Global Navigation Satellite System (GNSS) measurements
 and appropriate pre-processing steps. The absolute elevation errors results had a Root Mean Square
 Error (RMSE) of 2.7 m at a 90% confidence level and characterize the performance of EU-DEM from
 local to regional scale, generally confirming that it is an enhanced source of elevation information
 when compared with its predecessors.

 Keywords: EU-DEM; SRTM; ASTER GDEM; DEM; DTM; digital elevation model; digital terrain
 model; GNSS; GIS; validation

1. Introduction
     Digital elevation models (DEMs) are the most popular form of topographic data. The positive
impact of (almost) global and publicly available DEMs from space-based measurements, such as the
Shuttle Radar Topography Mission (SRTM) DEM data [1] and the Advanced Spaceborne Thermal
Emission and Reflection Radiometer Global Digital Elevation Model (ASTER GDEM) [2–4], has been
verified by the plethora of their applications. SRTM DEM has been described as the most dramatic
advance in cartography since Mercator [5], whereas current products, like ALOS Global Digital
Surface Model “ALOS World 3D–30 m (AW3D30)” [6] or WorldDEM™ [7], and near-future mission
concepts such as the Lidar Surface Topography (LIST) [8] emphasize the quest for increasingly accurate
descriptions of the global topography and underline the topography’s time dependence, turning its
measurement into a continuous task [5].

ISPRS Int. J. Geo-Inf. 2019, 8, 108; doi:10.3390/ijgi8030108                       www.mdpi.com/journal/ijgi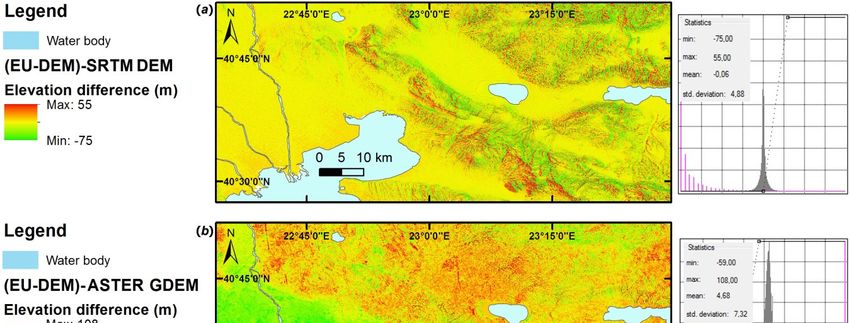
ISPRS Int. J. Geo-Inf. 2019, 8, 108                                                                 2 of 18

      In this context, the European Union Digital Elevation Model (EU-DEM) is a new hybrid product
principally based on SRTM DEM and ASTER GDEM data, and on publically available Russian
topographic maps for regions north of 60◦ N. More EU-DEM is a Digital Surface Model (DSM) over
Europe from the Global Monitoring for Environment and Security (GMES) Reference Data Access
(RDA) project—a realization of the Copernicus (former GMES) program, managed by the European
Commission/DG Enterprise and Industry.
      The first version (v1) of EU-DEM was released in October 2013. For the first year, the data were
provided without formal validation [9]. Subsequently, an independent statistical validation, scheduled
as part of the GMES Initial Operations (GIO) land monitoring service activities, was officially released
in August 2014 [10]. In April 2016, an updated version (v1.1) of EU-DEM was released as an upgrade
that enhances the correction of geo-positioning issues, reducing the number of artefacts, improving
the vertical accuracy of EU-DEM, and ensuring consistency with other relevant public EU geospatial
data [11].
      DEM vertical accuracy is influenced by several factors such as slope, land cover, and geolocation
(horizontal) error, as well as other systematic biases due to the original DEM data collection
(e.g., satellite imaging geometry) and/or production method. In addition, irrespective of the
vertical accuracy, a qualitative assessment of DEMs may be crucial for specific disciplines such as
geomorphology [3,12–17].
      Validation of DEMs produced from Earth observation data, such as SRTM DEM, ASTER GDEM,
and other less extensive DEMs, is commonly performed using datasets of higher accuracy, typically
of at least one order of magnitude. The sources of these datasets have been higher resolution
DEMs [15,16], medium to large-scale topographic maps [17], altimetric data [18,19], surveying or
Global Positioning System (GPS) measurements [20–25], as well as global [15] or regional [26] kinematic
GPS (KGPS) campaigns.
      The most extensive global ground-truth effort was completed for the validation of SRTM data
by collecting a globally distributed set of ground control points (GCPs) using KGPS transects. The
KGPS data were collected by vehicles carrying GPS receivers. The total data collection yielded nearly
9.4 million samples covering six continents with a general accuracy of about 50 cm. In the end, more
than 2,000,000 of the aforementioned GCPs were included in this validation endeavor [15,27]. The
most detailed study for the validation of DEMs for a large area was performed on a local to regional
level with over 60,000 KGPs data points [26], with the density of the KGPs data collected (about
8.6 points/km2 ) being more than 100 times larger with respect to the data density used for the global
assessment of SRTM (about 0.06 points/km2 ).
      The vertical accuracy specifications of the SRTM DEM at 90% confidence have a Root Mean Square
Error (RMSE) of 9.73 m for absolute elevations and a RMSE of 6 m for relative elevations on a local
50–100 km scale [1,28–31]. SRTM DEM data have been validated by many other authors, with most of
them concluding that the vertical accuracy is significantly better than the nominal accuracy. The official
global vertical accuracy of ASTER GDEM version 2 (v2) is characterized by an RMSE of 17 m at 95%
confidence [4,16,32], as opposed to the officially reported vertical accuracy of 20 m RMSE (95%) for
ASTER GDEM v1 [3]. According to Varga and Bašić [33], many other studies have investigated ASTER
GDEM, reporting a RMSE range of estimated vertical accuracy between 6 m and 30 m. For the same
area as per this study, SRTM DEM and ASTER GDEM v1 data have both been previously validated for
their vertical accuracy [26,34], with results yielding a RMSE of 6.4 m and 12.5 m, respectively.
      According to the independent statistical validation of EU-DEM v1 [10], the overall EU-DEM v1
vertical accuracy was assessed to have an RMSE of 2.90 m (95% confidence). This general accuracy,
however, masks a distinct difference between latitudes south and north of 60◦ N. The calculation of the
vertical accuracy for these two regions separately reveals an overall vertical RMSE accuracy of 2.23 m
for the region south of 60◦ N and an RMSE of 5.19 m for the region north of 60◦ N at 95% confidence,
whereas, specifically for Greece, the vertical RMSE is in the order of 2 m (95%). This lower accuracy in
the northern latitudes is attributed to the lack of SRTM data north of 60◦ N and hence to the reliance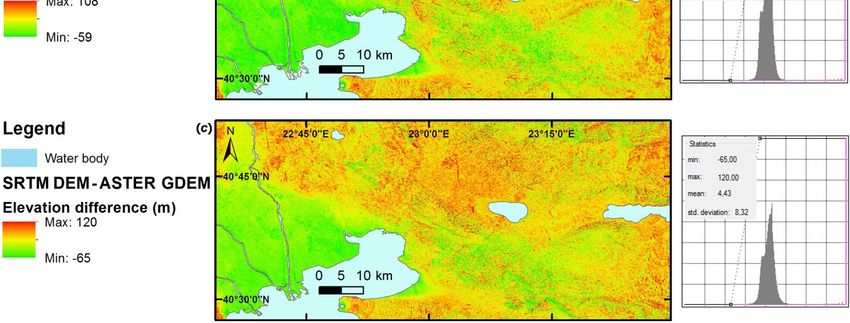
ISPRS Int. J. Geo-Inf. 2019, 8, 108 3 of 18
on ASTER GDEM data alone or the combination of ASTER GDEM and Russian topographic maps [10].
The RMSE of the nominal vertical accuracy of the upgraded version (EU-DEM v1.1) has been estimated
to be in the order of 7 m [35,36]. The quality of the data has been verified by several quality control
process, including a statistical comparison and visual checks [36].
A local scale (area of about 25 × 15 km) and relatively small elevation range (139–682 m) of
EU-DEM v1 was more recently reported in Hungary [37]. EU-DEM v1 was compared against ASTER
GDEM, SRTM DEM, and contour-based DEMs from 1:10,000 scale topographic maps. The latter DEM
was interpolated with a 10-m cell size and then downsampled to 30 m to represent the ground truth
values, ultimately estimating the RMSE of the vertical accuracy of EU-DEM to be between 6.0 m
and 7.8 m.
Based on this background, the objective of this study was to validate the vertical accuracy of
EU-DEM (both v1 and v1.1) on a local to regional scale against primary elevation data measured
in the field with high reliability, as well as to compare it with SRTM DEM and ASTER GDEM
data. This was essentially achieved in a geographic information system (GIS) environment using
extensive—in the order of tens of thousands of points—geodetic Global Navigation Satellite Systems
(GNSS) measurements preceded by appropriate pre-processing steps. The main purpose was to
examine the hypothesis that EU-DEM synthesizes the advantages of its sources, i.e., is characterized
by a higher vertical accuracy than SRTM DEM and ASTER GDEM.
As EU-DEM is produced through a fusion processing chain including both horizontal and
vertical shifting as well as smoothing of the input layers [36], this independent study involved a blind
experiment in that the exact algorithm that produced EU-DEM from SRTM DEM and ASTER GDEM
data was not known a priori.
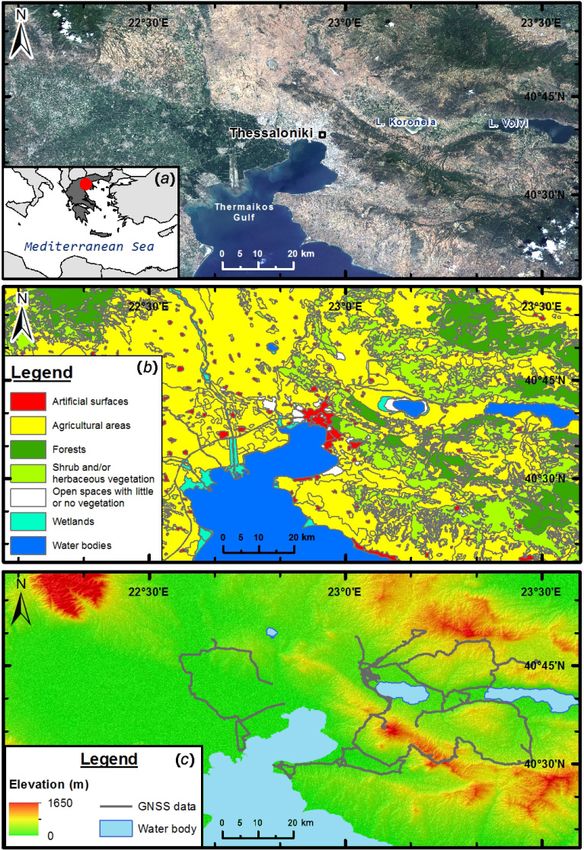
2. Study Area
The study area extends over an area of about 100 × 70 km in Central Macedonia, Northern
Greece (Figure 1a). Land cover consists mainly of agricultural areas or pastures (~60%), shrubs or low
vegetation (~20%), and forests (~10%) (Figure 1b). Its topography varies from extensive lowlands and
(locally) below Mean Sea Level (MSL) elevation areas, owing to subsidence, to hilly and mountainous
regions (Figure 1c). Since 2008, the area has been serving as a test site for the GNSS-assisted validation
of various DEMs derived from Earth observation data, such as the four available versions of SRTM
DEM [26], the first version of ASTER GDEM (released in 2009), photogrammetrically produced DEMs
from stereoscopic SPOT images, Interferometric Synthetic Aperture Radar (InSAR) DEMs from ERS
tandem data, as well as DEMs originating from the digitization of topographical maps [34].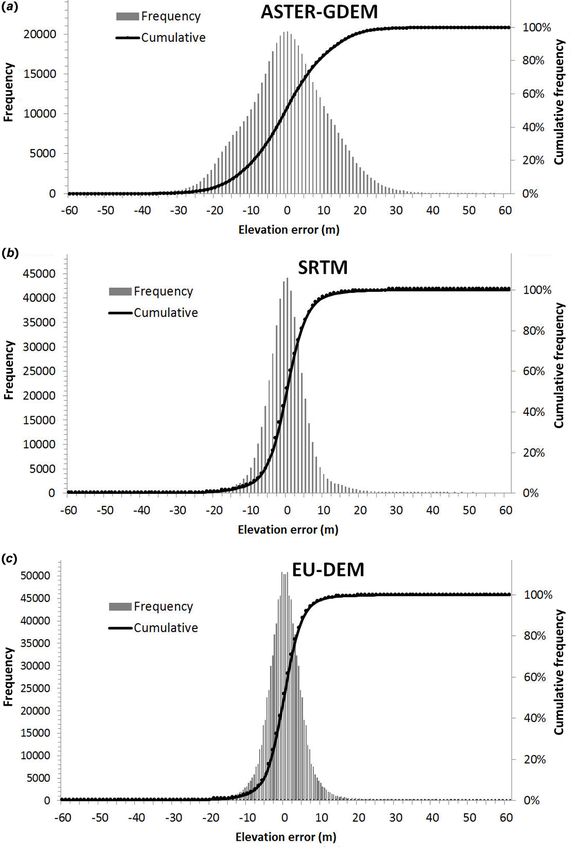
ISPRS Int. J. Geo-Inf. 2019, 8, 108                                                                          4 of 18
ISPRS Int. J. Geo-Inf. 2019, 8, x FOR PEER REVIEW                                                                               4 of 19

     Figure 1.Figure
                (a) Broad     overview
                      1. (a) Broad         study
                                    overview       area,
                                               study  area,asasseen  in aaLandsat-8OLI
                                                                seen in    Landsat-8OLI       (Operational
                                                                                          (Operational       Land Imager)
                                                                                                       Land Imager)   true  true
              color composite
     color composite     image;image;    (b) land
                                   (b) land   covercover of the
                                                     of the       studyarea
                                                               study     areaaccording
                                                                              according totoCorine Land
                                                                                              Corine     Cover
                                                                                                      Land      data;data;
                                                                                                            Cover     and and (c)
              (c) topography   of the study area and tracks  of Global Navigation  Satellite Systems
     topography of the study area and tracks of Global Navigation Satellite Systems (GNSS) data      (GNSS) data collected
              for DEM validation purposes.
     collected for DEM validation purposes.
         3. Materials and Methods
3. Materials and Methods
         3.1. Data Used in the Evaluation

3.1. Data3.1.1.
          UsedDigital
                in theElevation
                       Evaluation
                                Models
               The DEMs simultaneously evaluated in this study included:
3.1.1. Digital Elevation Models
         (1)    EU-DEM v1: The original version of EU-DEM produced by merging NASA’s SRTM DEM v2
     The DEMs(alsosimultaneously     evaluated
                   known as the “finished”        inwith
                                            version)  thisASTER-GDEM
                                                          study included:
                                                                        v2 1-arcsec data to generate a 1-arcsec
    (1) EU-DEM      v1: The
             resolution      original
                        (about  23 × 30version
                                          m in theofstudy
                                                     EU-DEM      produced
                                                          area) DEM   using aby  merging
                                                                              weighted      NASA’sapproach.
                                                                                          averaging   SRTM DEM v2
             EU-DEM    is generated   as a contiguous   dataset divided into 1 ◦ × 1◦ tiles, corresponding to
        (also known as the "finished" version) with ASTER-GDEM v2 1-arcsec data to generate a
             the SRTM DEM naming convention. The spatial reference system of EU-DEM is geographic
        1-arcsec   resolution (about 23 × 30 m in the study area) DEM using a weighted averaging
             latitude/longitude, with horizontal datum ETRS89, ellipsoid GRS80 and vertical datum the o
        approach. EU-DEM is generated as a contiguous dataset divided into 1° × 1 tiles,
        corresponding to the SRTM DEM naming convention. The spatial reference system of
        EU-DEM is geographic latitude/longitude, with horizontal datum ETRS89, ellipsoid GRS80
        and vertical datum the European Vertical Reference System 2000 (EVRS2000), using the
        European Gravimetric Geoid model EGG08. The 1o × 1o tiles are then also aggregated into 5°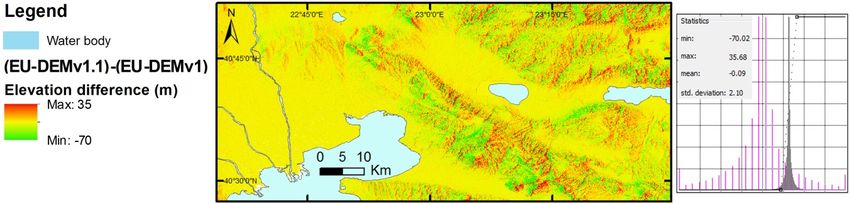
ISPRS Int. J. Geo-Inf. 2019, 8, 108                                                                     5 of 18

       European Vertical Reference System 2000 (EVRS2000), using the European Gravimetric Geoid
       model EGG08. The 1◦ × 1◦ tiles are then also aggregated into 5◦ × 5◦ tiles, which are further
       projected to the European Terrestrial Reference System 1989-Lambert Azimuthal Equal Area
       projection (ETRS89-LAEA) by the Joint Research Centre (JRC) [9].
(2)    EU-DEM v1.1: A resulting dataset of the EU-DEM v1.0 upgrade, enhancing geolocation accuracy
       with the use of SPOT 2011 imagery, screening and removal of artefacts including the presence of
       blunders (i.e., negative or positive anomalies), improving the vertical accuracy using Ice, Cloud,
       and land Elevation Satellite (ICESat) data as reference (bias adjustment with ICESat points),
       as well as ensuring consistency with EU-Hydro 2015 data (river networks, coastlines, water
       bodies). EU-DEM v1.1 is only provided in projected coordinates (ETRS89-LAEA) in grouped tiles
       covering extensive regions at a 25-m resolution [11].
(3)    SRTM DEM v4: A 3-arcsecond resolution (about 69 × 90 m in the study area) DEM, delivered
       in 5◦ × 5◦ tiles by the Consultative Group on International Agricultural Research-Consortium
       for Spatial Information (CGIAR-CSI) [38]. A thorough validation of SRTM DEM for the area of
       interest can be found in Mouratidis et al. [26]. Note that according to Mouratidis et al. [26], for the
       area of interest, the CGIAR-CSI SRTM v4 is identical to SRTM v2 from NASA. The reason why
       v4 is used here is because it is provided in larger tiles than v2; thus, for a reasonable study area
       extent, the process of having to mosaic different SRTM DEM tiles can usually be avoided. The
       data are provided in the World Geodetic System of 1984 (WGS 84) latitude and longitude and
       orthometric height with respect to the Earth Geopotential Model of 1996 (EGM96) [39].
(4)    ASTER GDEM version two (v2): This stereoscopic product is an improved version of the first
       release in 2009, with a resolution of 1 arcsecond (about 23 × 30 m in the study area) [4]. It
       includes 260,000 additional scenes to improve coverage, a smaller kernel-to-yield correlation,
       higher spatial resolution, and improved water masking. The negative 5 m overall bias observed
       in ASTER GDEM v1 was eliminated in the newer version. ASTER GDEM v2 is distributed in
       1◦ × 1◦ tiles. The data are given in WGS 84 latitude and longitude and orthometric height with
       respect to the EGM96 geoid.

3.1.2. GNSS Data
     The original reference dataset used for the validation of DEMs consists of a total of about
70,000 GNSS (GPS and GLONASS) points (Figure 1c), collected during three campaigns between
2008 and 2011. More specifically, the dataset consists of about 60,000 kinematic and static GPS
observations from 2008 [26], about 10,000 kinematic and static GNSS (using GPS and GLONASS)
points from Mouratidis and Albanakis [40], as well as a few additional GNSS points (again, using both
GPS and GLONASS signals) collected in static mode in 2011. The kinematic data were surveyed on
roads, whereas the static observations involve the various positions of the reference receivers (bases)
used for the kinematic surveys.
     Both static and kinematic observations were collected with dual-frequency GNSS receivers and
were post-processed. The RMSE of the vertical accuracy of all data collected during the period
2008–2011 ranged between 1 cm and 1.5 m at 95% confidence. The orthometric elevations of the data
collected range from −2 m to 890 m.
     The raw GNSS data are referenced to the International Terrestrial Frame of 2005 (ITRF2005) [41]
and provide geometric (ellipsoidal) heights with reference to the World Geodetic System 1984
(WGS84) ellipsoid.

3.1.3. Other Data and Software
     Additional data used for the validation of the various DEM included Corine Land Cover
information of 2012 (CLC 2012) [42].
     Most of the processing took place in a GIS software, namely ArcGIS™ (ESRI, Redlands, CA, USA).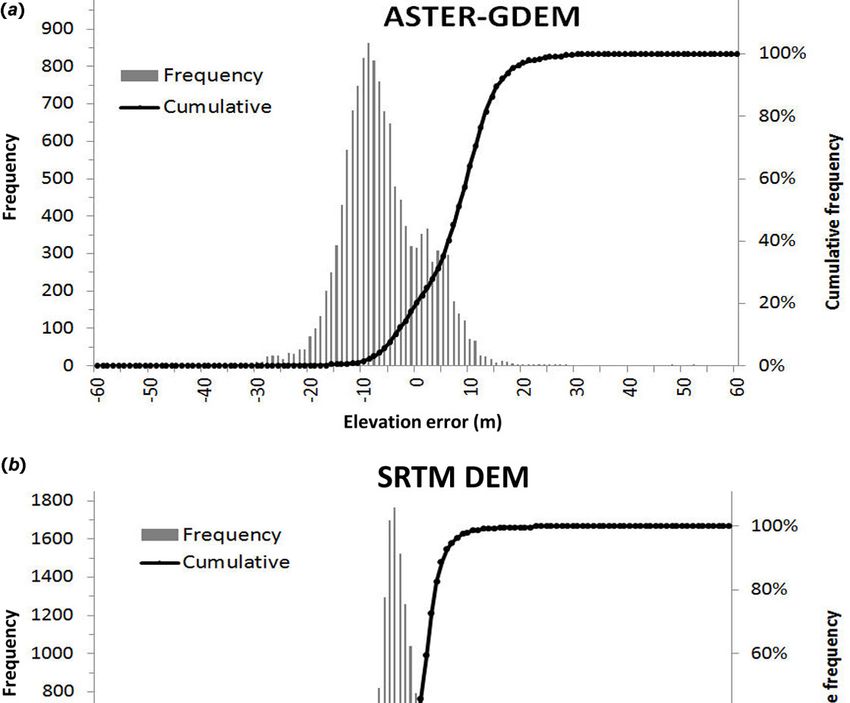
ISPRS Int. J. Geo-Inf. 2019, 8, 108                                                                 6 of 18

3.2. Data Preparation

3.2.1. Horizontal and Vertical Datum Transformations
      As EU-DEM only concerns Europe and adjacent areas, the reference systems used for the
validation procedures in this study were chosen to be those of EU-DEM, i.e., ETRS89 (horizontal)
and EVRS2000 (vertical). Therefore, GNSS, SRTM DEM, and ASTER GDEM data were all initially
converted to ETRS89/EVRS2000.
      In order to be consistent with ETRS89/EVRS2000, the following steps were followed:
      (1) WGS84 refers to the current ITRF solution with an accuracy of 10 cm [43]. Using the
Boucher-Altamimi memo [44], the ETRS89 coordinates were calculated. For this purpose, MATLAB
(MathWorks, Natick, MA, USA) scripts were developed and then tested against the officially released
tools [45], with the accuracy of the transformation being better than 20 cm.
      (2) The difference in the Earth gravity field potential W0 between EGM96 [39] and EVRS2000 [45]
were also considered. Practically, these two vertical datums have a shift difference (∆W0/γ_mean) of
−51 cm, which was considered.
      With respect to the calculation of orthometric elevations, although EGG08 exists for Europe, it has
not been validated in Greece [46]. The vertical data for Greece are not connected to EVRS and there is
no real evidence of EGG08 accuracy in Greece because data is not publically available. A satisfactory
Earth Gravitational Model 2008 (EGM2008) assessment is available for Greece [47]. Thus, instead
of EGG08, the EGM 2008 geoid was used for ellipsoidal to orthometric elevation transformations of
GNSS data.
      Concerning the GNSS point dataset, the RMSE of the accuracy of ellipsoidal height (h)
determination with differential GPS (DGPS) is in the order of 0.5–1 m [48]. Orthometric heights
(H) are then derived from ellipsoidal heights, by subtracting the geoidal undulation (N), i.e., H = h
RMSE N [49]. Thus, for the present case study, N refers to the EGM2008 [50], from which the geoidal
undulation accuracy in Greece is estimated with a standard deviation of approximately 15 cm [51–53].
With the above considerations and considering the error propagation, the RMSE of the overall original
accuracy of the orthometric elevations for the GNSS points collected is in the order of 1 m.
      All datasets used in the validation process (apart from the CLC 2012 layer, which was already
georeferenced in ETRS89-LAEA) were also projected to ETRS89-LAEA coordinates in order to
(1) evaluate the DEM vertical accuracy by deriving and considering slope information and (2) validate
EU-DEM v1.1, which is only provided in projected coordinates.

3.2.2. GNSS Data Pre-Processing
     The original 70,000 GNSS points, equivalent to a density of about 10 points/km2 in the study area,
were filtered in several steps: (1) points with vertical RMSE > 1 m were eliminated; (2) based on a priori
knowledge of the study area, points under overpasses, bridges, etc. were eliminated; (3) points whose
elevation had a standard deviation of more than 1 m within a 30-m distance or more than 5 m for
90-m distance were removed using respective thresholds [15,26]; and (4) to ensure equally distributed
weight among the evaluated EU-DEM pixels and increased vertical accuracy, multiple GNSS points
that fell within a single EU-DEM one arcsecond pixel (approx. 23 m × 30 m at the latitude of the area
of interest) were averaged.
     After completing the above procedures, the final GNSS dataset for validating the available DEMs
consisted of 12,943 points, each one corresponding to a discrete EU-DEM pixel. These GNSS points
were then saved as a separate GIS vector layer, with the orthometric elevation value of each point
registered in the layer’s attribute table.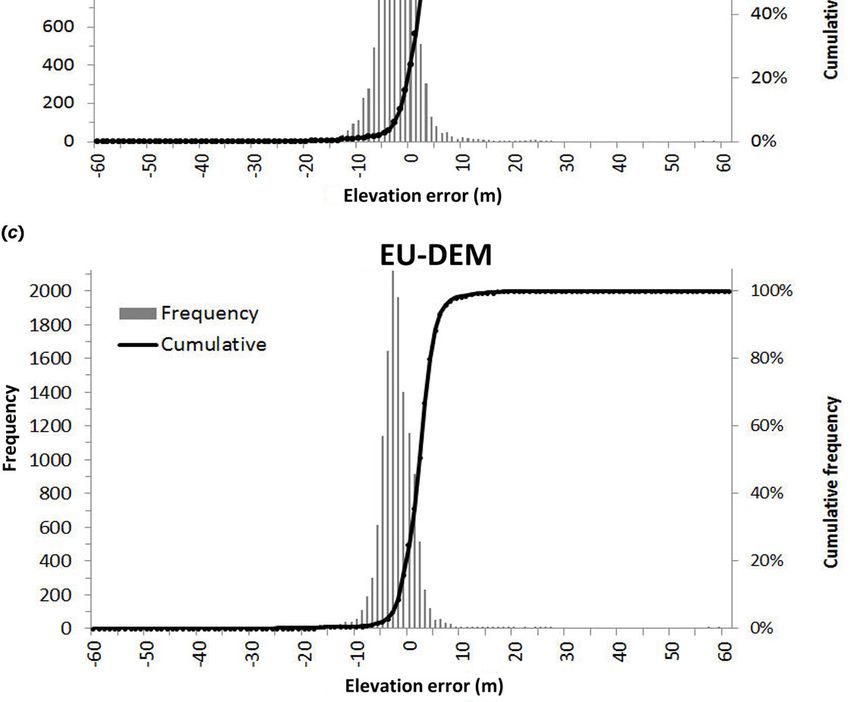
ISPRS Int. J. Geo-Inf. 2019, 8, 108                                                                  7 of 18

3.2.3. Pre-Processing of DEMs
      As a first pre-processing step, the 3 arcsecond SRTM data were resampled to a 1 arcsecond grid,
using nearest neighbor interpolation to match the grids of EU-DEM and ASTER GDEM without
altering the original pixel (elevation) values.
      Next, the actual area of interest, corresponding to the spatial extent of GNSS points available,
was defined in each dataset and the relevant subsets were created, each containing 4542 × 2384 pixels
(approx. 100 × 70 km).
      The raster DEM data were compared against vector GNSS points was realized in a GIS
environment by converting the former to vector format [23,26]. More specifically, all DEMs were
converted to vector GIS layers (shapefiles), as polygons (rectangles) with same size as the former raster
cells, while the elevation value of each cell was retained in the attribute table of the respective polygon.
Subsequently, the vector GIS layer of the final GNSS points was overlain on each of the DEM shapefiles.
Finally, the DEM elevation value at the location of each GNSS point was transferred in the attribute
table of the GNSS in a separate column (one for every DEM). With this, we validated DEM elevation
via GNSS elevations by comparing two columns of corresponding data values in a spreadsheet.

4. Results

4.1. Direct Comparison of EU-DEM with SRTM DEM and ASTER GDEM
      Considering EU-DEM is practically a mathematical product mainly stemming from ASTER GDEM
and SRTM DEM data, prior to assessing the accuracy of the individual DEMs, we acquired an overview
of the differences between the three datasets. To this end, we completed a relative DEM comparison by
executing the following subtractions: (EU-DEM) – SRTM DEM, (EU-DEM) –ASTER GDEM, SRTM
DEM–ASTER GDEM (Figure 2). This comparison first highlighted the extensive similarity of EU-DEM
with SRTM DEM for low elevation (and thus low slope) areas (depicted in yellow in Figure 2a). On the
contrary, major differences were observed at higher elevations. SRTM DEM elevations are overall quite
close to EU-DEM values with a SD of approx. 4.9 m. With reference to ASTER GDEM (Figure 2b),
EU-DEM presents significant discrepancies (mean of approx. 4.7 m and SD of 7.3 m) at both low and
high elevations, but the deviations over rugged terrain and steep slopes are generally smaller than
those with respect to SRTM DEM. The differences between SRTM DEM and ASTER GDEM (Figure 2c)
presented a mean value of 4.4 m and a SD of 8.3 m. The result of this evaluation is both visually and
statistically similar with the EU-DEM-ASTER GDEM comparison, verifying that EU-DEM and SRTM
data values are overall not too far apart. The upgraded version of EU-DEM (EU-DEM v1.1) presented
significant elevation differences from the original version, especially over hilly and mountainous areas,
with an overall SD of 2.1 m (Figure 3).

4.2. Absolute Elevations
      Absolute vertical accuracy was estimated for all available DEMs with reference to the 12,943 GNSS
points. The computed differences were calculated following a “DEM-GNSS” subtraction approach in
all three cases, i.e., ASTER GDEM-GNSS, SRTM DEM-GNSS, and (EU-DEM)-GNSS. For EU-DEM, two
separate evaluations were completed: for the original EU-DEM and for the EU-DEM upgrade (v1.1).
      Histograms (Figures 4 and 5) of the results show that the elevation values of EU-DEM are closer
to the “real” values measured by GNSS. This was quantified in the corresponding descriptive statistics
(Table 1), where mean, standard deviation, and range (min–max) of the values of EU-DEM elevation
errors are considerably better than those of ASTER GDEM and SRTM DEM. Additionally, given
the known non-normality of the differences (residuals) between ground data and DEMs (kurtosis
and skewness), some more robust statistical measures have been included according to Höhle and
Höhle [54], so that the absolute elevation validation is also based on median and Normalized Median
Absolute Deviation (NMAD) values.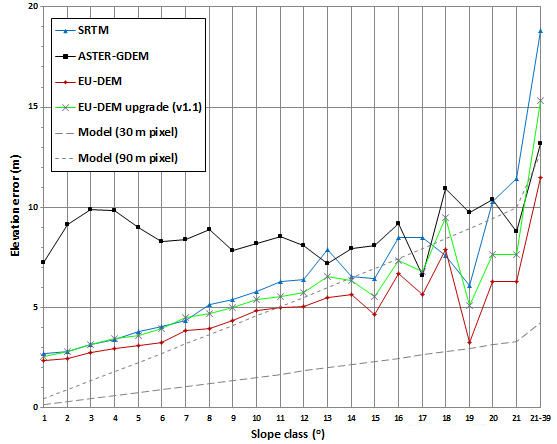
and SD of 7.3 m) at both low and high elevations, but the deviations over rugged terrain and steep
   slopes are generally smaller than those with respect to SRTM DEM. The differences between SRTM
   DEM and ASTER GDEM (Figure 2c) presented a mean value of 4.4 m and a SD of 8.3 m. The result of
   this evaluation is both visually and statistically similar with the EU-DEM-ASTER GDEM
   comparison, verifying that EU-DEM and SRTM data values are overall not too far apart. The
ISPRS Int. J. Geo-Inf. 2019, 8, 108                                                                   8 of 18
   upgraded version of EU-DEM (EU-DEM v1.1) presented significant elevation differences from the
   original version, especially over hilly and mountainous areas, with an overall SD of 2.1 m (Figure 3).

  ISPRS Int. J. Geo-Inf. 2019, 8, x FOR PEER REVIEW                                                     8 of 19

     Figure 2. Elevation comparison by subtraction of corresponding pixel values, between the original
       Figure 2. Elevation comparison by subtraction of corresponding pixel values, between the original
     version of of
       version  EU-DEM
                   EU-DEM(v1), SRTM
                            (v1),    DEM
                                  SRTM DEMandand
                                              ASTER   GDEM
                                                  ASTER   GDEMin the areaarea
                                                                  in the  of interest: (a) (EU-DEM)
                                                                               of interest:           – SRTM
                                                                                            (a) (EU-DEM)  –
     DEM,  (b) (EU-DEM)   – ASTER   GDEM   and (c) SRTM  DEM    – ASTER
       SRTM DEM, (b) (EU-DEM) – ASTER GDEM and (c) SRTM DEM – ASTER GDEM. GDEM.

       Figure
     Figure 3. 3. Elevationcomparison
               Elevation    comparisonby
                                       bysubtraction
                                          subtraction of
                                                      of corresponding
                                                         correspondingpixel
                                                                       pixelvalues,
                                                                             values,between
                                                                                     betweenthethe
                                                                                                 original
                                                                                                   original
       version of EU-DEM (EU-DEMv1) and the upgraded version (EU-DEMv1.1) in the area of interest.
     version of EU-DEM (EU-DEMv1) and the upgraded version (EU-DEMv1.1) in the area of interest.

  4.2. Absolute Elevations
        Absolute vertical accuracy was estimated for all available DEMs with reference to the 12943
  GNSS points. The computed differences were calculated following a “DEM-GNSS” subtraction
  approach in all three cases, i.e., ASTER GDEM-GNSS, SRTM DEM-GNSS, and (EU-DEM)-GNSS. For
  EU-DEM, two separate evaluations were completed: for the original EU-DEM and for the EU-DEM
  upgrade (v1.1).
        Histograms (Figures 4 and 5) of the results show that the elevation values of EU-DEM are closer
  to the “real” values measured by GNSS. This was quantified in the corresponding descriptive
  statistics (Table 1), where mean, standard deviation, and range (min-max) of the values of EU-DEM
  elevation errors are considerably better than those of ASTER GDEM and SRTM DEM. Additionally,
  given the known non-normality of the differences (residuals) between ground data and DEMs
  (kurtosis and skewness), some more robust statistical measures have been included according to
  Höhle and Höhle [54], so that the absolute elevation validation is also based on median and
  Normalized Median Absolute Deviation (NMAD) values.
        Table 1 shows that the EU-DEM upgrade (v1.1) has succeeded in considerably reducing the
  outliers in v1 (reduction in kurtosis and range); however, it is overall somewhat less accurate than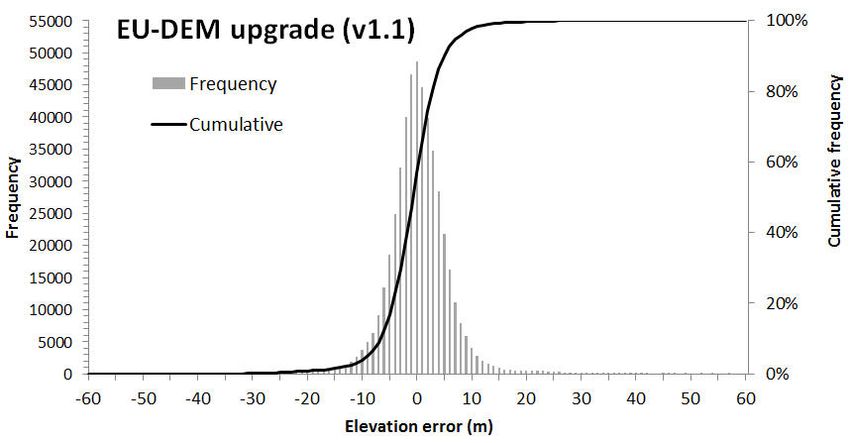
ISPRS Int. J. Geo-Inf. 2019, 8, 108                                                                 9 of 18

ISPRS Int. J. Geo-Inf. 2019, 8, x FOR PEER REVIEW                                                   9 of 19

       Figure4.4.Histograms
      Figure     Histograms of
                            of absolute
                               absolute elevation
                                        elevation errors
                                                  errors for
                                                         for the
                                                             the three
                                                                 three DEMs:
                                                                       DEMs: (a)
                                                                              (a)ASTER-GDEM,
                                                                                 ASTER-GDEM,(b)
                                                                                             (b)SRTM
                                                                                                 SRTM
      DEM and (c) EU-DEM.                    DEM and (c) EU-DEM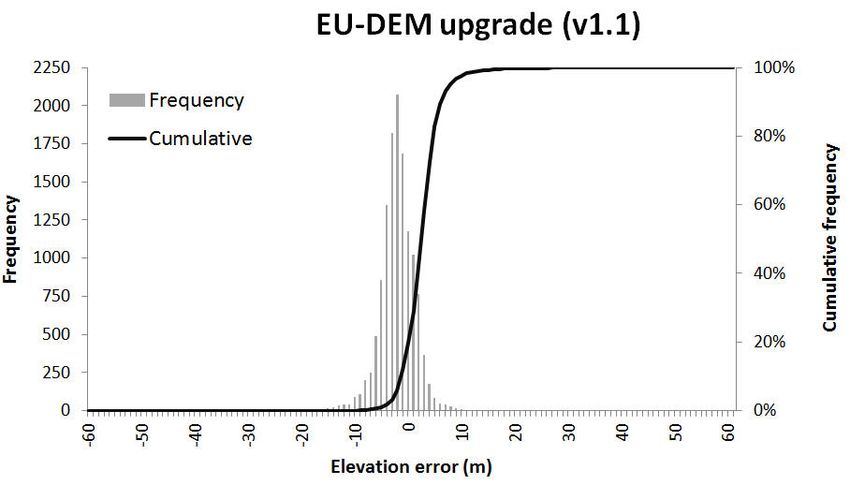
ISPRS Int. J. Geo-Inf. 2019, 8, 108                                                                         10 of 18
ISPRS Int. J. Geo-Inf. 2019, 8, x FOR PEER REVIEW                                                           10 of 19

                Figure 5. Histogram of absolute elevation
                Figure 5.                       elevation errors
                                                          errors for
                                                                 for the
                                                                     the EU-DEM
                                                                         EU-DEM upgrade
                                                                                upgrade (v1.1).
                                                                                         (v1.1).

     Table 1. Absolute elevation errors: descriptive and other statistics for the three evaluated DEMs.
     Table 1. Absolute elevation errors: descriptive and other statistics for the three evaluated DEMs.
     EU-DEM performs significantly better in most of the statistical parameters evaluated.
     EU-DEM performs significantly better in most of the statistical parameters evaluated.
               Statistical Measure         ASTER GDEM    SRTM DEM       EU-DEM     EU-DEM Upgrade (v1.1)
                                                                                                           EU-DE
                    Mean (m)                    −6.8       −2.2          −1.8              −2.6
              Standard Deviation (m)             7.6         ASTER
                                                           4.3           3.6      SRTM      EU-DE
                                                                                           3.4                M
                  Statistical
                    RMSE (m) Measure            10.2       4.8           4.0               4.3 M
                                                             GDEM                 DEM                      upgrad
                  RMSE 95% (m)                  9.1        3.6           3.0               3.4
                  RMSE 90% (m)                  8.5        3.2           2.7               3.0             e (v1.1)
                   Median (m)
                         Mean (m)               −7.8       −2.3 –6.8     −2.0     –2.2     −2.5–1.8          –2.6
          Normalized Median Absolute
                                                 6.8        3.0           2.6               2.7
                Standard     Deviation
              Deviation (NMAD)    (m)     (m)                     7.6              4.3            3.6         3.4
                 (Excess) Kurtosis                0.8       17.4          21.7              7.7
                         RMSE (m)                                10.2              4.8           4.0          4.3
                    Skewness                     0.3         0.4          1.3              −1.2
                     RMSE(m)
                  Maximum      95% (m)           51.6       58.6 9.1      59.3     3.6     10.0 3.0           3.4
                  Minimum    (m)
                     RMSE 90% (m)               −36.6      −59.4 8.5     −27.1     3.2    −33.62.7            3.0
                    Range (m)                    88.2       118           86.4             43.6
          n (number of Median      (m)
                        pixels evaluated)       12,943     12,943–7.8    12,943   –2.3    12,943–2.0         –2.5
     Normalized Median Absolute Deviation
                                                              6.8              3.0          2.6        2.7
     Table 1 shows  (NMAD)(m)
                       that the EU-DEM upgrade (v1.1) has succeeded in considerably reducing the
                  (Excess) in
outliers in v1 (reduction   Kurtosis
                               kurtosis and range); however,0.8               17.4
                                                              it is overall somewhat       21.7
                                                                                      less accurate    7.7the
                                                                                                    than
                      Skewness
original EU-DEM version.                                      0.3              0.4          1.3       –1.2
                   Maximum (m)                               51.6             58.6         59.3       10.0
                   Minimum (m)
4.3. Relative Elevation                                     –36.6             –59.4        –27.1      –33.6
                      Range (m)                              88.2              118         86.4       43.6
     To estimate the relative vertical accuracy, a random selection of 1000 GNSS points from the total
          n (number of pixels evaluated)                    12,943           12,943       12,943     12,943
of 12,943 took place. Relative accuracy was then calculated (Figures 6 and 7, Table 2) on the basis of
almost 500,000 computed elevation differences, i.e., of all possible combinations between the selected
points. The results indicate that, with respect to relative errors, EU-DEM is the most consistent dataset,
4.3. Relative Elevation
but with SRTM DEM being very close in all statistics. ASTER GDEM has significantly larger error
rangeTo  estimate
       and         thedeviation
            standard    relative vertical
                                  values accuracy,
                                          comparedawith
                                                     random   selection
                                                          the other  twoof  1000 GNSS
                                                                         datasets       points
                                                                                   (Table 2). from the total
of 12,943 took place. Relative accuracy was then calculated (Figures 6 and 7, Table 2) on the basis of
almost 500,000 computed elevation differences, i.e., of all possible combinations between the
selected points. The results indicate that, with respect to relative errors, EU-DEM is the most
consistent dataset, but with SRTM DEM being very close in all statistics. ASTER GDEM has
significantly larger error range and standard deviation values compared with the other two datasets
(Table 2).
ISPRS Int. J. Geo-Inf. 2019, 8, 108 11 of 18
ISPRS Int. J. Geo-Inf. 2019, 8, x FOR PEER REVIEW 11 of 19
Figure 6. 6.Histograms
Figure Histogramsofofrelative
relativeelevation
elevationerrors
errorsfor
forthe
thethree
three DEMs: ASTER-GDEM, (b)
DEMs: (a) ASTER-GDEM, (b) SRTM
SRTM
DEM, (c) EU-DEM. DEM, (c) EU-DEM.ISPRS Int. J. Geo-Inf. 2019, 8, 108 12 of 18
ISPRS Int. J. Geo-Inf. 2019, 8, x FOR PEER REVIEW 12 of 19
Figure 7.
Figure Histogram of
7. Histogram of relative
relative elevation
elevation errors
errors for
for the
the EU-DEM
EU-DEM upgrade
upgrade (v1.1).
(v1.1).
Table 2. Relative elevation errors: descriptive and other statistics for the three DEMs under evaluation.
Table 2. Relative elevation errors: descriptive and other statistics for the three DEMs under
EU-DEM performed considerably better in most of the statistical parameters evaluated.
evaluation. EU-DEM performed considerably better in most of the statistical parameters evaluated.
Statistical Measure ASTER GDEM SRTM DEM EU-DEM EU-DEM Upgrade (v1.1)
Mean (m) 0.4 0.3 0.2 0.9 EU-DE
Standard Deviation (m) 11.0 ASTER
6.1 5.3 SRTM EU-DE
5.5 M
Statistical
RMSE (m) Measure 11.0 6.1 5.3 5.6
RMSE 95% (m) 9.5 GDEM
4.6 3.9 DEM 4.1 M upgrad
RMSE 90% (m) 8.6 4.0 3.4 3.6 e (v1.1)
Median (m) 0.4 0.2 0.1 0.7
MeanAbsolute
Normalized Median (m) 0.4 0.3 0.2 0.9
10.4 4.7 4.1 4.2
Standard
Deviation Deviation
(NMAD) (m) (m) 11.0 6.1 5.3 5.5
(Excess) Kurtosis 0.3 3.6 4.7 5.2
RMSE (m)
Skewness 0.0 0.2 11.0 0.0 6.1 0.5 5.3 5.6
RMSE (m)
Maximum 95% (m) 57.8 51.1 9.5 48.1 4.6 57.03.9 4.1
Minimum (m) −54.6 −50.0 −51.4 −38.7
Range (m)90% (m)
RMSE 112.4 101.18.6 99.5 4.0 95.73.4 3.6
n (number ofMedian (m)
pixel differences 0.4 0.2 0.1 0.7
499,500 499,500 499,500 499,500
evaluated)
Normalized Median Absolute Deviation
10.4 4.7 4.1 4.2
(NMAD)(m)
4.4. Slope (Excess) Kurtosis 0.3 3.6 4.7 5.2
Skewness 0.0 0.2 0.0
Irrespective of the elevation at which it occurs, slope is a crucial factor that controls DEM vertical 0.5
Maximum
accuracy [19,23,26,27,55]. (m) to decompose and model
Efforts 57.8 51.1
elevation differences 48.1basis of 57.0
on the aspect
and slope terrainMinimum
classes, to(m) -54.6 in datasets-50.0
overcome the systematic errors such as SRTM,-51.4have already
-38.7
been reported [56–58]. Range (m) 112.4 101.1 99.5 95.7
n To
(number of pixel
investigate differences
this was calculated499,500
evaluated)
aspect, slope from the most 499,500
accurate and 499,500
higher499,500
spatial
resolution available dataset, i.e., from the original version of EU-DEM, which was subsequently
plotted against elevation errors for all other DEMs, together with the modelled DEM errors presented
4.4. Slope [57] (Figure 8).
by Becek
The results show
Irrespective of thethe consistency
elevation of SRTM
at which DEM and
it occurs, slope EU-DEM: elevation
is a crucial factorerrors are smallDEM
that controls and
increase gradually with slope, as expected. This primarily occurs over flat terrain up to
vertical accuracy [19,23,26,27,55]. Efforts to decompose and model elevation differences on the basis slope values of
about 12 ◦ , whereas EU-DEM continues to be very consistent up to 14◦ . ASTER GDEM does not exhibit
of aspect and slope terrain classes, to overcome the systematic errors in datasets such as SRTM, have
this behavior;
already starting [56–58]
been reported at considerably
. higher values, errors tend to decrease or remain at the same
levelToup investigate 16◦ . aspect,
to slopes of this The overall
slope wasofcalculated
bias ASTER GDEM fromisthe
alsomost
evident through
accurate andthe comparison
higher spatial
against the modeled errors for a 30 m DEM.
resolution available dataset, i.e., from the original version of EU-DEM, which was subsequently
plotted against elevation errors for all other DEMs, together with the modelled DEM errors
presented by Becek [57] (Figure 8).
The results show the consistency of SRTM DEM and EU-DEM: elevation errors are small and
increase gradually with slope, as expected. This primarily occurs over flat terrain up to slope values
of about 12°, whereas EU-DEM continues to be very consistent up to 14°. ASTER GDEM does notdeteriorated accuracy with respect to the original EU-DEM version, as expected from the previous
results of absolute elevation evaluation (Table 1). However, for maximum slope values (21°–39°), the
error of EU-DEM v1.1 increases by almost 5 m compared to the respective error of the original
EU-DEM version.
Overall,
ISPRS Int. J. Geo-Inf.the errors
2019, 8, 108 of the original version of EU-DEM are closer to the expected (modelled)
13 of 18
errors for a 30 m DEM.
Figure
Figure 8. Absolute
8. Absolute elevation
elevation errors
errors plotted
plotted against
against slope
slope variations
variations forfor
all all DEMs.
DEMs. TheThe modelled
modelled errors
forerrors
DEMsforwith
DEMs with
pixel pixel
size size
of 30 mofand
30 m
90 and 90 madapted
m were were adapted from Becek
from Becek [57]. [57].
4.5.At
Land Coverslope values (>13◦ ), owing to its higher spatial resolution, ASTER GDEM begins to
higher
exceedSRTM
the accuracy of SRTM
DEM, ASTER GDEM,DEMandin EU-DEM
many cases. Progressively,
are Digital for slope
Surface Models valuessogreater
(DSMs), than 20◦ ,
thus include
ASTER GDEMofpermanently
the elevation exhibits
buildings, trees, higher
and other accuracy
objects, and dothan SRTM DEM.
not necessarily The
refer same
to the doessurface.
ground not occur
between
Consequently, depending on the type of land cover, the actual terrain elevation could be in
ASTER GDEM and EU-DEM, as their elevation values generally remain equally reliable
steep slope areas.by DEMs, even if the measurement itself is accurate.
overestimated
TheTherefore,
upgraded asversion
a last step, robust
(v1.1) statistics,exhibits
of EU-DEM i.e., median (Figure
a rather 9, Table
constant (by3)about
and NMAD
0.5–1m)(Figure 10,
deteriorated
Table 4)with
accuracy of the absolute
respect elevation
to the originalerrors
EU-DEMwereversion,
used in asorder to evaluate
expected from thethe previous
impact ofresults
different land
of absolute
elevation evaluation (Table 1). However, for maximum slope values (21◦ –39◦ ), the error of EU-DEM
v1.1 increases by almost 5 m compared to the respective error of the original EU-DEM version.
Overall, the errors of the original version of EU-DEM are closer to the expected (modelled) errors
for a 30 m DEM.
4.5. Land Cover
SRTM DEM, ASTER GDEM, and EU-DEM are Digital Surface Models (DSMs), so thus include
the elevation of buildings, trees, and other objects, and do not necessarily refer to the ground surface.
Consequently, depending on the type of land cover, the actual terrain elevation could be overestimated
by DEMs, even if the measurement itself is accurate.
Therefore, as a last step, robust statistics, i.e., median (Figure 9, Table 3) and NMAD (Figure 10,
Table 4) of the absolute elevation errors were used in order to evaluate the impact of different land
cover classes on elevation accuracy. Corine Land Cover 2012 datasets were employed for this purpose.better. The upgraded version of EU-DEM (v1.1) is consistently characterized by lower accuracy than
the original version for all land cover classes, but is also of considerably lower accuracy when
compared to SRTM data for almost all land cover classes (apart from wetlands). In forested areas as
well as open spaces with little or no vegetation, EU-DEM v1.1. performs worse than ASTER-GDEM.
The variability in errors in EU-DEM v1.1 was always considerably lower than both SRTM DEM
ISPRS Int. J. Geo-Inf. 2019, 8, 108
and
14 of 18
ASTER-GDEM and occasionally even lower than that of the original version of EU-DEM.
Figure 9. Median
Median of
of absolute
absolute elevation errors plotted against different land cover classes.
Table 3. Median of absolute elevation error values per land cover.
Table 3. Median of absolute elevation error values per land cover.
Median
Land Cover Type Median
ASTER-GDEM SRTM DEM EU-DEM EU-DEM Upgrade (v1.1)
Artificial
Land cover typesurfaces −6.1 −1.1 −0.7 EU-DEM
−1.3
Agricultural areas −8.5 −2.4 −2.1 −2.6
Forests −5.5
SRTM
−4.1 −4.6
upgrade
−6.2
Shrub and/or herbaceous vegetation ASTER-GDEM−5.9 DEM
−3.0 EU-DEM
−1.9 (v1.1)
−3.2
Open Spaces with little or no vegetation −3.6 −0.8 −0.1 −3.7
Artificial surfaces
Wetlands -6.1 3.6 -1.1
−3.8 -0.7
−3.0 -1.3
−3.2
Agricultural ALL areas -8.5 −7.8
ISPRS Int. J. Geo-Inf. 2019, 8, x FOR PEER REVIEW
−2.3
-2.4 −2.0
-2.1 −2.5
-2.6 15 of 19
Forests -5.5 -4.1 -4.6 -6.2
Shrub and/or herbaceous
-5.9 -3.0 -1.9 -3.2
vegetation
Open Spaces with little or no
-3.6 -0.8 -0.1 -3.7
vegetation
Wetlands 3.6 -3.8 -3.0 -3.2
ALL -7.8 -2.3 -2.0 -2.5
Figure
Figure 10. Normalized Median
10. Normalized Median Absolute
Absolute Deviation
Deviation (NMAD)
(NMAD) of
of absolute
absolute elevation
elevation errors
errors plotted
plotted
against different land cover classes.
against different land cover classes.
Table 4. Normalized Median Absolute Deviation (NMAD) of absolute elevation error values per
Table 4. Normalized Median Absolute Deviation (NMAD) of absolute elevation error values per
land cover.
land cover.
NMAD
Land Cover Type
ASTER-GDEM SRTM NMAD
DEM EU-DEM EU-DEM Upgrade (v1.1)
Artificial surfaces 7.8 2.7 2.3 2.3
EU-DEM
Land cover typeareas
Agricultural 6.1 2.8 2.4 2.5
Forests 6.6 SRTM
6.8 5.0 upgrade
5.3
Shrub and/or herbaceous vegetation 7.0
ASTER-GDEM 6.1
DEM 5.0
EU-DEM 5.4
(v1.1)
Open Spaces with little or no vegetation 8.8 4.0 4.0 2.3
Artificial surfaces
Wetlands 7.8 2.6 2.7
1.3 1.02.3 2.3
0.9
ALL 6.8 3.0 2.6 2.6
Agricultural areas 6.1 2.8 2.4 2.5
Forests 6.6 6.8 5.0 5.3
Shrub and/or herbaceous
7.0 6.1 5.0 5.4
vegetation
Open Spaces with little or no
8.8 4.0 4.0 2.3
vegetation
Wetlands 2.6 1.3 1.0 0.9ISPRS Int. J. Geo-Inf. 2019, 8, 108 15 of 18
The results demonstrate that the elevation accuracy of the original version of EU-DEM is higher
than in any other DEM for all land cover classes except for forests, where SRTM performs slightly better.
The upgraded version of EU-DEM (v1.1) is consistently characterized by lower accuracy than the
original version for all land cover classes, but is also of considerably lower accuracy when compared
to SRTM data for almost all land cover classes (apart from wetlands). In forested areas as well as open
spaces with little or no vegetation, EU-DEM v1.1. performs worse than ASTER-GDEM. The variability
in errors in EU-DEM v1.1 was always considerably lower than both SRTM DEM and ASTER-GDEM
and occasionally even lower than that of the original version of EU-DEM.
5. Discussion
The results of this study show that EU-DEM is a product with generally more similarities to
SRTM DEM in terms of elevation values, but closer to ASTER GDEM for slopes greater than 20◦ . Thu,
if restricted to a mountainous area, or steep slopes to be exact, EU-DEM would more approximate
ASTER GDEM rather than SRTM data.
The RMSE of the absolute and relative vertical accuracy of EU-DEM were estimated at 4.0 and
5.3 m, respectively, which are better than SRTM DEM (4.8 m and 6.1 m, respectively) and ASTER
GDEM (10.2 m and 11.0 m, respectively). Additionally, more robust statistics (median and NMAD)
indicate the consistently better performance of EU-DEM. The calculated accuracy applies to the specific
area of interest and is thus of local value, but may diverge considerably in other areas depending on
the type of terrain and slope. To this end, the whole original EU-DEM dataset (i.e., of regional or even
continental value) performs better at both low and high elevations when compared with either SRTM
DEM or ASTER GDEM. With respect to the findings of the previous evaluation of the original version
of EU-DEM in Hungary [37], the RMSE values were found to be considerably lower (4.0 m in this study
versus 6.0 m to 7.8 m in Józsa et al. [37]). When compared to the official validation results [10], the
RMSE values (95%) of this study are somewhat higher than those calculated for Greece (3.0 m in this
study versus 2.0 m in the EU-DEM Statistical Validation Report [10]), but closer to the general accuracy
of EU-DEM v1 south of 60◦ (3.0 m in this study versus 2.2 m in the EU-DEM Statistical Validation
Report [10]) and very close to the overall EU-DEM v1 vertical accuracy (3.0 m in this study versus 2.9
m in the EU-DEM Statistical Validation Report [10]).
Concerning the validation of elevation accuracy against different types of land cover, forests
present the most problematic areas in all DEMs, with the exception of ASTER-GDEM. ASTER-GDEM
has considerably lower accuracy over agricultural areas, which can be linked to its low accuracy over
relatively flat terrain (where most agricultural activity is performed).
The EU-DEM upgrade (v1.1) reduces the overall variability in the elevation errors and suppresses
outliers. However, this has been accompanied by some loss of elevation accuracy with respect to
the original EU-DEM, as indicated by their respective RMSEs of 3.4 m and 3.0 m at 95% confidence.
Therefore, as both versions are the result of the implementation of mathematical formulas and do
not represent original measurements, they ought to be handled with extra care, especially when the
existence of artefacts may have a severe impact (e.g., in hydrological modelling or geomorphological
investigations).
6. Conclusions
In conclusion, EU-DEM is an advancement regarding its combination of spatial resolution and
vertical accuracy, achieved by maintaining the higher resolution of ASTER GDEM and the vertical
accuracy of both SRTM DEM and ASTER GDEM in low and high slope areas, respectively. While
benefiting from the 1 arcsecond spatial resolution of ASTER GDEM, EU-DEM generally follows the
consistency of SRTM DEM for relatively low slope values, whereas it exhibits the accuracy of ASTER
GDEM in steep terrain. Generally, regarding vertical accuracy and spatial resolution, EU-DEM is an
enhanced product, benefiting from both SRTM DEM and ASTER GDEM datasets and meeting the
objectives of its implementation.ISPRS Int. J. Geo-Inf. 2019, 8, 108 16 of 18
Overall, owing to the ever growing need for an accurate description of the global topography
and its changes, the production of modern and (almost) global or regional DEMs is becoming more
frequent, in the form of either primary or secondary products. As these new elevation datasets are
typically becoming more accurate, the validation procedure is also becoming more demanding in
terms of availability, volume, sampling, and accuracy of reliable reference topographic information.
Such information can be relatively easily retrieved with the use of kinematic GNSS surveys, using
dual frequency receivers with hundreds of channels and taking advantage of the GNSS constellations
currently available (GPS, GLONASS, GALILEO, and BEIDOU).
As a consequence, part of future research on DEM validation should focus both on the accuracy
assessment of more DEMs as they are being made available to the scientific community, but also
on providing appropriate reference datasets for assessing the reliability and limitations of new and
popular topographic products.
Author Contributions: Conceptualization, A.M.; Data curation, A.M. and D.A.; Methodology, A.M. and D.A.;
Visualization, A.M.; Writing—original draft, A.M.; Writing—review & editing, A.M. and D.A.
Funding: This research received no external funding.
Acknowledgments: The European Union Digital Elevation Model was downloaded and adapted as produced
using Copernicus data and information funded by the European Union EU-DEM layers, with no modifications.
ASTER GDEM is a product and property of METI (Ministry of Economy, Trade and Industry of Japan) and NASA.
Colleagues at the European Environment Agency (EEA) are gratefully acknowledged for providing details, as
well as related documents concerning the production and statistical validation of EU-DEM. Last but not least, the
authors would also like to thank the anonymous referees, for significantly improving the final form of this article
with their constructive comments and suggestions.
Conflicts of Interest: The authors declare no conflict of interest.
References
1. Farr, T.G.; Kobrick, M. Shuttle radar topography mission produces a wealth of data. Eos 2000, 81, 583–585.
[CrossRef]
2. Meyer, D.; Tachikawa, T.; Kaku, M.; Iwasaki, A.; Gesch, D.; Oimoen, M.; Zhang, Z.; Danielson, J.;
Krieger, T.; Curtis, B.; et al. Summary for Policymakers. In Climate Change 2013—The Physical Science
Basis; Intergovernmental Panel on Climate Change, Ed.; Cambridge University Press: Cambridge, UK, 2011;
pp. 1–30. ISBN 9788578110796.
3. ASTER Global DEM Validation Summary Report. Available online: https://lpdaac.usgs.gov/sites/default/
files/public/aster/docs/ASTER_GDEM_Validation_Summary_Report.pdf (accessed on 4 January 2014).
4. Tachikawa, T.; Hato, M.; Kaku, M.; Iwasaki, A. Characteristics of ASTER GDEM version 2. In Proceedings of
the International Geoscience and Remote Sensing Symposium (IGARSS), Vancouver, BC, Canada, 24–29 July
2011; pp. 3657–3660.
5. Massonnet, D.; Elachi, C. High-resolution land topography. C. R. Geosci. 2006, 338, 1029–1041. [CrossRef]
6. ALOS Global Digital Surface Model “ALOS World 3D—30m (AW3D30)”. Available online: https://www.
eorc.jaxa.jp/ALOS/en/aw3d30/index.htm (accessed on 24 January 2019).
7. Airbus—Elevation Models. Available online: http://www.astrium-geo.com/worlddem (accessed on
30 December 2018).
8. Lidar Surface Topography (LIST). Available online: https://eospso.nasa.gov/missions/lidar-surface-
topography (accessed on 24 January 2019).
9. EU-DEM. Available online: http://www.eea.europa.eu/data-and-maps/data/eu-dem (accessed on
3 January 2015).
10. EU-DEM Statistical Validation Report. Available online: http://land.copernicus.eu/user-corner/technical-
library (accessed on 5 May 2015).
11. EU-DEM v1.1. Available online: https://land.copernicus.eu/imagery-in-situ/eu-dem/eu-dem-v1.1?tab=
metadata (accessed on 30 December 2018).
12. Denker, H. Evaluation of SRTM3 and GTOPO30 Terrain Data in Germany. Gravity Geoid Space Mission. 2005,
129, 218–223. [CrossRef]ISPRS Int. J. Geo-Inf. 2019, 8, 108 17 of 18
13. Hirt, C.; Filmer, M.S.; Featherstone, W.E. Comparison and validation of the recent freely available
ASTER-GDEM ver1, SRTM ver4.1 and GEODATA DEM-9s ver3 digital elevation models over Australia.
Aust. J. Earth Sci. 2010, 57, 337–347. [CrossRef]
14. Paul, D.; Mandla, V.R.; Singh, T. Quantifying and modeling of stream network using digital elevation models.
Ain Shams Eng. J. 2017, 8, 311–321. [CrossRef]
15. Rodríguez, E.; Morris, C.S.; Belz, J.E. A Global Assessment of the SRTM Performance. Photogramm. Eng.
Remote Sens. 2006, 72, 249–260. [CrossRef]
16. Tachikawa, T.; Kaku, M.; Iwasaki, A. ASTER GDEM Version 2 Validation Report. In Proceedings of the
International Geoscience and Remote Sensing Symposium, Vancouver, BC, Canada, 24–29 July 2011; pp. 1–24.
17. Foumelis, M.; Chalkias, C.; Plank, S. Influence of Satellite Imaging Geometry on ASTER and SRTM Global
Digital Elevation Models. In Proceedings of the 10th International Congress of the Hellenic Geographical
Society, Thessaloniki, Greece, 22–24 October 2014; Mouratidis, A., Ed.; Hellenic Geographical Society:
Thessaloniki, Greece, 2014; pp. 275–286.
18. Miliaresis, G.C.; Paraschou, C.V.E. An evaluation of the accuracy of the ASTER GDEM and the role of stack
number: A case study of Nisiros Island, Greece. Remote Sens. Lett. 2011, 2, 127–135. [CrossRef]
19. Miliaresis, G.C.; Paraschou, C.V.E. Vertical accuracy of the SRTM DTED level 1 of Crete. Int. J. Appl. Earth
Obs. Geoinf. 2005, 7, 49–59. [CrossRef]
20. Weydahl, D.J.; Sagstuen, J.; Dick, B.; Rønning, H. SRTM DEM accuracy assessment over vegetated areas in
Norway. Int. J. Remote Sens. 2007, 28, 3513–3527. [CrossRef]
21. Helm, A.; Braun, A.; Eickschen, S.; Schöne, T. Calibration of the shuttle radar topography mission X-SAR
instrument using a synthetic altimetry data model. Can. J. Remote Sens. 2002, 28, 573–580. [CrossRef]
22. Sun, G.; Ranson, K.J.; Kharuk, V.I.; Kovacs, K. Validation of surface height from shuttle radar topography
mission using shuttle laser altimeter. Remote Sens. Environ. 2003, 88, 401–411. [CrossRef]
23. Gorokhovich, Y.; Voustianiouk, A. Accuracy assessment of the processed SRTM-based elevation data by
CGIAR using field data from USA and Thailand and its relation to the terrain characteristics. Remote Sens.
Environ. 2006, 104, 409–415. [CrossRef]
24. Bulatović, V.; Sušić, Z.; Ninkov, T. Estimate of the ASTER GDEM regional systematic errors and their removal.
Int. J. Remote Sens. 2012, 33, 5915–5926. [CrossRef]
25. Li, P.; Shi, C.; Li, Z.; Muller, J.P.; Drummond, J.; Li, X.; Li, T.; Li, Y.; Liu, J. Evaluation of ASTER GDEM using
GPS benchmarks and SRTM in China. Int. J. Remote Sens. 2013, 34, 1744–1771. [CrossRef]
26. Mouratidis, A.; Briole, P.; Katsambalos, K. SRTM 3” DEM (versions 1, 2, 3, 4) validation by means of extensive
kinematic GPS measurements: A case study from North Greece. Int. J. Remote Sens. 2010, 31, 6205–6222. [CrossRef]
27. Rodriguez, E.; Morris, C.S.; Belz, J.E.; Chapin, E.C.; Martin, J.M.; Daffer, W.; Hensley, S. An Assessment of the
SRTM Topographic Products; Technical Report JPL D-31639; JPL, NASA: Pasadena, CA, USA, 2005.
28. Werner, M. Shuttle Radar Topography Mission (SRTM) mission overview. Frequenz 2001, 55, 75–79. [CrossRef]
29. Rabus, B.; Eineder, M.; Roth, A.; Bamler, R. The shuttle radar topography mission—A new class of digital
elevation models acquired by spaceborne radar. ISPRS J. Photogramm. Remote Sens. 2003, 57, 241–262. [CrossRef]
30. Farr, T.G.; Rosen, P.A.; Caro, E.; Crippen, R.; Duren, R.; Hensley, S.; Kobrick, M.; Paller, M.; Rodriguez, E.;
Roth, L.; et al. The shuttle radar topography mission. Rev. Geophys. 2007, 45, RG2004. [CrossRef]
31. Mukul, M.; Srivastava, V.; Jade, S.; Mukul, M. Uncertainties in the Shuttle Radar Topography Mission (SRTM)
Heights: Insights from the Indian Himalaya and Peninsula. Sci. Rep. 2017, 7, 41672. [CrossRef] [PubMed]
32. ASTER Global Digital Elevation Model Version 2—Summary of Validation Results. Available
online: https://ssl.jspacesystems.or.jp/ersdac/GDEM/ver2Validation/Summary_GDEM2_validation_
report_final.pdf (accessed on 2 February 2019).
33. Varga, M.; Bašić, T. Accuracy validation and comparison of global digital elevation models over Croatia.
Int. J. Remote Sens. 2015, 36, 170–189. [CrossRef]
34. Mouratidis, A. Contribution of—GPS and GIS—Assisted Spaceborne Remote Sensing in the Morphotectonic Research
of Central Macedonia (Northern Greece); Aristotle University of Thessaloniki: Thessaloniki, Greece, 2010.
35. Copernicus Land Monitoring Service—Reference Data: EU-DEM. Available online: https://land.copernicus.
eu/user-corner/publications/eu-dem-flyer/view (accessed on 2 January 2019).
36. EU-DEM Upgrade Documentation EEA User Manual. Available online: https://land.copernicus.eu/user-
corner/technical-library/eu-dem-v1-1-user-guide (accessed on 2 January 2019).ISPRS Int. J. Geo-Inf. 2019, 8, 108 18 of 18
37. Józsa, E.; Fábián, S.Á.; Kovács, M. An evaluation of EU-DEM in comparison with ASTER GDEM, SRTM and
contour-based DEMs over the Eastern Mecsek Mountains. Hung. Geogr. Bull. 2014, 63, 401–423. [CrossRef]
38. Jarvis, A.; Reuter, H.I.; Nelson, A.; Guevara, E. Hole-Filled SRTM for the Globe Version 4, available from the
CGIAR-CSI SRTM 90m Database. Available online: http://srtm.csi.cgiar.org (accessed on 4 January 2019).
39. Lemoine, F.G.; Kenyon, S.C.; Factor, J.K.; Trimmer, R.G.; Pavlis, N.K.; Chinn, D.S.; Cox, C.M.; Klosko, S.M.;
Luthcke, S.B.; Torrence, M.H.; et al. The NASA GSFC and NIMA Joint Geopotential Model. Available online:
https://ntrs.nasa.gov/archive/nasa/casi.ntrs.nasa.gov/19980218814.pdf (accessed on 4 January 2019).
40. Mouratidis, A.; Albanakis, K. Hypsometric changes near Kavallari based on multi-temporal DEMs and
extensive GNSS measurements. In Proceedings of the 9th Geographical Conference of Greece, Athens,
Greece, 4–6 November 2010; pp. 116–123.
41. Altamimi, Z.; Collilieux, X.; Legrand, J.; Garayt, B.; Boucher, C. ITRF2005: A new release of the International
Terrestrial Reference Frame based on time series of station positions and Earth Orientation Parameters.
J. Geophys. Res. Solid Earth 2007, 112. [CrossRef]
42. CORINE Land Cover/CLC 2012. Available online: https://land.copernicus.eu/pan-european/corine-land-
cover/clc-2012?tab=download (accessed on 4 January 2019).
43. ITRS and WGS84. Available online: ftp://itrf.ensg.ign.fr/pub/itrf/WGS84.TXT (accessed on 4 January 2019).
44. Boucher, C.; Altamimi, Z. Specifications for Reference Frame Fixing in the Analysis of a EU-REF GPS
Campaign. Available online: http://etrs89.ensg.ign.fr/memo-V7.pdf (accessed on 4 January 2019).
45. Augath, W.; Ihde, J. EUREF Permanent GNSS Network—ETRF/ITRF Transformation. Available online:
http://www.epncb.oma.be/_productsservices/coord_trans/index.php (accessed on 4 January 2019).
46. Gruber, T. Evaluation of the EGM08 Gravity Field by Means of GPS-Levelling and Sea Surface Topography
Solutions. Available online: https://mediatum.ub.tum.de/doc/1368753/file.pdf (accessed on 28 February 2019).
47. Kotsakis, C.; Katsambalos, K. Quality Analysis of Global Geopotential Models at 1542 GPS/levelling
Benchmarks over the Hellenic Mainland. Surv. Rev. 2010, 42, 327–344. [CrossRef]
48. Rizos, C.; Grejner-Brzezinska, D. Geodesy and Surveying. In GNSS Applications and Methods; Gleason, S.,
Gebre-Egziabher, D., Eds.; Artech House: Boston, MA, USA, 2009; pp. 347–380. ISBN 9781596933293.
49. Weikko, A.H.; Moritz, H. Physical Geodesy; W. H. Freeman and Company: San Francisco, CA, USA, 1967.
50. EGM2008—WGS 84 Version. Available online: Earth-info.nga.mil/GandG/wgs84/gravitymod/egm2008/
egm08_wgs84.html (accessed on 4 January 2019).
51. Kotsakis, C.; Katsambalos, K.; Ampatzidis, D.; Gianniou, M. Evaluation of EGM08 Using GPS and Leveling
Heights in Greece. In International Association of Geodesy Symposia; Springer: Cham, Switzerland, 2010;
Volume 135, pp. 481–488.
52. Pavlis, N.K.; Holmes, S.A.; Kenyon, S.C.; Factor, J.K. The development and evaluation of the Earth
Gravitational Model 2008 (EGM2008). J. Geophys. Res. 2012, 117, B04406. [CrossRef]
53. Vergos, G.S.; Grigoriadis, V.N.; Tziavos, I.N.; Kotsakis, C. Evaluation of GOCE/GRACE Global Geopotential
Models over Greece with Collocated GPS/Levelling Observations and Local Gravity Data. In Gravity, Geoid
and Height Systems; Marti, U., Ed.; Springer: Cham, Switzerland, 2014; pp. 85–92.
54. Höhle, J.; Höhle, M. Accuracy assessment of digital elevation models by means of robust statistical methods.
ISPRS J. Photogramm. Remote Sens. 2009, 64, 398–406. [CrossRef]
55. Frey, H.; Paul, F. On the suitability of the SRTM DEM and ASTER GDEM for the compilation of: Topographic
parameters in glacier inventories. Int. J. Appl. Earth Obs. Geoinf. 2012, 18, 480–490. [CrossRef]
56. Miliaresis, G.C. The landcover impact on the aspect/slope accuracy dependence of the SRTM-1 elevation
data for the humboldt range. Sensors 2008, 8, 3134–3149. [CrossRef] [PubMed]
57. Becek, K. Investigating error structure of shuttle radar topography mission elevation data product. Geophys.
Res. Lett. 2008, 35. [CrossRef]
58. Becek, K. Assessing global digital elevation models using the runway method: The advanced spaceborne
thermal emission and reflection radiometer versus the shuttle radar topography mission case. IEEE Trans.
Geosci. Remote Sens. 2014, 52, 4823–4831. [CrossRef]
© 2019 by the authors. Licensee MDPI, Basel, Switzerland. This article is an open access
article distributed under the terms and conditions of the Creative Commons Attribution
(CC BY) license (http://creativecommons.org/licenses/by/4.0/).You can also read


