A European lightning density analysis using 5 years of ATDnet data
←
→
Page content transcription
If your browser does not render page correctly, please read the page content below
Natural Hazards

                                                                                                                Open Access
Nat. Hazards Earth Syst. Sci., 14, 815–829, 2014
www.nat-hazards-earth-syst-sci.net/14/815/2014/
doi:10.5194/nhess-14-815-2014                                                      and Earth System
© Author(s) 2014. CC Attribution 3.0 License.                                              Sciences

A European lightning density analysis using 5 years of ATDnet data
G. Anderson and D. Klugmann
Met Office, FitzRoy Road, Exeter, EX1 2HR, UK

Correspondence to: G. Anderson (graeme.anderson@metoffice.gov.uk)

Received: 27 August 2013 – Published in Nat. Hazards Earth Syst. Sci. Discuss.: 4 December 2013
Revised: 2 November 2013 – Accepted: 21 February 2014 – Published: 11 April 2014

Abstract. The Met Office has operated a very low frequency       as EUCLID (European Cooperation for Lightning Detection)
(VLF) lightning location network since 1987. The long-range      (Schulz and Diendorfer, 2002). The LINET (Lightning de-
capabilities of this network, referred to in its current form    tection Network) VLF (very low frequency, 3–30 kHz)/LF
as ATDnet, allow for relatively continuous detection effi-       LLS, developed at the University of Munich and operated
ciency across Europe with only a limited number of sensors.      by nowcast, is also capable of providing extensive coverage
The wide coverage and continuous data obtained by Arrival        of much of central Europe (Betz et al., 2009).
Time Differing NETwork (ATDnet) are here used to create             An alternative approach to lightning detection is to de-
data sets of lightning density across Europe. Results of an-     tect sferics using a much lower frequency range, i.e. the very
nual and monthly detected lightning density using data from      low frequency range, in which radio signals propagate over
2008–2012 are presented, along with more detailed analy-         the horizon in the waveguide created by the Earth and iono-
sis of statistics and features of interest. No adjustment has    sphere, in order to create a “long-range” network. Only a
been made to the data for regional variations in detection ef-   small number of such long-range networks exist at the time
ficiency.                                                        of writing, including the University of Washington WWLLN
                                                                 (Worldwide Lightning Location Network) system (Jacobson
                                                                 et al., 2006), the Vaisala GLD360 (Global Lightning Dataset
                                                                 360) system (Said et al., 2010), the National Observatory of
1   Introduction                                                 Athens ZEUS network (Lagouvardos et al., 2009), and the
                                                                 ATDnet system operated by the Met Office.
The use of lightning location systems (LLS) across Eu-
rope and the wider world for operational meteorology and         Lightning detection at the Met Office
research purposes is well established. Lightning data are
used daily for observing the development and progres-            The Met Office has operated its own VLF lightning location
sion of storms, and also in research projects (such as the       network since 1987 (Lee, 1986). The system has developed
HyMeX (Hydrological Cycle in the Mediterranean Experi-           considerably during its operational life, and the most recent
ment) project, Ducrocq (2013)) in order to gain a better un-     version – ATDnet (Arrival Time Differencing NETwork) –
derstanding of the processes taking place within storms.         was introduced in 2007 (Gaffard et al., 2008).
   Most European countries operate a lightning location sys-        ATDnet takes advantage of the long propagation paths of
tem. The majority use relatively dense networks of low fre-      the VLF sferics emitted by lightning discharges, which prop-
quency (LF, 30–300 kHz)/very high frequency (VHF, 30–            agate over the horizon via interactions with the ionosphere.
300 MHz) sensors to detect the “sferic” (radio atmospheric)      ATDnet predominantly detects sferics created by cloud-to-
signals emitted by lightning. These types of network provide     ground (CG) strokes, as the energy and polarisation of sfer-
high detection efficiency (DE) and location accuracy (LA),       ics created by CG return strokes mean that they can travel
but are generally limited in range outside of the area en-       more efficiently in the Earth-ionosphere waveguide, and so
closed by the network of sensors. However, the current use       are more likely to be detected at longer ranges than typical
of sensors primarily from a single provider allows for cross-    inter-/intracloud (IC) discharges. The benefit of longer-range
border coverage via cooperation within organisations such        relative to higher-frequency networks is obtained with lower

Published by Copernicus Publications on behalf of the European Geosciences Union.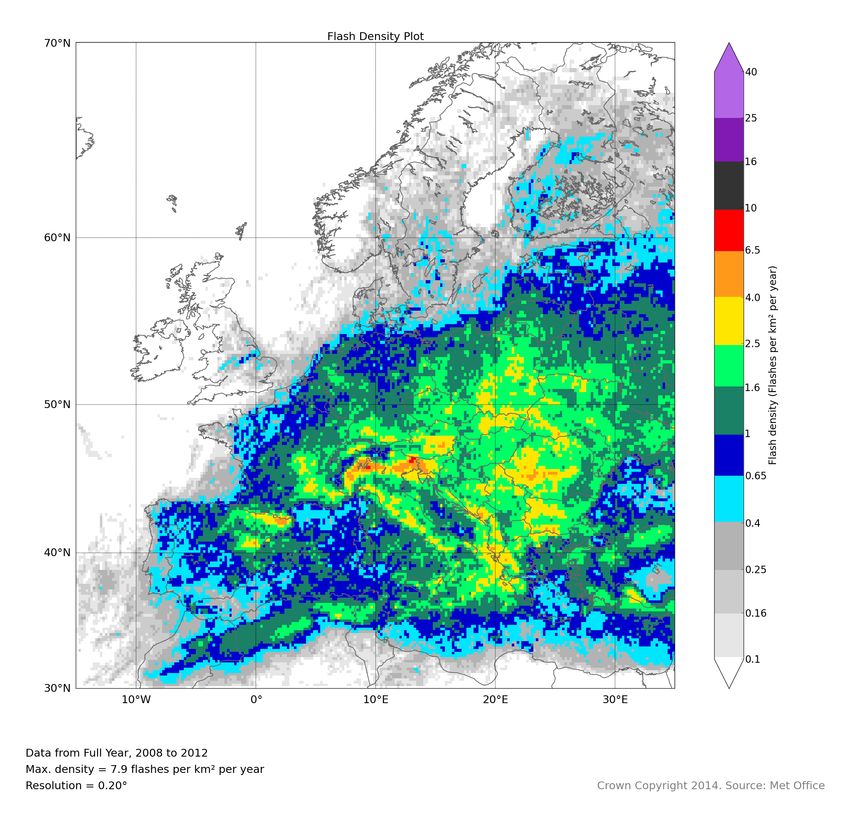
816                                           G. Anderson and D. Klugmann: European lightning density using ATDnet data

Fig. 1. The locations of ATDnet sensors that contribute to the oper-
ations network (red dots), and development outstations (blue dots).

location accuracy: ATDnet location uncertainties within the
region enclosed by the network of sensors are of the order of
a few kilometres, as opposed to a few hundred metres possi-            Fig. 2. Estimated European flash density obtained using data from
ble with LF/VHF and VLF/LF systems. The location uncer-                the OTD and LIS satellites.
tainty of ATDnet makes it suitable for identifying electrically
active cells.
   One key advantage of the ATDnet approach, however, is               the whole continent. Assessments of lightning climatology
the ability to provide relatively continuous coverage over             have been carried out at a regional level, however, including
much of Europe, using only a very limited number of sensors.           analysis covering southern Germany (Finke and Hauf, 1996),
The ATDnet system consists of 11 sensors (referred to as               Austria (Schulz et al., 2005), Iberia (Soriano et al., 2005),
outstations) that regularly contribute to the “operational net-        Finland (Mäkelä et al., 2011) and Romania (Antonescu and
work”, plus sensors distributed further afield, designated “de-        Burcea, 2010).
velopment outstations”. The locations and statuses of these               Lightning density has previously been measured over the
sensors, as of May 2013, are shown in Fig. 1. Coverage ex-             entirety of Europe using the satellite-borne Optical Tran-
tends over regions of open water (e.g. the North Sea, the              sient Detector, or OTD (Christian et al., 2003), onboard the
Mediterranean), where the use of short-range networks is               Orbview-1/Microlab satellite. This instrument operated be-
limited by the lack of available sensor sites.                         tween 1995 and 2000, and was the predecessor to the Light-
                                                                       ning Imaging Sensor, or LIS (Christian et al., 1999), of the
European lightning density                                             Tropical Rainfall Measuring Mission (TRMM) satellite. One
                                                                       key difference between the two systems was that the OTD’s
For continental regions with few large bodies of open wa-              orbit allowed it to detect lightning at higher latitudes: the
ter, the use of short-range systems still allows for contin-           OTD could detect lightning between 75◦ N and 75◦ S lat-
uous coverage. This has been used to provide good-quality              itude, whereas the LIS can only detect as far north as the
lightning data across the entire contiguous United States us-          southern Mediterranean (38◦ N).
ing the National Lightning Detection Network (NLDN) for                   The orbital characteristics of the OTD only allowed for
many years. An interesting use for this data has been to pro-          observations at any point on the Earth’s surface for a few
vide continent-wide maps of lightning density, so that annual          minutes per day. This meant that, by using data obtained
or monthly characteristics of the distribution of lightning can        over long periods of time, the lightning density could be esti-
be analysed, as in Holle et al. (2010).                                mated by assuming that the observed flash rate during a num-
   Due to the more fragmented nature of landmasses within              ber of satellite overpasses was representative of the average
Europe, the use of short-range networks to provide contin-             rate for that location. Figure 2 shows the flash density esti-
uous Europe-wide lightning data density maps is less fea-              mation obtained using this technique. The lack of continual
sible, as European seas would lead to decreased detection              observations, and the variable nature of storms, would how-
efficiency and inhomogeneous coverage that would be dif-               ever mean that the lightning densities estimated from this ap-
ficult to account for. Furthermore, the European regions are           proach would be unlikely to accurately match the true light-
covered by a multitude of different national meteorological            ning density.
services, each with their own needs and priorities, making
it difficult to create a single, homogenous network covering

Nat. Hazards Earth Syst. Sci., 14, 815–829, 2014                                www.nat-hazards-earth-syst-sci.net/14/815/2014/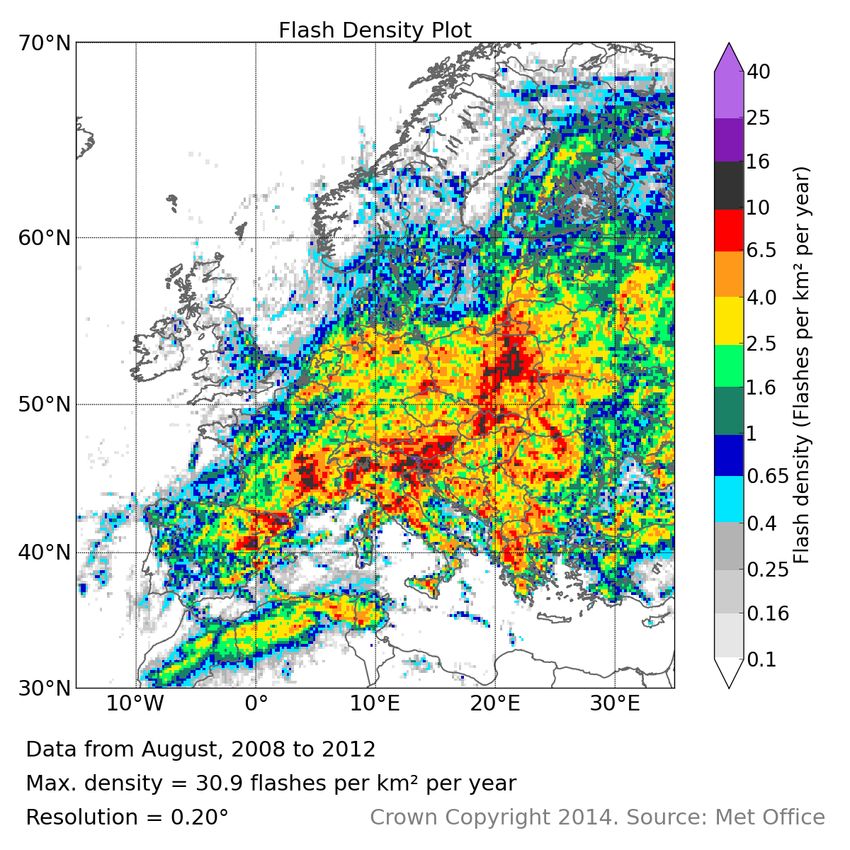
G. Anderson and D. Klugmann: European lightning density using ATDnet data                                                       817

   This paper aims to provide an analysis of Europe-wide               Because of the inability to distinguish between IC and
lightning data using relatively continuous coverage provided        CG discharges, the data presented here can be interpreted
by the ATDnet system. The approach of Holle et al. (2010)           as “lightning density”, as opposed to “flash density”, a term
in using data from the NLDN to analyse lightning density in         which in the past has been used to specifically refer to CG-
the US for each month in turn was used as a template.               only density. It is, however, useful to refer to the fix data
   Section 2 describes the approach used in developing the          correlated together into events using time and space criteria
lightning density data for Europe. Section 3 looks at the an-       as “flashes”, to indicate the fact that these are merged events,
nual and monthly lightning densities recorded by ATDnet,            despite the fact that this flash data may include IC discharges.
along with some further analysis of some features of inter-            The flash density values obtained would be expected to be
est. Section 4 analyses some of the statistics of the observed      lower than the values detected by OTD (Fig. 2). The satellite
lightning data. Section 5 provides a discussion of the results,     detector would be expected to have a high IC detection effi-
and Sect. 6 concludes the study.                                    ciency, while also being capable of detecting CG flashes with
                                                                    sufficient vertical extent that the cloud top would be visibly
2     Method                                                        illuminated.

2.1    ATDnet data                                                  2.2   Flash density

In order to create plots that represent the average distribution    The key component of this study was to process the data from
of monthly lightning density as closely as possible, several        its original format into grids of lightning flash density. The
years’ worth of continuous data were required. ATDnet is            first step was to convert ATDnet “fixes” into “flashes”. ATD-
suitable for this purpose, since it runs as an operational net-     net strokes were converted into flashes using the approach
work with very little downtime. Due to modifications to the         derived from that presented by Drüe et al. (2007). Individ-
network when it was re-launched as ATDnet (as opposed to            ual fixes were compared against each other using spatial and
the previous system, simply known as “ATD”), data prior to          temporal criteria. Fixes could then be matched together into
2008 were not included. As such, 5 years of lightning data          a single flash if these criteria were met. In this flash correla-
from the period 2008–2012 were used to create the density           tion algorithm, no maximum inter-stroke separation time was
plots.                                                              used.
   Note that occasional sensor or network outages would af-            Figure 3 shows the effect of using correlation ranges be-
fect the density data; however, such outages are rare, and the      tween 5 and 75 km between flashes, using a constant maxi-
density of ATDnet sensors is high enough to provide some            mum flash duration of 1 s. The initial drop in the number of
level of redundancy. The length of time from which the data         flashes at low ranges would be due to fixes from the same
have been taken means that the plots provided in this paper         flash being correctly correlated together. At larger ranges,
can be used as a useful guide to relative intensities. Further,     the continuing decrease would be more likely to be caused
no adjustment has been made to the data to account for de-          by incorrect correlations of fixes from discharges that were
tection efficiency of flashes.                                      detected within a second of each other, but were not part of
   The length of the data period is suitable for smoothing out      the same flash.
the effect of individual storms in most regions, particularly          When creating the flash density plots for this study, ATD-
during the summer months, when the majority of storms oc-           net fixes that occurred within 20 km of and within 1 s af-
cur. The effects of unusually strong winter storms, or partic-      ter another fix (dt ≤ 1 s, dx ≤ 20 km) were grouped together
ularly early/late storms in the usual storm season, are still no-   as a single flash. The range criteria used are more relaxed
ticeable in some plots. These effects do not detract from the       than those used by some other networks, e.g. the US NLDN
overall usefulness of the plots themselves, but are an interest-    (Cummins et al., 1998). These criteria should capture the ma-
ing effect that will be discussed later. No spatial smoothing       jority of fixes that occur within spatially extensive flashes,
(beyond gridding the data) was carried out on the data.             or strokes within the same flash where the error on one or
   As mentioned in the Introduction, the long-range nature          more of the strokes were mislocated by a few kilometres.
of ATDnet is such that it predominantly detects CG strokes,         This range should however be less than the separation be-
as the VLF sferics emitted by CG strokes are generally              tween storm clouds, meaning that it would be rare that coin-
more intense than the sferics emitted by cloud discharges.          cident flashes from separate storms would be correlated to-
ATDnet does however detect some more powerful IC dis-               gether by chance. Figure 2 of Drüe et al. (2007) indicates
charges, but does not distinguish between IC and CG events.         that, although the majority of fixes within a flash are likely
As such, the lightning density plots produced here will be          to be within 10 km of each other, sources in excess of 20 km
similar to the CG flash distribution of Europe, but the ef-         are still possible from the same flash. Given the 5 km average
fect of IC discharges in the density could potentially lead to      location uncertainty of ATDnet at the limits of Europe, these
densities in the data presented that are higher than the true       time and space correlation criteria seem justified.
CG flash density.

www.nat-hazards-earth-syst-sci.net/14/815/2014/                              Nat. Hazards Earth Syst. Sci., 14, 815–829, 2014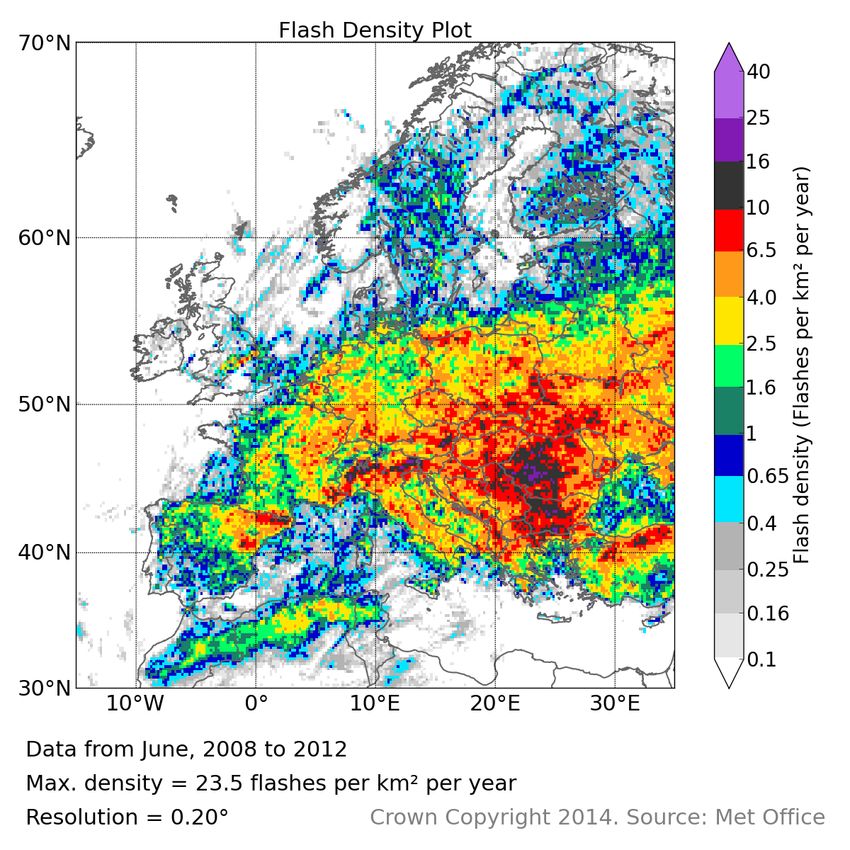
818                                            G. Anderson and D. Klugmann: European lightning density using ATDnet data

                                                                           No correction has been made to the data for spatial vari-
                                                                        ations in the detection efficiency of ATDnet. Although the
                                                                        detection efficiency will vary slightly due to differences in
                                                                        the distance from a stroke to the nearest four ATDnet sensors
                                                                        required to locate a fix, as of yet no model has been created
                                                                        to quantitatively account for this effect. No published, peer-
                                                                        reviewed, Europe-wide assessment of ATDnet detection ef-
                                                                        ficiency has yet been made, although assessments of detec-
                                                                        tion efficiency within France using data from a VHF Light-
                                                                        ning Mapping Array are in progress. An internal report on
                                                                        the capabilities of ATDnet in Finland (towards the limits of
                                                                        ATDnet detection capabilities in Europe) suggests a diurnally
                                                                        averaged CG flash detection efficiency of 50 %, which can
                                                                        be used an an approximate lower limit for ATDnet flash DE
                                                                        across Europe.
                                                                           A logarithmic scale was used for plotting, as the lightning
                                                                        flash density varies widely across Europe. Some regions, par-
                                                                        ticularly in central Europe and around the Mediterranean, are
Fig. 3. Flashes created using different correlation ranges for group-   well known to experience significant numbers of storms each
ing fixes using data from 2012. A maximum flash duration was set        year. On the other hand, the cold seas to the north of the UK
at 1 s.
                                                                        experience very little lightning compared with the rest of Eu-
                                                                        rope. The logarithmic scale allowed for lightning data from
The location and time of the first fix in the group of fixes            across the whole of Europe to be visualised in a single plot.
were used as the location and time of the flash.
   Having created a new data set of flashes, density arrays             3     Flash density analysis
could be created. The density in each point of the array cor-
responds to the lightning density within a box of set lat-              The analysis of the density plots will be divided into sections
itude/longitude dimensions. The domain used covers 30–                  for the whole year, each calendar month, followed by a closer
70◦ N and 15◦ W–35◦ E. After some testing, a resolution of 5            analysis of some regions of interest.
boxes per degree of latitude/longitude was chosen. This cor-
responds to box dimensions of approximately 22 km × 14 km               3.1    Annual lightning density
at 50◦ N. This allowed for the resolving of features such as
mountain ranges, large valleys and coastal effects, without             A total of 91 656 076 fixes were detected by ATDnet across
the plots becoming too “noisy” due to the effects of indi-              the defined region of Europe from January 2008 to Decem-
vidual, localised storms. The box size is also much larger              ber 2012. Using the flash correlation algorithm, these were
than the anticipated location uncertainty of ATDnet within              grouped into 59 061 985 flashes, giving an average multiplic-
Europe.                                                                 ity of 1.55. The average flash densities observed between
   Diendorfer (2008) suggests that, in order for measured               1 January 2008 and 31 December 2012 are shown in Fig. 4.
lightning density to reflect the true lightning density within             The annual flash densities detected across Europe are gen-
a grid box to an uncertainty of at most 20 %, the number of             erally of the order of 0.1–4 flashes per km2 per year, a
events per grid box should be 80 or more. Using 5 boxes per             broadly similar range to that observed by Holle et al. (2010)
degree leads to a box size range of around 419 km2 in the               for the northern and western contiguous United States. Peak
south to 166 km2 in the north. This means that densities in             densities in Europe of less than 8 flashes per km2 per year are
the annual data of greater than approximately 0.1 flashes per           less than the peak values observed in Florida (over 14 flashes
km2 per year are likely to be accurate to within 20 %.                  per km2 per year), however larger sources of heat and mois-
   The numbers of flashes in each box for each month over               ture, and the physical arrangement of the Florida Peninsula
the 5-year period were counted. This value was then divided             itself, make it particularly susceptible to lightning activity.
by the number of days counted over, and the area of each lat-              Over the UK, Ireland and Scandinavia the densities are
itude/longitude box, then multiplied by 365.25 to give con-             generally lower than the rest of Europe. Some of the lowest
sistent units of flashes per km2 per year. Strictly, as the units       densities are observed over the Atlantic, North Sea and Baltic
take the form of events per unit area per unit time, this gives         Sea. The highest densities occur over mountainous regions of
the presented data in units of density rate; to be correct then,        continental central Europe and along the northern coastlines
the reader should keep in mind that this is average flash den-          of the Mediterranean.
sity per year.

Nat. Hazards Earth Syst. Sci., 14, 815–829, 2014                                  www.nat-hazards-earth-syst-sci.net/14/815/2014/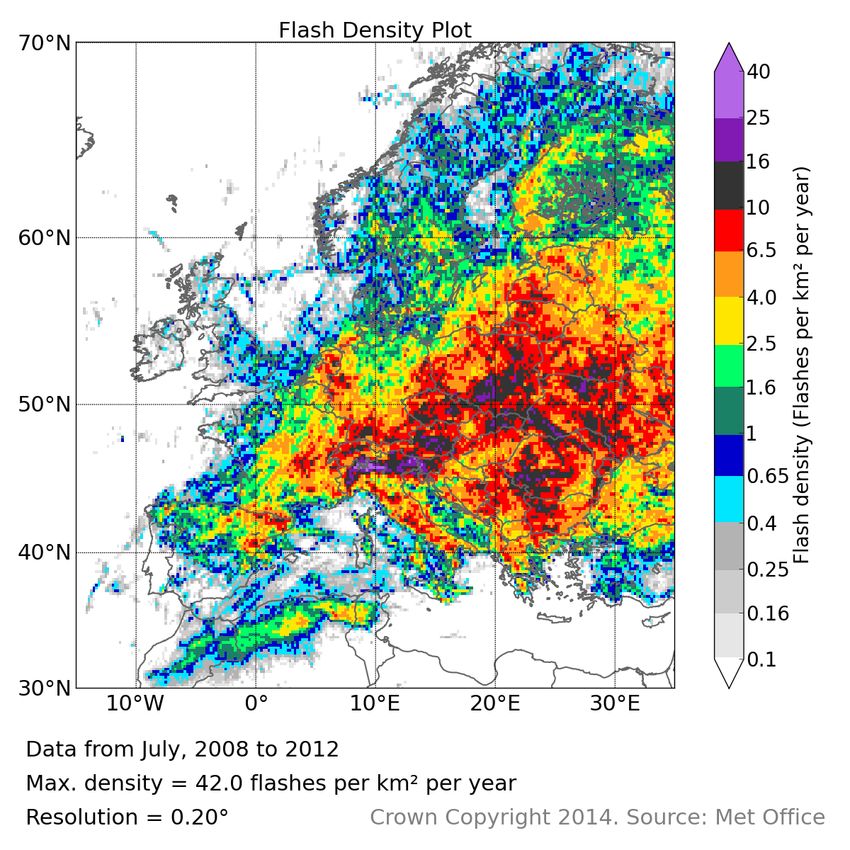
G. Anderson and D. Klugmann: European lightning density using ATDnet data                                                   819

Fig. 4. Annual detected lightning flash density.

   There is a clear preference for higher flash densities over    3.2     Analysis by month
land compared to over open water. The monthly analysis
shows that lightning in Europe peaks during the summer            3.2.1    January
months, where land surface heating becomes the main source
of the instability that leads to thunderstorms.                   Lightning occurrence throughout Europe is at a minimum in
   The distribution of lightning is similar to that observed by   winter, as displayed in Fig. 5, as the lack of solar heating
the OTD (Fig. 2). As predicted in the Introduction, the flash     and available atmospheric water vapour reduce the amount
densities observed by ATDnet are lower than those observed        of energy available for storms to develop.
by OTD (widely greater than 4 flashes per km2 per year),             Lightning activity over continental Europe is very low.
most likely due to the superior IC detection efficiency of the    The regions with the highest lightning activity are around the
OTD. As ATDnet predominantly detects CG flashes, this is          coastlines of the eastern Mediterranean, along the coasts of
not a comparison of like with like; however, assuming that        Turkey, Greece and the Balkans. Residual heat from the pre-
the distribution of IC and CG events are closely related, this    vious summer in the Mediterranean itself provides a source
is a good check of the reliability of the ATDnet flash density    of energy and water vapour for generating convection.
data set.

www.nat-hazards-earth-syst-sci.net/14/815/2014/                              Nat. Hazards Earth Syst. Sci., 14, 815–829, 2014
820 G. Anderson and D. Klugmann: European lightning density using ATDnet data
Fig. 5. Detected lightning flash density for January. Fig. 7. Detected lightning flash density for March.
leased with the additional forcing of coastal convergence and
orographic effects.
3.2.3 March
March sees the early signs of the resurgence of convection
from solar heating (Fig. 7). Coastline lightning density in the
Mediterranean is further reduced from February, but activ-
ity increases slightly across central Europe. The form of the
Atlas Mountains in northern Algeria and Morocco and the
Apennine Mountains in Italy are revealed by an increase in
lightning density. Northern regions of Europe such as the UK
and Scandinavia see little change in lightning between Febru-
ary and March. Despite early signs of increasing activity, the
maximum flash density in Europe in March is the lowest of
all 12 months.
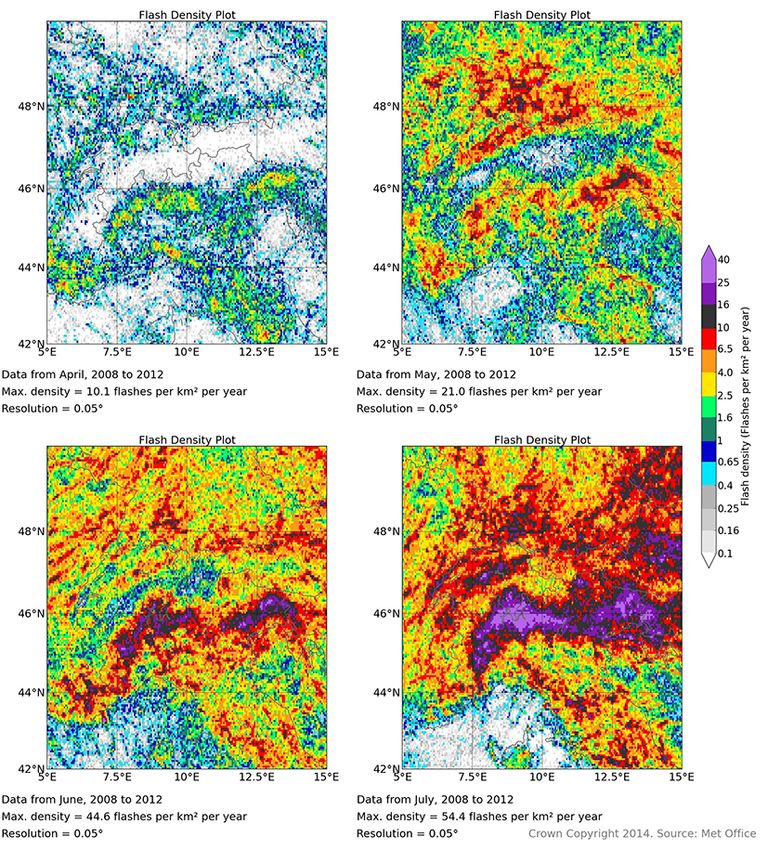
3.2.4 April
The distribution of lightning across Europe takes a notice-
able turn between March and April, with the greatest flash
Fig. 6. Detected lightning flash density for February. densities now occurring over land (Fig. 8). Lightning density
over the southern European seas is now reaching a minimum,
as residual heat from the previous summer has now been ex-
hausted, and the air begins to warm, reducing instability.
3.2.2 February The surrounding land masses, warmed by increasing solar
heating, become the main source of convection, as warm land
The distribution of lightning in February (Fig. 6) is very below air that is still relatively cold leads to instability. It is
similar to that of January. The occurrence of lightning in this combination that leads to the generation of “April show-
the Mediterranean becomes slightly more concentrated along ers” in the UK, where lightning density has increased com-
coastlines relative to January, as the instability is only re- pared with March. The regions of the Atlas Mountains, the
Nat. Hazards Earth Syst. Sci., 14, 815–829, 2014 www.nat-hazards-earth-syst-sci.net/14/815/2014/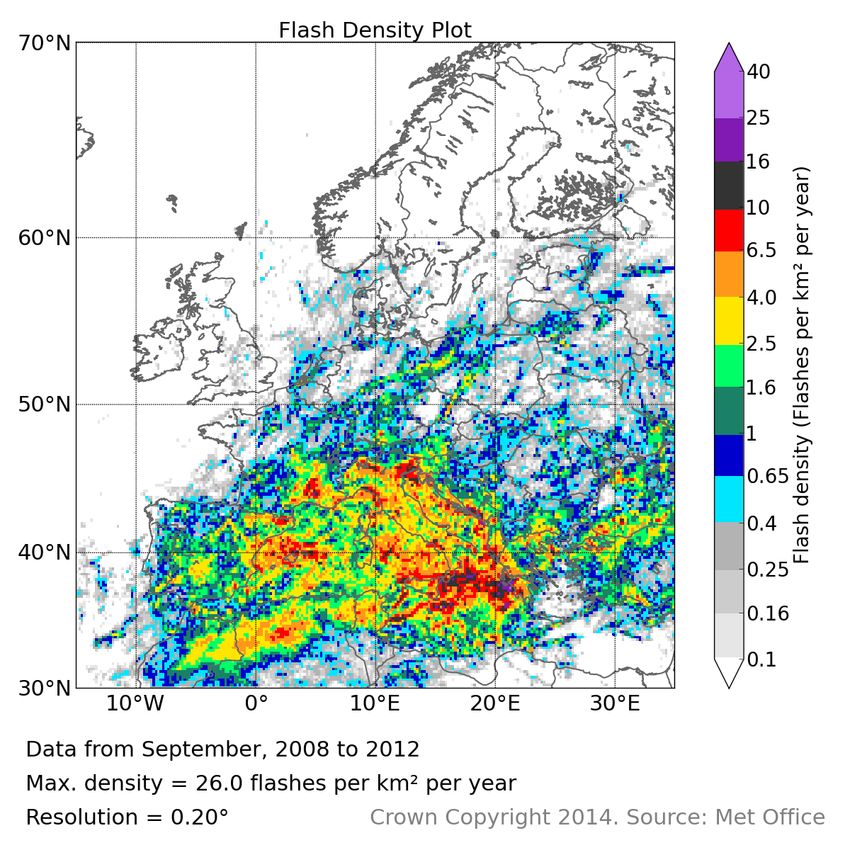
G. Anderson and D. Klugmann: European lightning density using ATDnet data 821
Fig. 8. Detected lightning flash density for April. Fig. 10. Detected lightning flash density for June.
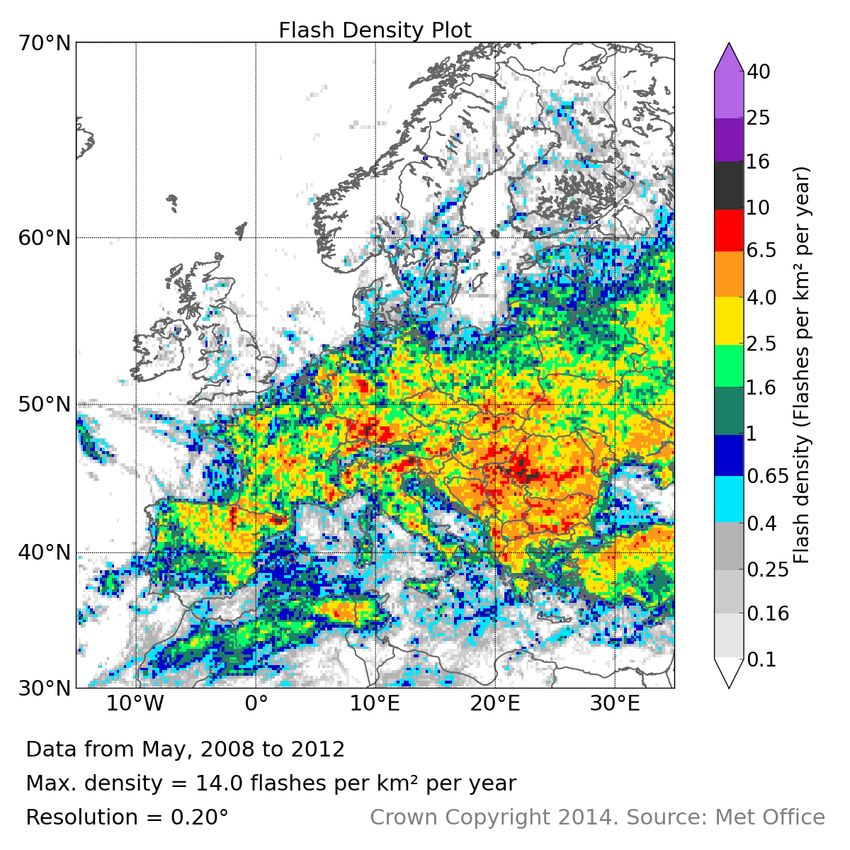
3.2.5 May
The increase in lightning density observed in April continues
into May (Fig. 9), with the increase covering almost all of
continental Europe. Many regions see lightning activity jump
by an order of magnitude.
The first noticeable increases of lightning occur in Scot-
land, Finland, Norway and Sweden. The central Alps still
remain relatively lightning-free, however.
3.2.6 June
By June, Romania, Bulgaria and northern Italy demonstrate
some of the highest lightning densities in Europe (Fig. 10).
Lightning activity along coastlines and over open water is
generally low, as the relatively cold water acts as a stabilising
influence on the atmosphere.
Individual storm tracks are noticeable in the UK, Sweden
and Norway. For example, the noticeable stripe of high light-
ning density in central England was caused by storms on only
Fig. 9. Detected lightning flash density for May. one day, on the 28 June 2012. These storms were uncharac-
teristically intense for the UK, as can be seen by the way
they are still easily distinguishable, despite the density plot
Italian Apennines, the Pyrenees and the lower slopes of the consisting of 5 years’ worth of June data.
Alps now show the highest flash densities. The heart of the
Alps still show very little lightning activity however, which 3.2.7 July
will be further examined in its own section later.
Lightning densities across Europe peak during July (Fig. 11),
with the highest density box averaging almost 4 lightning
flashes per km2 during the month. The spread of high light-
ning density generally moves north, with some of the highest
www.nat-hazards-earth-syst-sci.net/14/815/2014/ Nat. Hazards Earth Syst. Sci., 14, 815–829, 2014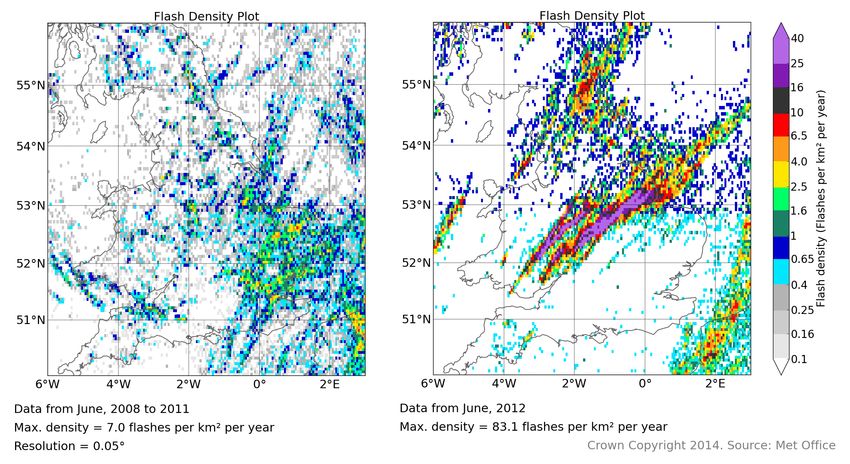
822                                             G. Anderson and D. Klugmann: European lightning density using ATDnet data

Fig. 11. Detected lightning flash density for July.                 Fig. 13. Detected lightning flash density for September.

                                                                    and solar heating decreases, generating less instability. Light-
                                                                    ning activity is still generally restricted to landmasses.

                                                                    3.2.9    September

                                                                    September sees a dramatic switch in the distribution of Eu-
                                                                    ropean lightning, as can be seen in Fig. 13. Northern Europe
                                                                    sees a sharp drop in observed lightning, whereas the western
                                                                    Mediterranean sees a sharp increase, particularly along coast-
                                                                    lines. Cooler air moving over the now warm waters of the
                                                                    Mediterranean leads to the generation of storms. Lightning
                                                                    densities in the eastern Mediterranean remain relatively low,
                                                                    however. Lightning densities are still higher over the Alps,
                                                                    Pyrenees and Atlas Mountains than the surrounding regions.
                                                                    Tracks of individual storms are noticeable across Germany,
                                                                    Poland and the Czech Republic, predominantly from storms
                                                                    in 2011.

                                                                    3.2.10   October

                                                                    Lightning densities across all land regions become low in
                                                                    October (Fig. 14), as lightning activity over the Mediter-
Fig. 12. Detected lightning flash density for August.
                                                                    ranean dominates. Lightning activity in the eastern Mediter-
                                                                    ranean increases in October, leading to more uniform light-
                                                                    ning density between Gibraltar and Cyprus than is observed
European lightning densities now observed in Poland and             in September.
Ukraine.
                                                                    3.2.11   November
3.2.8   August
                                                                    The lightning distribution over Europe in November (Fig. 15)
Lightning densities begin to drop across continental Europe         is similar to that of October, but with generally reduced flash
in August (Fig. 12), as the air temperatures reach their peak       densities. The last remnants of notable flash densities over

Nat. Hazards Earth Syst. Sci., 14, 815–829, 2014                              www.nat-hazards-earth-syst-sci.net/14/815/2014/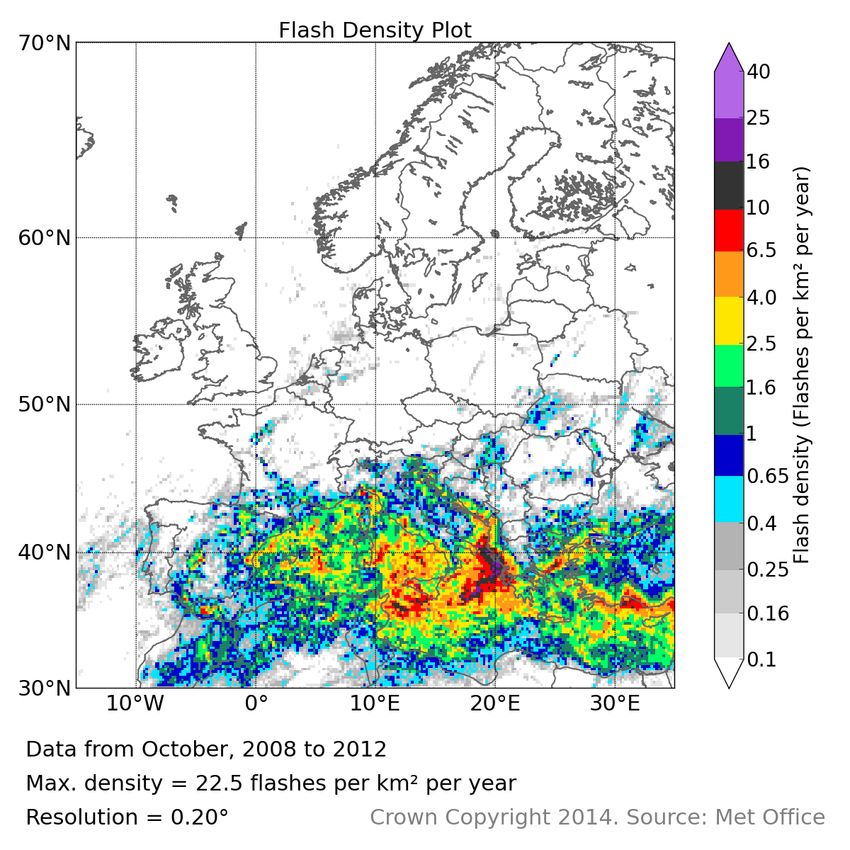
G. Anderson and D. Klugmann: European lightning density using ATDnet data                                                 823

Fig. 14. Detected lightning flash density for October.          Fig. 16. Detected lightning flash density for December.

                                                                shift towards the east, with peak densities observed along the
                                                                coastlines of Greece, Turkey and Cyprus.

                                                                3.2.13    Summary

                                                                The annual pattern of the distribution of lightning across
                                                                Europe can be summarised as follows. During the winter
                                                                months at the start of the year, lightning is predominantly
                                                                restricted to the Mediterranean, where warm waters pro-
                                                                vide the driver for storm development. In early spring, the
                                                                land begins to warm, and a switch from mainly sea-based to
                                                                land-based convection begins in southern parts of the con-
                                                                tinent. By early summer, the majority of lightning is over
                                                                land, and land-based convection now extends to the north
                                                                of Europe. The peak month for European lightning is July.
                                                                Following a slight decrease in lightning occurrence in Au-
                                                                gust, sea-based convection returns extensively to the western
                                                                Mediterranean in September. In the remainder of the year,
                                                                land-based lightning density continues to decrease, and the
                                                                regions of highest lightning densities in the Mediterranean
Fig. 15. Detected lightning flash density for November.         spread from west to east.

                                                                3.3     Further analysis
land in October, such as storms over Spain and the Atlas
Mountains, are no longer observed.
                                                                3.3.1    28 June 2012 Storms, UK
3.2.12   December
                                                                On 28 June 2012, unusually severe storms struck the UK,
Flash densities in December (Fig. 16) are now returned to the   starting in the west of England and the south of Wales in
winter pattern observed in January and February. The distri-    the morning, moving north-eastwards and eventually into the
bution of the higher flash densities in the Mediterranean now   North Sea as the day progressed. The storms generated much

www.nat-hazards-earth-syst-sci.net/14/815/2014/                            Nat. Hazards Earth Syst. Sci., 14, 815–829, 2014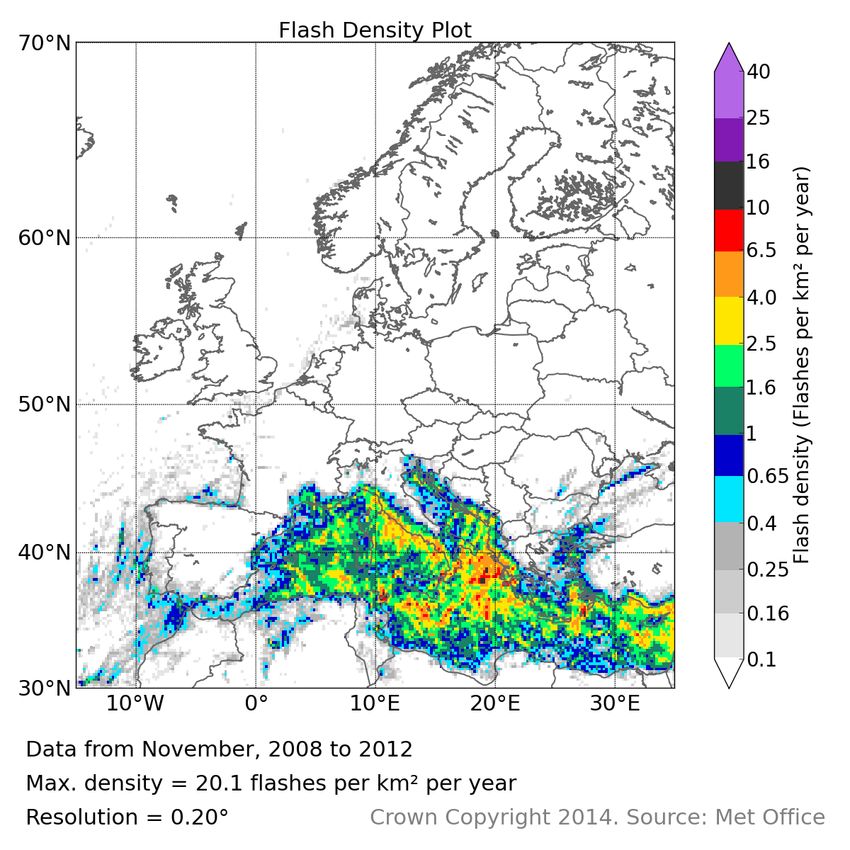
824                                           G. Anderson and D. Klugmann: European lightning density using ATDnet data

Fig. 17. Detected lightning flash density for June for the UK, between 2008 and 2011 (left), and in 2012 only (right).

media interest, as storms of this level of intensity are rarely          Austria. They attribute this affect to the inner Alpine dry area,
observed in the UK.                                                      where high altitudes lead to a lack of moisture, and high sur-
   The lightning density maps using 5 years’ worth of data               face albedos from ice/snow reduce the effect of solar heating
still clearly show the paths of the storms (see Fig. 10),                on the surface, thereby removing two key factors in the gen-
even when the lightning density is averaged from 150 June                eration of thunderstorms.
days. Figure 17 shows the lightning density in June 2012
alongside the density averaged over the previous four Junes,             3.3.3   Land–sea contrast
for comparison.
   Using extended data sets such as this, measures of return             The contrast between lightning densities over the land and
frequencies of such storms could be created and refined over             sea are relatively diffuse in Fig. 4, where the use of data from
time, providing a useful source for storm risk information.              the full year shows greater intensities over land than over sea.
                                                                         By looking at the monthly densities, it is possible to distin-
3.3.2   Springtime Alps                                                  guish much sharper contrasts between land and sea flash den-
                                                                         sities near coastlines.
As solar heating increases during spring, lightning density                 During the summer months along south- and west-facing
increases over much of continental Europe, as warming air                coasts in the Mediterranean in particular, flash densities can
near the surface destabilises the relatively cool springtime             jump by an order of magnitude only a few tens of kilometres
troposphere. One notable exception to this trend is in the cen-          inland along stretches of coastline a few hundred kilometres
tral Alps, where a region of particularly low lightning density          long. This can be seen in Fig. 19, where the flash densities
(relative to regions at a similar latitude) is apparently collo-         along the coastline of northwest Italy shows a sharp land–sea
cated with the mountain region; the effect is particularly no-           contrast.
ticeable in the density map from May in Fig. 18.                            The contrast is not as well defined in winter, but the re-
   The southern slopes of the Alps experience some of the                versed effect can still be seen around Turkey, Greece, the
highest flash densities in Europe, where a combination of                Balkans and Italy during the winter months, where the flash
moisture from the Mediterranean and air being forced up the              density is highest over the Mediterranean itself, but decreases
slopes provides perfect conditions for storms. It is apparent,           rapidly inland from the coasts.
however, that, once the air has reached the central Alps, the
reduction in upward forcing and moisture content leads to a
less conducive environment for storm development.
   Schulz et al. (2005) noticed the same effect when review-
ing 10 years of lightning data from the ALDIS network in

Nat. Hazards Earth Syst. Sci., 14, 815–829, 2014                                   www.nat-hazards-earth-syst-sci.net/14/815/2014/
G. Anderson and D. Klugmann: European lightning density using ATDnet data 825
Fig. 18. Detected lightning flash density for the Alps, for April (top left), May (top right), June (bottom left) and July (bottom right).
4 Flash statistics rise from the winter minimum to the summer peak. The drop
from the summer peak back into the winter low is slower,
In the following section, seasons are defined as follows: with a steady decline between July and December.
spring consists of March to May, summer consists of June The peak in the summer months is around an order of mag-
to August, autumn consists of September to November, and nitude greater than the minimum in the winter months, even
winter consists of December to February. with the occurrence of Mediterranean winter storms. Flash
rates in July average nearly 100 000 flashes per day.
4.1 Europe-wide average flashes per month
4.2 Flashes per month in latitude bands
Figure 20 shows a histogram of the average number of flashes
per month detected by ATDnet in Europe between 2008 and The histogram of flashes per month in Fig. 20 demonstrates
2012. The distribution between April and July shows a rapid the distribution for all of Europe, but there will inevitably be
www.nat-hazards-earth-syst-sci.net/14/815/2014/ Nat. Hazards Earth Syst. Sci., 14, 815–829, 2014826 G. Anderson and D. Klugmann: European lightning density using ATDnet data
Fig. 19. Detected lightning flash density for July for Genoa. Fig. 21. Monthly average flash detections for latitude bands across
Europe, along with the cumulative distribution, for 30–40◦ N (top
left), 40–50◦ N (top right), 50–60◦ N (bottom left), and 60–70◦ N
(bottom right).
winter storms in the Mediterranean can be distinguished from
other regional effects.
The 30–40◦ N latitude band shows a very different pat-
tern to the all-Europe distribution. During winter, spring and
summer, average monthly flash totals vary between around
100 000 and 300 000 flashes, with a slight peak in late spring.
During the autumn months, however, the flash totals rise to
over 700 000 in September and October. This peak can also
be seen in the flash density maps for these months (Figs. 13,
14), where flash densities increase sharply compared with
the previous month. Conversely, July is a local minimum in
the flash rate in this latitude range, whereas July represents a
peak in the Europe-wide data and other latitude bands.
The 40–50◦ N band covers much of the landmass of cen-
tral Europe, and so sees the highest monthly flash averages.
The peak in summer is better defined than in the annual data,
Fig. 20. Monthly average flash detections across all of Europe. with much lower relative values (of the order of 1–4 % of the
annual total per month) during the winter. The rise in flash
rates between April and July, and the gradual drop between
variations within different regions of Europe. It is noticeable August and November, still take a very similar form to the
in the monthly density plots that increasing flash densities trend seen in Fig. 20, however.
spread northward with time in spring, and that flash densi- The 50–60◦ N band still shows a peak in average flash to-
ties remain high in the Mediterranean in the winter long after tals in July; however the July flash total is only around half
densities have dropped across the continental landmass. that of the 40–50◦ N band. It is also noticeable that monthly
Figure 21 uses the same approach for plotting flashes per average flash totals between October and March are very low.
month in a histogram, but this time uses four 10◦ latitude Colder winter air at these higher latitudes provides poor con-
bands across Europe. This means that features such as early ditions for the generation of thunderstorms.
Nat. Hazards Earth Syst. Sci., 14, 815–829, 2014 www.nat-hazards-earth-syst-sci.net/14/815/2014/G. Anderson and D. Klugmann: European lightning density using ATDnet data 827
Table 1. Statistics of flashes detected in four latitude bands across achieve this criterion. Care should be taken then in interpret-
Europe. ing the monthly data: they are suitable for observing over-
all trends, but the actual values in individual grid boxes will
Lat. band Avg. total Peak month (value, % of total) be subject to a high degree of uncertainty. The grid box di-
30–40◦ N 3436 452 Sept (715 886, 20.8 %) mensions used (i.e. based on latitude/longitude limits) were
40–50◦ N 5802 615 July (1528 673, 26.3 %) chosen based on their simplicity to understand; however the
50–60◦ N 2315 394 July (885 430, 38.2 %) effect that the area reduces with increasing latitude, where
60–70◦ N 257 936 July (129 896, 50.4 %) the lightning density also decreases, is unfortunate. The fact
that lightning density varies by orders of magnitude across
Europe makes it difficult to select a grid scheme that both
The average flash total for July in the 60–70◦ N band is shows sufficient detail in high-density regions and also pre-
less than 10 % of the value for the 40–50◦ N band. For the vents high uncertainties in low-density regions.
longitude range used, around half of this band is made up of Readers should be aware that, while the data provide a
the North Sea, where flash totals are very low all year round. good representation of lightning density across Europe, there
The land masses of Norway, Sweden, Finland and a small are still factors in the methodology of the way the data are
part of Russia contribute to the majority of flashes detected obtained that will mean they do not exactly represent the
in this region. The distribution of flashes at this latitude is true European CG flash density, as is true with any observa-
even narrower than in the previous band, with a storm season tion system. For example, the design of ATDnet means that
lasting only 3–4 months in general. Over 50 % of flashes at it will predominantly detect the emissions from CG return
this latitude occur in July. strokes. However, VLF systems have been shown to detect
These results are summarised in Table 1. a proportion of IC discharges, as observed in data obtained
by the WWLLN (Jacobson et al., 2006). As yet unpublished
results obtained by analysing ATDnet data appear to confirm
5 Discussion that ATDnet also picks up a proportion of IC discharges, but
with a reduced detection efficiency relative to CG flashes.
Although the general information presented in this paper may The difference in detection efficiency between IC and CG
not be of particular surprise to most readers (i.e. that light- discharges is thought to predominantly be caused by the fact
ning in Europe is most intense over the continent during that CG return strokes are generally more powerful than IC
summer, that higher latitudes experience less lightning than discharges, and so are more easily detected at long ranges.
lower latitudes), the ability to analyse the relative intensities The use of algorithms for discriminating flash type by esti-
of lightning over the European region using continuous and mating the arrival time difference between a surface and an
consistent data has not previously been presented. elevated source at the estimated flash location are difficult
The ability to carry out seasonal analysis allows for better to implement for long-baseline systems like ATDnet, due to
understanding of processes such as the timing of the mode the minimal path difference between such theoretical sources
switch from predominantly land-based to sea-based convec- at ranges of hundreds to thousands of kilometres, and the
tion in the autumn. The use of continuous Europe-wide data fact that waveforms are modified as they propagate, reducing
also means that variations in different regions can be put into the ability to distinguish discharge types based on waveform
a wider context. characteristics. Alternative methods for discrimination have
The effects of unusually intense storms are visible in most not yet been assessed.
months of data. Had the data from ATDnet been available for It should also be noted that the detection efficiency of
a longer period, such effects could be reduced in the flash ATDnet has a diurnal variability, attributed to variations in
density analysis. However, data were only used from a pe- the ionosphere leading to differences in propagation paths of
riod where the performance of ATDnet could be assumed to VLF sky waves between the day and night (Bennett et al.,
be relatively homogeneous. Similar analysis could again be 2011). The difference in path length between the ground
carried out in future; in order to repeat the analysis with re- wave and successive sky waves leads to bands of reduced
duced “noise”, however, the key results would still be likely sferic signal strength caused by interference between signals
to remain unchanged. with paths differing by n+1/2 wavelengths, where n is an in-
It is desirable that, following the calculations of Diendor- teger. The effect is more noticeable at night, due to the height
fer (2008), the number of events per grid cell should exceed of the ionosphere leading to a greater degree of destructive
80, in order to provide an estimated uncertainty of the den- interference.
sity value of 20 % or less. This is achievable for much of Diurnal variation in detection efficiency due to VLF inter-
Europe in the annual data, except in the very low lightning actions with the ionosphere is not a simple challenge to over-
activity regions in the northwest of Europe. In the monthly come. Higher densities of sensors would reduce the num-
analysis, however, lightning densities in excess of 1 flash ber of interference band regions; however that would also
per km2 are required in the northern limits of the region to increase costs. The fact that this is a truly physical effect
www.nat-hazards-earth-syst-sci.net/14/815/2014/ Nat. Hazards Earth Syst. Sci., 14, 815–829, 2014828 G. Anderson and D. Klugmann: European lightning density using ATDnet data
means that simply modifying the processing software can- Acknowledgements. The Lightning Imaging Sensor (LIS)/Optical
not fully overcome this issue. However, assuming that this Transient Detector (OTD) science data were obtained from the
issue is broadly uniform across Europe, and that the majority NASA EOSDIS Global Hydrology Resource Center (GHRC)
of thunderstorms take place in Europe during daytime hours, DAAC, Huntsville, AL (http://thunder.nsstc.nasa.gov/).
the relative flash densities would still be valid. It is for this
Edited by: G. Panegrossi
reason that no analysis of the diurnal variation in flash rates
Reviewed by: two anonymous referees
has been carried out, as the effect of changes in modal detec-
tion efficiency could be misinterpreted as diurnal effects in
real flash rates.
Variations in detection efficiency are less pronounced References
when dealing with flashes than would be the case if we were
to work with strokes. In regions of high sensor density, a high Antonescu, B. and Burcea, S.: A Cloud-to-Ground Lightning Cli-
detection efficiency is achievable for flashes and strokes; at matology for Romania, Monthly Weather Rev., 138, 579–591,
longer ranges, weaker subsequent return strokes will become 2010.
harder to detect, but the most powerful stroke in the flash Bennett, A. J., Gaffard, C., Nash, J., Callaghan, G., and Atkinson,
N. C.: The Effect of Modal Interference on VLF Long-Range
may still be detected. Indeed, such an effect can be observed
Lightning Location Networks Using the Waveform Correlation
in the data of Orville et al. (2011), where the averaged mul- Technique, J. Atmos. Oc. Technol., 28, 993–1006, 2011.
tiplicity of flashes detected by the North American Light- Betz, H. D., Schmidt, K., Laroche, P., Blanchet, P., Oettinger, W. P.,
ning Detection Network decreases with increasing distance Defer, E., Dziewit, Z., and Konarski, J.: LINET – an international
from the network. Analysis of regional average multiplicity lightning detection network in Europe, Atmos. Res., 91, 564–
in ATDnet data might reveal such a trend. Little analysis has 573, 2009.
been made here of flash multiplicity; however it may be of Christian, H. J., Blakeslee, R. J., Goodman, S. J., Mach, D. A.,
interest to study such effects in future. Care would need to be Stewart, M. F., Buechler, D. E., Koshak, W. J., Hall, J. M, Boeck,
taken when analysing such a broad region, however, where W. L., Driscoll, K. T., and Boccippio, D. J.: The lightning imag-
true regional differences in multiplicity would need to be dis- ing sensor, in: NASA conference publication, NASA, 746–749,
tinguished from effects of the detection efficiency of subse- 1999.
Christian, H. J., Blakeslee, R. J., Boccippio, D. J., Boeck, W. L.,
quent strokes in flashes.
Buechler, D. E., Driscoll, K. T., Goodman, S. J., Hall, J. M.,
The information presented here may be useful in assess- Koshak, W. J., Mach, D. M., and Stewart, M. F.: Global fre-
ing the initial performance of the MTG-LI after its predicted quency and distribution of lightning as observed from space by
launch in 2018 (EUMETSAT). Current plans for the device the Optical Transient Detector, J. Geophys. Res., 108, ACL–4,
include introducing a lightning density product, but the accu- 1–15, 2003.
racy of such a product will need to be assessed against what Cummins, K. L., Murphy, M. J., Bardo, E. A., Hiscox, W. L., Pyle,
is currently understood of lightning density in Europe. R. B., and Pifer, A. E.: A combined TOA/MDF technology up-
Other parties that might also be interested in such infor- grade of the US National Lightning Detection Network, J.f Geo-
mation would be insurance providers, and also energy and phys. Res., 103, 9035–9044, 1998.
utilities companies, who might be better able to assess risks Diendorfer, G.: Some comments on the achievable accuracy of local
associated with storms over broad regions. Due to averaging ground flash density values, in: Proceedings of the 29th Confer-
ence on the International Conference on Lightning Protection,
process used in the paper, however, higher-resolution data
Uppsala, Sweden, 2008.
would be required for risks for specific sites, due to varia- Drüe, C., Hauf, T., Finke, U., Keyn, S., and Kreyer, O.: Comparison
tions in density shorter than the size of a gridbox. of a SAFIR lightning detection network in northern Germany to
the operational BLIDS network, J. Geophys. Res., 112, D18114,
doi:10.1029/2006JD007680, 2007.
6 Conclusions Ducrocq, V.: HyMeX-SOP1, the field campaign dedicated to heavy
precipitation and flash-flooding in Northwestern Mediterranean,
Lightning density data from across Europe detected using in: EGU General Assembly Conference Abstracts, 15, p. 2539,
the ATDnet long-range lightning detection system operated 2013.
by the UK Met Office have been presented. The information EUMETSAT: Meteosat Third Generation - EUMET-
provided by the density plots in this paper can be used to SAT, http://www.eumetsat.int/website/home/Satellites/
gain a greater understanding of the characteristics of light- FutureSatellites/MeteosatThirdGeneration/index.html, access:
ning across Europe. The continual operation of ATDnet will 08 August 2013.
allow for further refinement in future, which can be used to Finke, U. and Hauf, T.: The Characteristics of Lightning Occurrence
gain a better understanding of the average seasonal activity in Southern Germany, Institut für Physik der Atmosphäre Oberp-
of thunderstorms in Europe. faffenhofen: Report, Inst. für Physik der Atmosphäre, 1996.
Gaffard, C., Nash, J., Atkinson, N., Bennett, A., Callaghan, G., Hib-
bett, E., Taylor, P., Turp, M., and Schulz, W.: Observing lightning
around the globe from the surface, in: the Preprints, 20th Interna-
Nat. Hazards Earth Syst. Sci., 14, 815–829, 2014 www.nat-hazards-earth-syst-sci.net/14/815/2014/G. Anderson and D. Klugmann: European lightning density using ATDnet data 829 tional Lightning Detection Conference, Tucson, Arizona, 21–23, Orville, R. E., Huffines, G. R., Burrows, W. R., and Cummins, K. L.: 2008. The North American lightning detection network (NALDN)- Holle, R., Cummins, K., and Demetriades, N.: Monthly distribu- Analysis of flash data: 2001-09, Monthly Weather Rev., 139, tions of NLDN and GLD360 cloud-to-ground lightning, in: In- 1305–1322, 2011. ternational Lightning Detection Conference, 2010. Said, R., Inan, U., and Cummins, K.: Long-range lightning geoloca- Jacobson, A. R., Holzworth, R., Harlin, J., Dowden, R., and Lay, tion using a VLF radio atmospheric waveform bank, J. Geophys. E.: Performance assessment of the world wide lightning location Res., 115, D23108, doi:10.1029/2010JD013863, 2010. network (WWLLN), using the Los Alamos sferic array (LASA) Schulz, W. and Diendorfer, G.: EUCLID network performance and as ground truth, J. Atmos. Oc. Technol., 23, 1082–1092, 2006. data analysis, in: Proceedings of the 17th International Lightning Lagouvardos, K., Kotroni, V., Betz, H., and Schmidt, K.: A compar- Detection Conference (ILDC), AZ, Tucson, 2002. ison of lightning data provided by ZEUS and LINET networks Schulz, W., Cummins, K., Diendorfer, G., and Dorninger, M.: over Western Europe, Nat. Hazards Earth Syst. Sci., 9, 1713– Cloud-to-ground lightning in Austria: A 10-year study using data 1717, 2009, from a lightning location system, J. Geophys. Res., 110, D09101, http://www.nat-hazards-earth-syst-sci.net/9/1713/2009/. doi:10.1029/2004JD005332, 2005. Lee, A. C.: An operational system for the remote location of light- Soriano, L. R., de Pablo, F., and Tomas, C.: Ten-year study of cloud- ning flashes using a VLF arrival time difference technique, J. At- to-ground lightning activity in the Iberian Peninsula, J. Atmos. mos. Oc. Technol., 3, 630–642, 1986. Solar-Terrest. Phys., 67, 1632–1639, 2005. Mäkelä, A., Rossi, P., and Schultz, D. M.: The Daily Cloud-to- Ground Lightning Flash Density in the Contiguous United States and Finland, Monthly Weather Rev., 139, 1323–1337, 2011. www.nat-hazards-earth-syst-sci.net/14/815/2014/ Nat. Hazards Earth Syst. Sci., 14, 815–829, 2014
You can also read