Toward Improving the Prediction Accuracy of Product Recommendation System Using Extreme Gradient Boosting and Encoding Approaches - MDPI
←
→
Page content transcription
If your browser does not render page correctly, please read the page content below
SS symmetry
Article
Toward Improving the Prediction Accuracy of Product
Recommendation System Using Extreme Gradient
Boosting and Encoding Approaches
Zeinab Shahbazi, Debapriya Hazra, Sejoon Park and Yung Cheol Byun *
 Department of Computer Engineering, Jeju National University, Jejusi 63243, Korea;
 zeinab.sh@jejunu.ac.kr (Z.S.); debapriyah@jejunu.ac.kr (D.H.); ppakse6@jejunu.ac.kr (S.P.)
 * Correspondence: ycb@jejunu.ac.kr

 Received: 9 September 2020; Accepted: 18 September 2020; Published: 22 September 2020

 Abstract: With the spread of COVID-19, the “untact” culture in South Korea is expanding and
 customers are increasingly seeking for online services. A recommendation system serves as a decision-
 making indicator that helps users by suggesting items to be purchased in the future by exploring the
 symmetry between multiple user activity characteristics. A plethora of approaches are employed
 by the scientific community to design recommendation systems, including collaborative filtering,
 stereotyping, and content-based filtering, etc. The current paradigm of recommendation systems
 favors collaborative filtering due to its significant potential to closely capture the interest of a user as
 compared to other approaches. The collaborative filtering harnesses features like user-profile details,
 visited pages, and click information to determine the interest of a user, thereby recommending the items
 that are related to the user’s interest. The existing collaborative filtering approaches exploit implicit
 and explicit features and report either good classification or prediction outcome. These systems fail to
 exhibit good results for both measures at the same time. We believe that avoiding the recommendation
 of those items that have already been purchased could contribute to overcoming the said issue. In this
 study, we present a collaborative filtering-based algorithm to tackle big data of user with symmetric
 purchasing order and repetitive purchased products. The proposed algorithm relies on combining
 extreme gradient boosting machine learning architecture with word2vec mechanism to explore the
 purchased products based on the click patterns of users. Our algorithm improves the accuracy of
 predicting the relevant products to be recommended to the customers that are likely to be bought.
 The results are evaluated on the dataset that contains click-based features of users from an online
 shopping mall in Jeju Island, South Korea. We have evaluated Mean Absolute Error, Mean Square
 Error, and Root Mean Square Error for our proposed methodology and also other machine learning
 algorithms. Our proposed model generated the least error rate and enhanced the prediction accuracy
 of the recommendation system compared to other traditional approaches.

 Keywords: recommendation system; collaborative filtering; symmetric purchasing order; predictive
 analysis; data mining; XGBoost; Word2vec

1. Introduction
     Over the past few decades, recommender systems (RS) have immensely been utilized by
a number of domains including e-commerce, research-paper recommender systems, social websites,
etc. The e-commerce or similar websites e.g., Amazon, Yelp, Epinions, etc. provide feasibility to its
customers to share their opinion regarding the purchased items. The main purpose of these systems is
to recommend items or products that relate to one’s interest or are highly likely to be purchased in the
future. The recommendations are made based on historical records i.e., opinions of customers who

Symmetry 2020, 12, 1566; doi:10.3390/sym12091566                               www.mdpi.com/journal/symmetry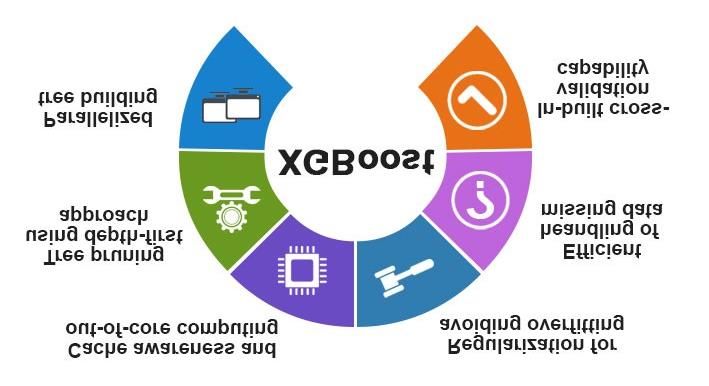
Symmetry 2020, 12, 1566                                                                           2 of 20

have already purchased those products. The opinions are expressed in the form of reviews or ratings
thus playing a key role in attracting future customers and helping them with decision-making [1–4].
The recommender systems utilize the interest of a user which is captured by exploiting a set of
diversified features belonging to the following approaches: collaborative filtering (CF), content-based
filtering, metadata-based filtering, etc. The CF follows a theory that users like what like-minded users
like. Two or more users are considered like-minded if they do similar ratings of items. Since the theory
followed by the CF is deemed strong by the scientific community, therefore, it has been widely been
employed by a number of researchers [5–7].
      The CF poses various steps for a recommendation and is also referred to as item-based
collaborative filtering (IBCF). Furthermore, it is scalable and easy to adapt compared to other
recommendation approaches. A recommendation in this system is made based on profile similarity
(profile features, graphics, etc.), user product rating, and comments. The recommendations are made
based on two types of user interest: Implicit and Explicit. User product views and actions relate to
implicit (model-based) category. The features such as Likes and follows are associated with an explicit
category (memory-based) [8–11]. The contemporary state-of-the-art on the CF recommendation system
has reported classification and prediction of future items to be bought with good accuracy. However,
to the best of our knowledge, none of them was able to present remarkable results for both accuracy and
classification [12–15]. Trust is another factor used in various applications that needs to be evaluated.
Due to the memory-based scalability issue, most of the industrial settings are managed based on the
model-based method for recommendation [16–20]. Matrix factorization is popular in the model-based
category and changes [21]. The process is going based on optimizing two low-rank metrics. Metrics are
divided into items and users latent features. The combination of user–item features relationship makes
the original matrix avoid over-fitting. In recent years, many approaches have been proposed related to
item recommendation. In this paper, we present the CF-based recommendation system to overcome
the issue of good prediction and classification accuracy at the same time. In the proposed system,
user profile information and click history collected from a Jeju online shopping mall are harnessed
as features. The key idea of the proposed approach is to avoid the recommendation of those items
that have already been purchased. Word2vec applied for data pre-processing followed by an XGBoost
machine learning algorithm to evaluate the prediction and classification accuracy. Finally, the system
recommends a product based on user click rate and purchased items.
      The main contributions of this paper are as follows:

•    The main objective of this study is the use of data mining and machine learning approaches in the
     context of online product shopping.
•    The presented XGBoost classifier enhancing the prediction accuracy for data mining techniques
     to extract hidden knowledge from an online product shopping dataset is the important side of
     system managing.
•    The presented work follows the analysis techniques, e.g., time series analysis, statistical
     analysis, product analysis, user interest analysis, access page based analysis, and purchased
     product analysis.
•    Collaborate filtering process applied to predict the rate of products and evaluate the
     neighbor items.
•    Word2vec encoding technique used to generate the dataset vector space and predict the
     surrounded context randomly.
•    We have various data pre-processing steps to change the data format in consistent format.
•    Various features extracted from dataset e.g., user information, purchased items, click
     information, etc.
•    Finally, we illustrate the constructiveness of the XGBoost model which is applied for prediction,
     classification, and regression of online product shopping.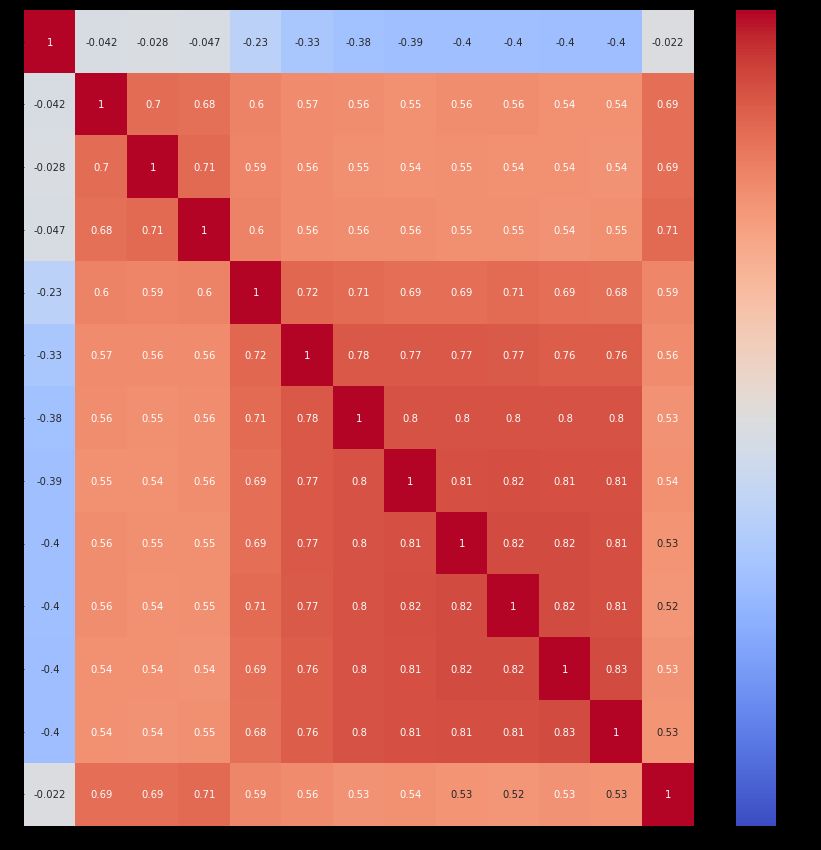
Symmetry 2020, 12, 1566                                                                                                                                                   3 of 20

     Figure 1 shows the prediction process of the neighbor product in the proposed system.
The neighbor recommended items generated based on the user click sequences. The number of
directions to a product is also important. If there are various directions provided for one product,
it means that the user clicked a few times on the same product. For easier explanation, this product
might be the user interest. This procedure repeated for all users. Hence, this model aims to obtain the
complex relationship between user and product.

                                           User Clicks                                                                                  Product X

                                                                                                      Shopping
                          Product1          Product2          Product...     Product n                                                   Product

             User

                                                                                                                                    Collaborate Filtering

                                                                                                                             Same weight predicted products

                                                                                                                                        Product A
                                     Neighbours Recommended
                                                                                                                 Product F                                    Product B

                                                                                            Recommending
                             Product n         Product...         Product2       Product1

             User
                                                                                                                 Product E                                    Product C

                                                                                                                                        Product D

                    Figure 1. User click pattern on different products and respective sessions.

     The rest of the paper is divided as follows: Section 2 presents the literature review of the proposed
item-based recommendation system. Section 3 presents the data analysis for online shopping product
data, prediction, and classification evaluation. Section 4 presented the predictive analysis of online
shopping product data using a machine learning algorithm of the presented recommendation system.
Section 5 presents the prediction result of the online shopping product, and, finally, we conclude the
paper in the Section 7.

2. Literature Review
      This section encompasses details about the contemporary state-of-the-art in the recommendation
system followed by collaborative filtering with identification of some of the important issues that have
been overlooked by the scientific community. The notion of recommendation systems was actuated in
the late 1990s. To date, the field has become a center of attention of various e-commerce organizations
such as Amazon, eBay, Shopify, etc. that are involved in recommending certain items/products to
its customer.

2.1. Recommendation System
      The recommendation system is a type of information filtering system that analyzes user
behavior on the available dataset and predicts user preferences. User behavior contains the click
information, user rating on purchased items, comments, sharing, cart information, etc. [22–27].
The main focus of this system is to help the users with a lack of available information to make a
decision regarding the purchase of certain items. From the 1990s, different RS in different domains
including articles, movies, and products have been presented by the scientific community [28–35].
These systems have broadly been categorized into five main classes including (1) collaborate filtering,
(2) content-based recommendation, (3) knowledge-based recommendation, (4) hybrid recommendation,
and (5) demographic recommendation. This categorization has been given by Burke [36]. The idea of
Symmetry 2020, 12, 1566 4 of 20
collaborate filtering (CF) was coined by Goldberg et al. [37]. The CF has a predicting process to show
user preferences and the same point between users or products [38].
In other words, CF assumes that, if two users have a similar interest in one product, they will
have a similar interest in other products as well. Researchers have drawn comparisons of the
neighborhood-based processes with other approaches in terms of ease of adaptability and efficiency, etc.
Similarly, most of the studies have improved the performance of existing approaches using different
machine learning algorithms and techniques. Besides various potential aspects of CF, it contains a
sparsity issue due to a lack of information of user interest in products [39]. It has been observed that
the total ratings of products given by customers are comparatively lower than the number of items
purchased. This leads to most of the purchased items having few or sometimes zero ratings. During the
last few years, online shopping systems have grabbed paramount attention of people across the globe.
The online shopping websites like Amazon are accessible by a lot of people. In some CF approaches,
the main focus is the purchased items by a user only during a certain time period. Similarly, there are
many IoT-based platforms, such as healthcare [40–42], indoor localization [43,44], and many other
IoT systems [45–47] which can be improved in terms of accuracy by integrating the recommendation
functionality. Song et al. [48] have analyzed changes in a user behavior by constructing dependent
rules from two different attributes, i.e., dataset and user behavioral changes. The study has conducted
the comparison of purchasing by using the defined rules and the outcomes suggested no pattern
changes. Some of the studies have focused on temporal dynamic reflection [49–55]. The temporal
dynamic method is used to assess the association between time purchasing time or the time spent in
clicking various web pages.
2.2. Item-Based Collaborate Filtering
Item-based content filtering (IBCF) is one of the traditional methods of a recommendation system.
The primary purpose of this system is to collect dataset based on same product weights. To find the
similarity between the item–item prediction rate and computing time provided. It is well recognized
that higher weight products contain an extensive contribution. In most of the scenarios, IBCF fails
to provide adequate prediction and classification accuracy. To overcome issues related to IBCF,
the scientific community has presented different approaches. Gao et al. [56] combine the user ranking
with products similarity and proposed page-rank-based ranking approach solely to improve the
prediction accuracy. The proposed approach yielded a good performance in improving accuracy.
Similarly, Koren [15] proposed dynamic preferences-based recommendation system which extracts the
changes of user interest within a defined time period and predicted the accuracy of IBCF. Feng et al. [13]
adopted a temporal overlapping based strategy to improve the accuracy of classification using dynamic
user preferences based on the time-weight rule.
2.3. User Preference-Based Recommendation
Based on the user interest to clicked or purchased products, sometimes they are not interested
in leaving comments or ratings of products or, in another point of view, they leave a false rating for
specific products. This is a popular problem in most of the recommendation systems. To overcome
this issue, ChoiRec12 [57] presents a model which extracts the ratings from purchased products
based on the user purchase history on specific product. The collected data are only related to such
products which were purchased a few times by the same user. For further processing, user–item
matrix collaborate filtering was applied in the presented model. The major process in this system is a
sequential purchase pattern removed from data history, and item recommendation has no provisions.
2.4. Deep Learning in Recommendation Systems
Deep learning is one of the achievements in different fields. In product recommendation systems,
the autoencoder approach contributed well [58]. In [59], tag-aware recommendation developed,
which shows that the user profile is presenting by tags, and, in this case, the neural network extractsSymmetry 2020, 12, 1566 5 of 20
the detail feature from tag layers. In another identical approach to extract the user interest and
every detail of user profile based on memory components, the attention-aware recommendations
developed [60]. Furthermore, the co-attention network investigates the visual information for
improving the recommendation system performance [61]. Convolutional neural network (CNN) and
the recurrent neural network (RNN) have the highest rate of usage in recommendation systems [62–64].
GAN was used to overcome the CNN and RNN negative sampling issue while during system
design [65].
Table 1 presents an overview of various techniques used in the recommendation system. It is
divided into four main parts. In the proposed approach, three main techniques are presented, which
are specific for that research: collaborative filtering, content-based filtering, and web usage filtering.
The techniques which apply in these approaches mainly focus on overcoming the sparsity, scalability,
improving the performance, and improving the recommendation results. These techniques have to face
some issues like cold start, Gray sheep, customer authentication, and trustworthy. The cold start issue is
a computer-based potential information system that requires the data modeling degree. The Gray sheep
issue is one of the recommendation system problems which increase the error rate of collaborative
filtering technique. The authentication problem is also very famous in the recommendation system.
This issue is mostly happening based on users’ lack of identification information in their profile.
Table 1. The advantages and disadvantages of different recommendation models.
# Authors Proposed Approach Technique Advantage Issue
Cold start issue
(involves
Mobasher Collaborative Clustering the Quick results
1 automated
Bamshad [66] Filtering profile aggregation because of clustering
data modeling
degree)
Rule mining
Overcome the Gray sheep issue
Cho Collaborative based on
2 sparsity and scalability (enhance the
Yoon Ho [30] Filtering decision tree
issue error rate)
introduction
Association rule
mining based on
Wanga Collaborative Improve the quality
3 clustering the Gray sheep issue
Feng Hsu [67] Filtering of prediction
hierarchical
bisecting
Similarity Customer
Mehta Collaborative Improve the quality
4 measurement trustworthy
Harita [68] Filtering of prediction
based on entropy (lack of user trust)
Nadi Content-based Improve the quality
5 Rating technique Gray sheep issue
Shiva [69] Filtering of prediction
Techniques of Scalability issue
Nasraoui Web Usage Improve the
6 fuzzy (handling large
Olfa [70] Mining recommendation
approximation scale dataset)
User pattern Improve the quality
Zhou Web Usage matching and of prediction based on
7 Scalability issue
Baoyao [71] Mining sequential pattern rule generation
mining recommendation
offline and online Improve the quality
Authentication
Web Usage components for of prediction and
8 Sumathi [72] issue (lack of user
Mining pattern overcome the scalability
information)
analysis issue
Koutheair Content-based
e-learner history
9 Kharibi [73] and Collaborative Improve the efficiency Gray sheep issue
browsing
Mohamed Filtering
3. Data Analysis for Online Shopping Product Data
In this section, data collection characteristics are presented in detail. Data collection is the first
and essential step of any recommendation algorithm. RS was designed to find the nearest productsSymmetry 2020, 12, 1566 6 of 20
to user preferences. To do this, data type and information is the primary step. We perform RS by
identifying user profile information and click history from Jeju online shopping mall website. Table 2
shows the overview of the processed dataset. The total number of recorded data are 294,864. Based on
the collected data, we extract the purchased product records and the list reduced to 10,000 purchased
product records. Data mentioned were collected based on user click history. In addition, 80% of the
dataset was used for the training set, and 20% of dataset was used for the testing set.
Table 2. Dataset information.
Dataset Detail
Total number of records 294,864
Total number of purchased products 10,000
Unique products 1057
Unique item id 1482
Unique users 51,386
Training data 80%
Test data 20%
3.1. Collection of Online Shopping Product Data
In this paper, we collected the data from Jeju online shopping mall website, the Republic of Korea,
to analyze and inquire online shopping product and extract the hidden parts to improve the product
recommendation system. Data mining techniques were applied to clean and manage the missing
values and increase the stability and performance of data. Furthermore, the below are executed
to extract the hidden parts and information for providing better service to online shopping users
and customers.
• Data collection
• Data cleaning
• Managing missing values
• Extract the related information
• Feature discovery
Table 3 shows the extracted features from presented data.
Table 3. Online shopping product data description.
# Feature Description
1 User ip Each user log-in IP information
2 User click information Users visited pages for shopping
3 Access date Date of accessing to online shopping website
4 Access time Time of accessing to online shopping website
5 Access page Visited links for shopping
6 Product name Name of clicked product on website
7 Product type Type of clicked product e.g., clothes, shoes, etc.
8 Product id ID of the clicked product on website
3.2. Data Pre-Processing
After online shopping product data investment, data pre-processing needs to remove all
unnecessary information. To do this, data pre-processing techniques have been used for transforming
the raw data in a suitable form to apply for the data analysis and prediction analysis. The following
steps show the pre-processing technique. First, we removed all duplicate files to improve the readability
of dataset. Second, we removed the user’s records which have no purchased products. Third, we kept
the information which is needed for the process of recommendation systems. Figure 2 shows the main
part of pre-processing in the proposed system.Symmetry 2020, 12, 1566 7 of 20
Pre-Processing Data
Sorting Data Filtering Data
Sorting based on IP Filter based on
purchasing
Sorting based on
time Filter based on non
purchasing
Data Statistics Filter based on
clicks less than 4
Unique IP
Extraction Filter based on all
the sessions
Purchased item per
user
Click records per
user Generate pattern
sessions
Duration of
sessions
Click sequence
patterns
Hit rate
Figure 2. Overview of data pre-processing.
3.3. Data Analysis and Visualization
In the proposed system, we execute data analysis on the basis of data mining to extract useful
and effective information for better recommendation to the user. The following analysis was applied
to get the results of the available dataset.
• Online product shopping analysis based on (Product frequency, Purchased product, User interest)
• Time series analysis based on (Monthly, Daily)
• Online shopping analysis based on user interest
• Online shopping analysis based on user access page
3.3.1. Time Series Analysis
Time series analysis was used to generate unique and important information for recommending
products. To generate the time series analysis, data duration is for (2019) collected information.
For analyzing the data needed, information was divided into (i.e., Monthly and Daily basis) to generate
the information for product shopping frequency. Figures 3 and 4 show the product shopping data
according to monthly and daily basis.Symmetry 2020, 12, 1566 8 of 20
Daily Basis Analysis
45000
Product Purcasing Record Per Day 40000
35000
30000
25000
20000
15000
10000
5000
0
1 2 3 4 5 6 7 8 9 10 11 12 13 14 15 16 17 18 19 20 21 22
Days
Figure 3. Daily basis time series analysis of online product shopping.
Monthly Basis Analysis
450000
400000
Product Purchasing Records
350000
300000
250000
200000
150000
100000
50000
0
Feb Mar Apr May June July Aug Sep Oct Nov Dec
Months
Figure 4. Monthly basis time series analysis of online product shopping.
3.3.2. User Interest Analysis
Each user who visited online shopping websites has some preferences for shopping. In this
analysis, we extract the most purchased products based on users’ shopping records. The most
purchased item shows the users preferences and interest and mostly the quality of the product.
Figure 5 presents the user interest and most visited products for shopping.Symmetry 2020, 12, 1566 9 of 20
User Interest Analysis
16000
Most Purchased Products
14000
12000
10000
8000
6000
4000
2000
0
Product Name
Figure 5. User interest analysis of online product shopping.
3.3.3. Access Page Analysis
Access page analysis shows the records of the user clicked web pages. The most visited pages
are one of the options for recommending the product provided in that access page. The user clicks
and reviewing products increase the weight of that product for recommending in neighborhood
products. Figure 6 shows the rating of the mentioned accessed page in the collected dataset. One row
is representing the page id and another one representing the number of users visiting that page.
Access Page Analysis
3500
3000
Visiting Records
2500
2000
1500
1000
500
0
90 80 70 60 50 40 30 20 10
Page ID
Figure 6. Various access pages analysis of online product shopping.
3.3.4. Purchased Product Frequency
In the proposed system, analysis of the collected dataset is based on time series frequency
and product types. The time series frequency describes the maximum and minimum visited pages,
maximum and minimum purchased item, user preferences, the most visited dates, the most visited
month, etc. Similarly, based on time series analysis, it is also easier to recognize the product ratio.
Figure 7 presents the flow diagram based on purchased products, frequency, and user interest.
The process of product purchasing divided into three layers. The input layer contains the extracted
valuable features out of raw data. After encoding, the extracted features are passed on to the analysis
layer and analysis techniques are applied on the product dataset purchased. Finally, the system
visualizes and classifies online shopping products.Symmetry 2020, 12, 1566 10 of 20
Figure 7. Block diagram for purchased product analysis based on product frequency, purchased,
and interest.
4. Proposed Extreme Gradient Boosting and Encoding Approach for Online
Product Recommendation
This section proposes the predictive recommendation method used for the extracted knowledge
and information in the previous section. A detailed view of the proposed architecture illustrated
in Figure 8. There are multiple layers in the designed architecture. The first layer was designed as
input data. After the following processing techniques, the data passed to the data analysis section.
Data analysis in this procedure was divided into three main analyses: time series analysis, user interest
analysis, and access page analysis. The derived features from the analysis outputs include the user
click information, each item purchased by the user, etc. The process data was used to generate the
word2vec encoding technique. The generated information is used as an input of the XGBoost prediction
layer. The prediction process was used to generate the neighbor items based on the user click history.
We compare the XGBoost algorithm result with other machine learning algorithms like “random
forest”, “support vector regressor”, and “linear regressor”, where XGBoost performed the best.
Input Data
Word2vec Based Framework
Product1 Product Product Product
ID 2 ID n ID n+1 ID
Access
User Product
point
Product Sum
Access Page
User Ip Name
Product Access
Type Time
Encoded ID
User Click
Information Product ID Access Date
Data Pre-Processing Predictive Analysis
Processed
Data Cleaning Data Format Conversion Data
Data Analysis
Time Series User Interest Analysis Access Page
Analysis Analysis
Purchased User
Daily
Products Clicks
Quality of Visited
Monthly
Products Pages
Recommendation
Rate of
Yearly Page ID
Products
Product 1 Product 2 ……. ……. Product n
Figure 8. Proposed system architecture.Symmetry 2020, 12, 1566 11 of 20
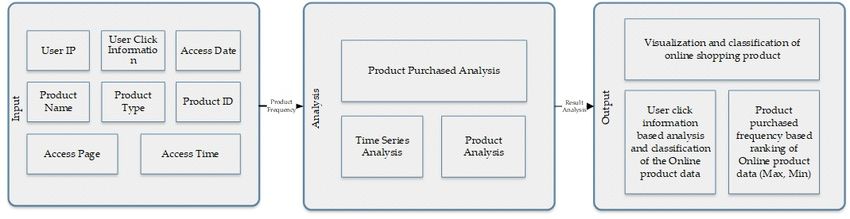
4.1. XGBoost
XGBoost is one of the powerful boosting algorithms in the machine learning system.
This algorithm can predict, classify, and optimize the defined system with the highest accuracy based
on the data structure. Recommended products in this system contain the combination of classification
and prediction results by applying the collaborate filtering technique. The item-based collaborate
filtering process is predicting the rate of the clicked products, evaluating the rate of neighbor products
at the same time. If the neighbor products are very equivalent to user preferences, then the target
product has also the same stage for recommending to the user. The differences between products
prediction weight are effective in getting better prediction and recommendation results. To know the
probability of possible predictions for products, we need to get the true values, which are defined as
Equation (1):
[ Pα , P1−α ] (1)
The basic statement of XGBoost prediction defined in Equation (2). The probability of the
observations zi and λi is distributed ordinary and similarly independent:
φi = θ2 zi + θ1 + λi , i = 1, . . . , M (2)
Generally, the probability of recommendation contains an error rate during the process too.
Decreasing the error rate of prediction processes likelihood requires increasing to evaluate the
coefficient of θi . Equation (3) defines prediction error rate decrease:
M−1
ψ̂ = argmin Σi (φi − θ1 − θ2 zi )2 (3)
M
4.2. Random Forest
The Random Forest algorithm (RF) is one of the famous learning methods which is represented
as an extremely outstanding and powerful technique in a machine learning system for classification
problem. The main idea is to apply RF classification on a recommendation system to extract the top
highly related products based on user preference. The classification technique in RF contains a few
phases mentioned in the following steps:
• Bootstrap the random sampling approach to recapture the P training set out of the raw data with
the same size.
• Develop the RF regression model to apply in a bootstrap training set based on P decision tree.
• Combine all independent P decision trees to improve the regulation of RF.
Equation (4) presents the RF regression model:
P =1
1
h( x ) =
P ∑ h(y, λP ) (4)
n
4.3. Support Vector Regressor
Support vector machine (SVM) is one of the machine learning algorithms, which is also defined as
regression models and is known as support vector regressor (SVR). SVR is also another classification
algorithm with some differences from other mentioned algorithms. It is popular as a fast-developing
strategy among machine learning algorithms. The main concept of SVR is on a regression model.
It operates the support vector machine for prediction purposes of the system. One of the differences
between SVR and other machine learning algorithms is that it tries to fit the best line inside the
predefined error values.Symmetry 2020, 12, 1566 12 of 20
4.4. Linear Regressor
A linear regression model is defined to find the relationship between target variables by fitting
data into linear equations. Each variable is regarded as an ex-positive variable, and the rest is defined
as dependent variables. The first type of regression model that has been used mainly in practical
applications is the linear regression. There are generally two types of models, one which is linearly
related to their parameters unknowingly and is easy to fit than the second model, which are nonlinearly
dependent. For the first model, the estimators are also easy to determine. Therefore, linear regression
has been preferable.
5. Implementation and Testing Environment
In this section, the implementation, development environment, and the prediction results of the
proposed recommendation system and predictive analysis model are presented. The remainder of this
section includes the detailed process of experimental set up of the processed environment, total model
structure, and comparison of our model result with other baselines.
5.1. Experimental Setup
The experimental setup is summarized in Table 4. All experiments and results of the system
are carried out using Intel(R) Core(T.M.) i7-8700 CPU @3.20 GHz processor with 32 GB memory.
The collaborate filtering algorithm was used for recommendation systems. The XGBoost machine
learning algorithm was used for the classification and prediction process. Similarly, the library and
framework used in the proposed system was the Jupyter notebook. The programming language used
in the designing of this system was WinPython–3.6.2, and the encoding approach was word2vec.
Table 4. System components and specification.
Component Description
Programming language WinPython 3.6.2
Operating system Windows 10 64bit
Browser Google Chrome, opera
Library and framework Jupyter notebook
CPU Intel(R) Core(TM) i7-8700 CPU@3.20 GHz
Memory 32 GB
Machine learning algorithm XGBoost
Distribution modeling algorithm CoreNLP’s MaxEnt
Recommendation method Collaborate filtering
Encoding Word2vec
5.2. Performance Evaluation
Various performance measurement operates for evaluation of the regression problem. In this
paper, we applied a statistical evaluation measurement to specify the constructiveness of our model.
e.g., Mean Square Error (MSE), Mean Absolute Error (MAE), and Root Mean Square Error (RMSE).
• Mean Absolute Error (MAE): operated for evaluating the measure between actual values and
predictive values. It is showing the differences between the target value and the predicted value.
Equation (5) presents the evaluation of MAE:
∑in=1 | Xi − X̂i |
MAE = (5)
nSymmetry 2020, 12, 1566 13 of 20
• Mean Square Error (MSE): takes the square of differences between the actual value and evaluated
value. The reason for taking the square is to drop the negative values. Equation (6) presents the
evaluation of MSE:
∑n ( Xi − X̂i )2
MSE = i=1 (6)
n
• Root Mean Square Error (RMSE): detects the error rate from the regression model and checks the
error size with the size of the target value. Equation (7) presents the evaluation of RMSE:
s
∑in=1 ( Xi − X̂i )2
RMSE = (7)
n
6. Results and Discussion
This section presents the online product recommendation analysis and results based on the user’s
purchased products and clicks sequence. In Section 6.1, we present the word2vec recognition rate and
computation time testing the model ten times. In Section 6.2, we report the accuracy of the proposed method
and compare it with other models and, finally, the recommendation results presented in Section 6.3.
6.1. Word2vec Recognition Rate and Computation Time
Word2vec is a two-layer neural network which generates data in vector space. The proposal for
using the word2vec approach in this system is to generate the nearest neighbor products based on user
purchasing record and click sequences. Figures 9 and 10 show the recognition rate and computation
time of the proposed system. We test our algorithm ten times to get the best rating of the system.
Word2vec Rating Result
0.875
0.87
0.865
Recogntion Rate
0.86
0.855
0.85
0.845
0.84
0.835
1 2 3 4 5 6 7 8 9 10
Ten Times Testing
Figure 9. Recognition rate of ten times training the word2vec approach.Symmetry 2020, 12, 1566 14 of 20
Word2vec Different Time Unit
0.25
Computation Time Per Second
0.2
0.15
0.1
0.05
0
1 2 3 4 5 6 7 8 9 10
Ten Times Testing
Figure 10. Computation time of ten times training the word2vec approach.
6.2. Accuracy
In this section, we present the experimental results of the extreme gradient boosting algorithm.
In this process, we used the top 10 predicted products based on user clicks, preferences, and purchases.
The mentioned extreme gradient boosting algorithm implemented in the winpython environment.
Figure 11 shows the performances of the operated model such as MAE, MSE, and RMSE.
Performance Evaluation of Linear Regression Performance Evaluation of XGBoost Model
Model 12
MSE, 10.92
200 MSE, 188.22
10
180
160
RMSE, 137.19 8
140
120
6
100
80 4
60 MAE, 46.18
MAE, 1.71 RMSE, 2.01
40 2
20
0 0
MAE MSE RMSE MAE MSE RMSE
Performance Evaluation of SVR Model Performance Evaluation of RF Model
45 160 MSE, 149.85
MAE, 40.18
40 140
RMSE, 122.41
35
120
30
100
25
80
20
MSE, 15.18 60
15
MAE, 37.94
10 40
RMSE, 6.8
5 20
0 0
MAE MSE RMSE MAE MSE RMSE
Figure 11. Performance evaluation of predictive analysis techniques.Symmetry 2020, 12, 1566 15 of 20
6.3. Recommendation Results
Based on the process on previous sections and generating the output for XGBoost prediction,
classification, and regression results, the nearest products based on user purchased items and click
information are represented in Table 5. The results are based on the word2vec technique. Each table
contains five columns which represent the brief information about product recommendation—p_values
mean predicted values and T_values mean true values. The nearest item column represents the
neighbor columns. In this table, we mention the five nearest products based on user preference.
The comparison between recommended products and predicted values shows the effectiveness of
this system if the recommendation is true or false. For further explanation, this process is not limited
to recommending products. The recommendation is all based on user behavior in the system. If the
recommendation results contain unrelated products, this means, in user click history, that all the click
information is not limited to one category and user clicks and visited various product pages.
Table 5. Five nearest recommended products based on word2vec.
Number p_Values T_Values Nearest Items True-False
−0.113342576, −0.125291, −0.13030365,
0 −0.113343 −0.113343 True
−0.13983913, −0.07688699
−0.6284744, −1.6290022, −1.627472,
1 −1.62847 −1.96709 False
−1.6302885, −1.6263606
−0.4820903, −0.48359835, −0.49221513,
2 −0.48209 −0.48209 True
−0.49648649, −0.5072997
−1.2501693, −1.2499492, −1.2490119,
3 −1.25017 −1.25017 True
−1.2488393, −1.2487884
−0.49648649, −0.49221513, −0.5072997,
4 −0.496486 −0.496486 True
−0.48359835, −0.4820903
−0.75686, −0.760595, −0.7530531,
5 −0.75686 −0.75686 True
−0.7621504, −0.7632347
In every recommendation system, to generate the system after normalizing data, it is supposed
to give the real product name or id too. Table 6 shows the real product id after the recommendation
process. The presented table converts the predicted product numbers into real product numbers using
the methods mentioned. Based on the data encoding process, the last two columns represent the
encoded product number and the real product number.
Table 6. Converting recommendation results into real product numbers based on word2vec.
Number p_Values T_Values Nearest Items Real Item Number
−0.113342576, −0.125291, 1547193062, 1547193151,
0 −0.113343 −0.113343
−0.13030365 1547193891
1 −1.62847 −1.96709 −0.6284744, −1.6290022, −1.627472 469978264, 445936283, 247719490
−0.4820903, −0.48359835, 1547017446, 557529870,
2 −0.48209 −0.48209
−0.49221513 1547018010
−1.2501693, −1.2499492, 1543286117, 481211872,
3 −1.25017 −1.25017
−1.2490119, 445935227
−0.49648649, −0.49221513, 1531787589, 377348171,
4 −0.496486 −0.496486
−0.5072997 456099192
1531787589, 377348171,
5 −0.75686 −0.75686 −0.75686, −0.760595, −0.7530531
456099192
Figure 12 contains the confusion matrix of the proposed system. The confusion matrix is based on
predicted and test values. The left column presents the test values, and the top column presents the
predicted values. The colors in this figure show highly related values.Symmetry 2020, 12, 1566 16 of 20
Figure 12. Confusion matrix.
Comparative Analysis
Based on the proposed recommendation system, we compare the achieved results with recently
proposed systems in product recommendations. Figure 13 shows the other approaches’ comparison
with the proposed system. As it shows in Figure 13, we compare our results with three related
publications [74–76]. In the first related study, the proposed approach is using the PMF model for a
recommendation system, and the proposed model successfully obtained the accuracy of 0.72 percent
for a recommendation. The second approach applied the C-Means technique and got a relatively better
result than the previous approach, around 0.78 percent. The final study applied the EHCF approach in
recommendation systems and obtained an accuracy of 0.794. All of the mentioned studies are recently
proposed models. The proposed system results show that the XGBoost-based recommendation model
has a much better result than other approaches.
Result Comparision
1
0.9
0.8
Accuracy Rates
0.7
0.6
0.5
0.4
0.3
0.2
0.1
0
XGBoost-
PMF C-Means EHCF
based Model
Proposed
Zhihua Cui Logesh Chen
System
Accuracy (%) 0.72 0.798 0.794 0.896
Various Techniques and Comparision Table
Figure 13. Related studies comparison.Symmetry 2020, 12, 1566 17 of 20
7. Conclusions
Collaborative filtering based (CF) recommendation systems have been widely utilized by various
e-commerce organizations in order to increase their product sales and satisfy their customers. The CF
assumes that two like-minded people are most likely to exhibit a similar likeness pattern in the
future. The contemporary state-of-the-art on CF has presented classification and prediction accuracy
of different proposed models. However, none of them have presented collectivity. For instance,
if classification accuracy is good, then prediction accuracy declines and vice versa. This prevents
CF from being a generalized recommender system. In this paper, we have proposed XGBoost-based
collaborate filtering product recommendations to evaluate the performance of CF recommendations
based on user profile and click information. The proposed approach follows an idea that the
recommendation of those items that have already been purchased must be filtered prior to prediction.
The proposed system has extracted the items purchased by a user to improve the accuracy of prediction
and classification of the model. The data preparation and processing are relying on a word2vec
technique which plays an important role in data normalization. Comparison between recent related
studies and our proposed XGBoost recommendation model shows the outstanding performance of our
model. The system recommends nearest products based on product prediction weight. In the future,
we would take into consideration the user session details and how they can impact the accuracy of the
recommendation model.
Author Contributions: Conceptualization, D.H.; data curation, Z.S. and S.P.; formal analysis, S.P.; funding
acquisition, Y.C.B.; methodology, Z.S.; project administration, Y.C.B.; software, S.P.; supervision, Y.C.B.; validation,
D.H.; writing—original draft, Z.S. All authors have read and agreed to the published version of the manuscript.
Funding: This work was supported by the Korea Institute for Advancement of Technology (KIAT) grant funded
by the Korea Government(MOTIE) (N0002327, The Establishment Project of Industry-University Fusion District).
Conflicts of Interest: The authors declare no conflict of interest.
References
1. Lee, H.I.; Choi, I.Y.; Moon, H.S.; Kim, J.K. A Multi-Period Product Recommender System in Online Food
Market based on Recurrent Neural Networks. Sustainability 2020, 12, 969. [CrossRef]
2. Protasiewicz, J.; Pedrycz, W.; Kozłowski, M.; Dadas, S.; Stanisławek, T.; Kopacz, A.; Gał˛eżewska, M.
A recommender system of reviewers and experts in reviewing problems. Knowl.-Based Syst. 2016, 106, 164–178.
[CrossRef]
3. Kotkov, D.; Wang, S.; Veijalainen, J. A survey of serendipity in recommender systems. Knowl.-Based Syst.
2016, 111, 180–192. [CrossRef]
4. Sardianos, C.; Ballas Papadatos, G.; Varlamis, I. Optimizing parallel collaborative filtering approaches for
improving recommendation systems performance. Information 2019, 10, 155. [CrossRef]
5. Sarwar, B.; Karypis, G.; Konstan, J.; Riedl, J. Item-based collaborative filtering recommendation algorithms.
In Proceedings of the 10th international conference on World Wide Web, Hong Kong, China, 1–5 May 2001;
pp. 285–295.
6. Chen, T.; Sun, Y.; Shi, Y.; Hong, L. On sampling strategies for neural network-based collaborative filtering.
In Proceedings of the 23rd ACM SIGKDD International Conference on Knowledge Discovery and Data
Mining, Halifax, NS, Canada, 13–17 August 2017; pp. 767–776.
7. Thakkar, P.; Varma, K.; Ukani, V.; Mankad, S.; Tanwar, S. Combining user-based and item-based collaborative
filtering using machine learning. In Information and Communication Technology for Intelligent Systems; Springer:
Berlin, Germany, 2019; pp. 173–180.
8. Guo, G.; Zhang, J.; Yorke-Smith, N. Trustsvd: Collaborative filtering with both the explicit and implicit
influence of user trust and of item ratings. In Proceedings of the Twenty-Ninth AAAI Conference on
Artificial Intelligence, Austin, TX, USA, 25–30 January 2015.
9. Deshpande, M.; Karypis, G. Item-based top-n recommendation algorithms. ACM Trans. Inf. Syst. (TOIS)
2004, 22, 143–177. [CrossRef]Symmetry 2020, 12, 1566 18 of 20
10. Lika, B.; Kolomvatsos, K.; Hadjiefthymiades, S. Facing the cold start problem in recommender systems.
Expert Syst. Appl. 2014, 41, 2065–2073. [CrossRef]
11. Sardianos, C.; Tsirakis, N.; Varlamis, I. A survey on the scalability of recommender systems for social
networks. In Social Networks Science: Design, Implementation, Security, and Challenges; Springer: Berlin,
Germany, 2018; pp. 89–110.
12. Ding, Y.; Li, X. Time weight collaborative filtering. In Proceedings of the 14th ACM International Conference
on Information and knowledge Management, Bremen, Germany, 31 October–5 November 2005; pp. 485–492.
13. Feng, H.; Tian, J.; Wang, H.J.; Li, M. Personalized recommendations based on time-weighted overlapping
community detection. Inf. Manag. 2015, 52, 789–800. [CrossRef]
14. Campos, P.G.; Díez, F.; Cantador, I. Time-aware recommender systems: A comprehensive survey and
analysis of existing evaluation protocols. User Model. User-Adapt. Interact. 2014, 24, 67–119. [CrossRef]
15. Collaborative, K.Y. Filtering with temporal dynamics. Commun. ACM 2010, 53, 89–97.
16. Lathia, N.; Hailes, S.; Capra, L. Trust-based collaborative filtering. In IFIP International Conference on Trust
Management; Springer: Berlin, Germany, 2008; pp. 119–134.
17. Guha, R.; Kumar, R.; Raghavan, P.; Tomkins, A. Propagation of trust and distrust. In Proceedings of the 13th
International Conference on World Wide Web, New York, NY, USA, 17–20 May 2004; pp. 403–412.
18. O’Donovan, J.; Smyth, B. Trust in recommender systems. In Proceedings of the 10th International Conference
on Intelligent User Interfaces, San Diego, CA, USA, 10–13 January 2005; pp. 167–174.
19. Meyer, F. Recommender systems in industrial contexts. arXiv 2012, arXiv:1203.4487.
20. Koren, Y.; Bell, R.; Volinsky, C. Matrix factorization techniques for recommender systems. Computer
2009, 42, 30–37. [CrossRef]
21. Shahbazi, Z.; Jamil, F.; Byun, Y. Topic modeling in short-text using non-negative matrix factorization based
on deep reinforcement learning. J. Intell. Fuzzy Syst. 2020, 39, 753–770. [CrossRef]
22. Jannach, D.; Zanker, M.; Felfernig, A.; Friedrich, G. Recommender Systems: An Introduction; Cambridge
University Press: Cambridge, UK, 2010.
23. Zhang, Z.P.; Kudo, Y.; Murai, T.; Ren, Y.G. Enhancing recommendation accuracy of item-based collaborative
filtering via item-variance weighting. Appl. Sci. 2019, 9, 1928. [CrossRef]
24. Bobadilla, J.; Ortega, F.; Hernando, A.; Gutiérrez, A. Recommender systems survey. Knowl.-Based Syst.
2013, 46, 109–132. [CrossRef]
25. Adomavicius, G.; Tuzhilin, A. Toward the next generation of recommender systems: A survey of the
state-of-the-art and possible extensions. IEEE Trans. Knowl. Data Eng. 2005, 17, 734–749. [CrossRef]
26. Lu, J.; Wu, D.; Mao, M.; Wang, W.; Zhang, G. Recommender system application developments: A survey.
Decis. Support Syst. 2015, 74, 12–32. [CrossRef]
27. Albanese, M.; d’Acierno, A.; Moscato, V.; Persia, F.; Picariello, A. A multimedia recommender system.
ACM Trans. Internet Technol. (TOIT) 2013, 13, 1–32. [CrossRef]
28. Sarwar, B.; Karypis, G.; Konstan, J.; Riedl, J. Analysis of recommendation algorithms for e-commerce.
In Proceedings of the 2nd ACM Conference on Electronic Commerce, Minneapolis, MN, USA, 17–20 October
2000; pp. 158–167.
29. Cho, Y.H.; Kim, J.K. Application of Web usage mining and product taxonomy to collaborative
recommendations in e-commerce. Expert Syst. Appl. 2004, 26, 233–246. [CrossRef]
30. Cho, Y.H.; Kim, J.K.; Kim, S.H. A personalized recommender system based on web usage mining and
decision tree induction. Expert Syst. Appl. 2002, 23, 329–342. [CrossRef]
31. Lawrence, R.D.; Almasi, G.S.; Kotlyar, V.; Viveros, M.; Duri, S.S. Personalization of supermarket product
recommendations. In Applications of Data Mining to Electronic Commerce; Springer: Berlin, Germany,
2001; pp. 11–32.
32. Albanese, M.; Chianese, A.; d’Acierno, A.; Moscato, V.; Picariello, A. A multimedia recommender integrating
object features and user behavior. Multimed. Tools Appl. 2010, 50, 563–585. [CrossRef]
33. Albanese, M.; d’Acierno, A.; Moscato, V.; Persia, F.; Picariello, A. Modeling recommendation as a social
choice problem. In Proceedings of the Fourth ACM Conference on Recommender Systems, Barcelona, Spain,
26–30 September 2010; pp. 329–332.
34. Amato, F.; Gargiulo, F.; Moscato, V.; Persia, F.; Picariello, A. Recommendation of Multimedia Objects for
Social Network Applications. In Proceedings of the EDBT/ICDT Workshops, Athens, Greece, 28 March
2014; pp. 288–293.Symmetry 2020, 12, 1566 19 of 20
35. Albanese, M.; d’Acierno, A.; Moscato, V.; Persia, F.; Picariello, A. A ranking method for multimedia
recommenders. In Proceedings of the ACM International Conference on Image and Video Retrieval, Xi’an,
China, 5–7 July 2010; pp. 311–318.
36. Burke, R. Hybrid web recommender systems. In The Adaptive Web; Springer: Berlin, Germnay, 2007; pp. 377–408.
37. Goldberg, D.; Nichols, D.; Oki, B.M.; Terry, D. Using collaborative filtering to weave an information tapestry.
Commun. ACM 1992, 35, 61–70. [CrossRef]
38. Shahbazi, Z.; Byun, Y.C. Product Recommendation Based on Content-based Filtering Using XGBoost
Classifier. Int. J. Adv. Sci. Technol. 2019, 29, 6979–6988.
39. Papagelis, M.; Plexousakis, D.; Kutsuras, T. Alleviating the sparsity problem of collaborative filtering using
trust inferences. In International Conference on Trust Management; Springer: Berlin, Germany, 2005; pp. 224–239.
40. Jamil, F.; Hang, L.; Kim, K.; Kim, D. A novel medical blockchain model for drug supply chain integrity
management in a smart hospital. Electronics 2019, 8, 505. [CrossRef]
41. Jamil, F.; Iqbal, M.A.; Amin, R.; Kim, D. Adaptive thermal-aware routing protocol for wireless body area
network. Electronics 2019, 8, 47. [CrossRef]
42. Jamil, F.; Ahmad, S.; Iqbal, N.; Kim, D.H. Towards a Remote Monitoring of Patient Vital Signs Based on
IoT-Based Blockchain Integrity Management Platforms in Smart Hospitals. Sensors 2020, 20, 2195. [CrossRef]
43. Jamil, F.; Kim, D.H. Improving Accuracy of the Alpha–Beta Filter Algorithm Using an ANN-Based Learning
Mechanism in Indoor Navigation System. Sensors 2019, 19, 3946. [CrossRef]
44. Jamil, F.; Iqbal, N.; Ahmad, S.; Kim, D.H. Toward Accurate Position Estimation Using Learning to Prediction
Algorithm in Indoor Navigation. Sensors 2020, 20, 4410. [CrossRef]
45. Ahmad, S.; Jamil, F.; Khudoyberdiev, A.; Kim, D. Accident risk prediction and avoidance in intelligent
semi-autonomous vehicles based on road safety data and driver biological behaviors. J. Intell. Fuzzy Syst.
2020, 38, 4591–4601. [CrossRef]
46. Jamil, F.; Kim, D. Payment Mechanism for Electronic Charging using Blockchain in Smart Vehicle. Korea
2019, 30, 31.
47. Shahbazi, Z.; Byun, Y.C. Towards a Secure Thermal-Energy Aware Routing Protocol in Wireless Body Area
Network Based on Blockchain Technology. Sensors 2020, 20, 3604. [CrossRef]
48. Song, H.S.; kyeong Kim, J.; Kim, S.H. Mining the change of customer behavior in an internet shopping mall.
Expert Syst. Appl. 2001, 21, 157–168. [CrossRef]
49. Liu, N.N.; Zhao, M.; Xiang, E.; Yang, Q. Online evolutionary collaborative filtering. In Proceedings of the
Fourth ACM Conference on Recommender Systems, Barcelona, Spain, 26–30 September 2010; pp. 95–102.
50. Sun, J.Z.; Parthasarathy, D.; Varshney, K.R. Collaborative kalman filtering for dynamic matrix factorization.
IEEE Trans. Signal Process. 2014, 62, 3499–3509. [CrossRef]
51. Vinagre, J.; Jorge, A.M. Forgetting mechanisms for scalable collaborative filtering. J. Braz. Comput. Soc.
2012, 18, 271–282. [CrossRef]
52. Zhang, Z.; Kudo, Y.; Murai, T. Neighbor selection for user-based collaborative filtering using covering-based
rough sets. Ann. Oper. Res. 2017, 256, 359–374. [CrossRef]
53. Rosaci, D. Finding semantic associations in hierarchically structured groups of Web data. Formal Asp. Comput.
2015, 27, 867–884. [CrossRef]
54. De Meo, P.; Fotia, L.; Messina, F.; Rosaci, D.; Sarné, G.M. Providing recommendations in social networks by
integrating local and global reputation. Inf. Syst. 2018, 78, 58–67. [CrossRef]
55. Zhang, Z.P.; Kudo, Y.; Murai, T.; Ren, Y.G. Addressing complete new item cold-start recommendation:
A niche item-based collaborative filtering via interrelationship mining. Appl. Sci. 2019, 9, 1894. [CrossRef]
56. Gao, M.; Wu, Z.; Jiang, F. Userrank for item-based collaborative filtering recommendation. Inf. Process. Lett.
2011, 111, 440–446. [CrossRef]
57. Bhatta, R.; Ezeife, C.; Butt, M.N. Mining Sequential Patterns of Historical Purchases for E-commerce
Recommendation. In International Conference on Big Data Analytics and Knowledge Discovery; Springer: Berlin,
Germany, 2019; pp. 57–72.
58. Wei, J.; He, J.; Chen, K.; Zhou, Y.; Tang, Z. Collaborative filtering and deep learning based recommendation
system for cold start items. Expert Syst. Appl. 2017, 69, 29–39. [CrossRef]
59. Zheng, L.; Lu, C.T.; He, L.; Xie, S.; He, H.; Li, C.; Noroozi, V.; Dong, B.; Philip, S.Y. MARS: Memory
attention-aware recommender system. In Proceedings of the 2019 IEEE International Conference on Data
Science and Advanced Analytics (DSAA), Washington, DC, USA, 5–8 October 2019; pp. 11–20.Symmetry 2020, 12, 1566 20 of 20
60. Zhang, Q.; Wang, J.; Huang, H.; Huang, X.; Gong, Y. Hashtag Recommendation for Multimodal Microblog
Using Co-Attention Network. In Proceedings of the Twenty-Sixth International Joint Conference on Artificial
Intelligence IJCAI, Melbourne, Australia, 19–25 August 2017; pp. 3420–3426.
61. Yu, W.; Zhang, H.; He, X.; Chen, X.; Xiong, L.; Qin, Z. Aesthetic-based clothing recommendation.
In Proceedings of the 2018 World Wide Web Conference, Lyon, France, 23–27 April 2018; pp. 649–658.
62. Wu, Y.; DuBois, C.; Zheng, A.X.; Ester, M. Collaborative denoising auto-encoders for top-n recommender
systems. In Proceedings of the Ninth ACM International Conference on Web Search and Data Mining,
San Francisco, CA, USA, 22–25 February 2016; pp. 153–162.
63. Wu, S.; Ren, W.; Yu, C.; Chen, G.; Zhang, D.; Zhu, J. Personal recommendation using deep recurrent neural
networks in NetEase. In Proceedings of the 2016 IEEE 32nd International Conference on Data Engineering
(ICDE), Helsinki, Finland, 16–20 May 2016; pp. 1218–1229.
64. Wang, Q.; Yin, H.; Hu, Z.; Lian, D.; Wang, H.; Huang, Z. Neural memory streaming recommender networks
with adversarial training. In Proceedings of the 24th ACM SIGKDD International Conference on Knowledge
Discovery & Data Mining, London, UK, 19–23 August 2018; pp. 2467–2475.
65. Wang, H.; Xiao, G.; Han, N.; Chen, H. Session-Based Graph Convolutional ARMA Filter Recommendation
Model. IEEE Access 2020, 8, 62053–62064. [CrossRef]
66. Mobasher, B.; Dai, H.; Luo, T.; Nakagawa, M. Improving the effectiveness of collaborative filtering on
anonymous web usage data. In Proceedings of the IJCAI 2001 Workshop on Intelligent Techniques for Web
Personalization (ITWP01), Seatle, WA, USA, 2001; pp. 53–61.
67. Wang, F.H.; Shao, H.M. Effective personalized recommendation based on time-framed navigation clustering
and association mining. Expert Syst. Appl. 2004, 27, 365–377. [CrossRef]
68. Mehta, H.; Bhatia, S.K.; Bedi, P.; Dixit, V.S. Collaborative personalized web recommender system using
entropy based similarity measure. arXiv 2012, arXiv:1201.4210.
69. Nadi, S.; Saraee, M.H.; Bagheri, A. A hybrid recommender system for dynamic web users. Int. J. Multimed.
Image Process. 2011, 1, 3–8. [CrossRef]
70. Nasraoui, O.; Petenes, C. An intelligent web recommendation engine based on fuzzy approximate reasoning.
In Proceedings of the 12th IEEE International Conference on Fuzzy Systems, 2003. FUZZ’03, St Louis, MO,
USA, 25–28 May 2003; Volume 2, pp. 1116–1121.
71. Zhou, B.; Hui, S.C.; Chang, K. An intelligent recommender system using sequential web access patterns.
In Proceedings of the IEEE Conference on Cybernetics and Intelligent Systems, Singapore, 1–3 December
2004; Volume 1, pp. 393–398.
72. Sumathi, C.; Valli, R.P.; Santhanam, T. Automatic recommendation of web pages in web usage mining. Int. J.
Comput. Sci. Eng. 2010, 2, 3046–3052.
73. Khribi, M.K.; Jemni, M.; Nasraoui, O. Automatic recommendations for e-learning personalization based on
web usage mining techniques and information retrieval. In Proceedings of the 2008 Eighth IEEE International
Conference on Advanced Learning Technologies, Santander, Spain, 1–5 July 2008, pp. 241–245.
74. Cui, Z.; Xu, X.; Xue, F.; Cai, X.; Cao, Y.; Zhang, W.; Chen, J. Personalized recommendation system based on
collaborative filtering for IoT scenarios. IEEE Trans. Serv. Comput. 2020, 13, 685–695. [CrossRef]
75. Logesh, R.; Subramaniyaswamy, V.; Malathi, D.; Sivaramakrishnan, N.; Vijayakumar, V. Enhancing
recommendation stability of collaborative filtering recommender system through bio-inspired clustering
ensemble method. Neural Comput. Appl. 2020, 32, 2141–2164. [CrossRef]
76. Chen, C.; Zhang, M.; Zhang, Y.; Ma, W.; Liu, Y.; Ma, S. Efficient Heterogeneous Collaborative Filtering
without Negative Sampling for Recommendation. In Proceedings of the AAAI Conference on Artificial
Intelligence, New York, NY, USA, 7–8 February 2020; Volume 34, pp. 19–26.
c 2020 by the authors. Licensee MDPI, Basel, Switzerland. This article is an open access
article distributed under the terms and conditions of the Creative Commons Attribution
(CC BY) license (http://creativecommons.org/licenses/by/4.0/).You can also read