The Finnish National Seismic Network: Toward Fully Automated Analysis of Low-Magnitude Seismic Events - University of Helsinki
←
→
Page content transcription
If your browser does not render page correctly, please read the page content below
Focus Section: European Seismic Networks

              The Finnish National Seismic Network:
              Toward Fully Automated Analysis of
              Low-Magnitude Seismic Events
              Toni Veikkolainen*1, Jari Kortström1, Tommi Vuorinen1, Ilmo Salmenperä1, Tuija Luhta1,
              Päivi Mäntyniemi1, Gregor Hillers1, and Timo Tiira1

                  Abstract
                  We present an overview of the seismic networks, products, and services in Finland,                                                     Cite this article as Veikkolainen, T.,
                                                                                                                                                         J. Kortström, T. Vuorinen, I. Salmenperä,
                  northern Europe, and the challenges and opportunities associated with the unique com-
                                                                                                                                                         T. Luhta, P. Mäntyniemi, G. Hillers, and
                  bination of prevailing crystalline bedrock, low natural intraplate seismic background                                                  T. Tiira (2021). The Finnish National
                  activity, and a high level of anthropogenic seismicity. We introduce national and local                                                Seismic Network: Toward Fully Automated
                                                                                                                                                         Analysis of Low-Magnitude Seismic
                  seismic networks, explain the databases, analysis tools, and data management con-                                                      Events, Seismol. Res. Lett. XX, 1–11,
                  cepts, outline the Finnish macroseismic service, and showcase data from the 2017                                                       doi: 10.1785/0220200352.

                  M 3.3 Liminka earthquake in Ostrobothnia, Finland.                                                                                     Supplemental Material

              Introduction                                                                                    from these stations are integrated in the daily seismic analysis
              The first serious intent to join the international activities of the                            and research at the National Seismological Data Center at ISUH.
              new discipline of seismology was proposed at the meeting of                                     One station in the Åland archipelago in southwestern Finland is
              the Geographical Society of Finland on 24 May 1902 (Simojoki,                                   operated by the Swedish National Seismic Network. Figure 1
              1978). It was only after Finland gained its independence in                                     shows these stations on a map with earthquakes in Finland and
              1917, however, that these plans were successfully implemented.                                  adjacent areas.
              A seismic station equipped with Mainka seismographs was in                                          Bilateral agreements allow for data exchange from stations
              operation in the Finnish capital Helsinki from 1924 to the early                                close to the Finnish border collected by seismological agencies
              1960s. This became the main Finnish contribution to global                                      in the neighboring countries Sweden, Norway, Estonia, and
              seismology in the early instrumental era. The International                                     Russia. These data reduce the azimuthal gaps and thus improve
              Geophysical Year of 1957–1958 gave an incentive to the                                          the detection and location of the seismic events that occur in
              deployment of various geophysical instruments in the country,                                   Finland. In southern Finland, data from the Estonian network
              including seismographs (Pirhonen, 1996), which facilitated                                      (EE) and in northern Finland data from the Norwegian (NS
              short-period seismology and the monitoring of local seismic                                     and NO) (University of Bergen, 1982) and Swedish (UP)
              events. The Comprehensive Nuclear-Test-Ban Treaty Organi-                                       (University of Uppsala, 1904) networks are frequently used. EE
              zation (CTBTO) was a major reason behind the establishment                                      is operated by the Tallinn University of Technology, NS by the
              of the Institute of Seismology, University of Helsinki (ISUH) in                                University of Bergen, NO by Norwegian Seismic Array, and
              1961 (Luosto and Hyvönen, 2001). The Finnish seismic array                                      UP by Uppsala University. To the east of Finland, data from
              FINES in Sysmä, Central Finland, serves today as one of the 50                                  GEOFON Seismic network (GE) (GEOFON Data Centre,
              global primary monitoring stations of the CTBTO (Coyne et al.,                                  1993) station PUL and IRIS (IDA) (Scripps Institution of
              2012). The modern network has improved seismic event detec-                                     Oceanography, 1986) Network (II) station LVZ are used.
              tion capabilities on the Finnish territory and adjacent areas,                                  Figure 2a shows the azimuthal gap over the region when only
              and frequent local network densifications continue to chal-                                     the permanent Finnish stations are taken into account.
              lenge the associated data processing and management facilities.                                 Figure 2b shows the azimuthal gap for the improved situation
                                                                                                              in which all permanent stations with constant data exchange are
              Current Seismic Networks in Finland                                                             considered. Part of data are routinely transferred to the GEOFON
              In 2020, the Finnish National Seismic Network (FNSN; net-                                       waveform archive hosted by GFZ German Research Centre
              work code HE) (Institute of Seismology, University of Helsinki,                                 for Geosciences and Observatories and Research Facilities for
              1980) consists of 31 permanent seismic stations, including the
              FINES array. Nine stations are part of the Northern Finland                                     1. Institute of Seismology, University of Helsinki, Helsinki, Finland
              Seismic Network (FN) maintained by the Sodankylä Geophysical                                    *Corresponding author: toni.veikkolainen@helsinki.fi
              Observatory, University of Oulu (Kozlovskaya et al., 2016). Data                                © Seismological Society of America

              Volume XX        •   Number XX          •   – 2021      •   www.srl-online.org                                                           Seismological Research Letters            1

Downloaded from http://pubs.geoscienceworld.org/ssa/srl/article-pdf/doi/10.1785/0220200352/5248739/srl-2020352.1.pdf
by University of Helsinki user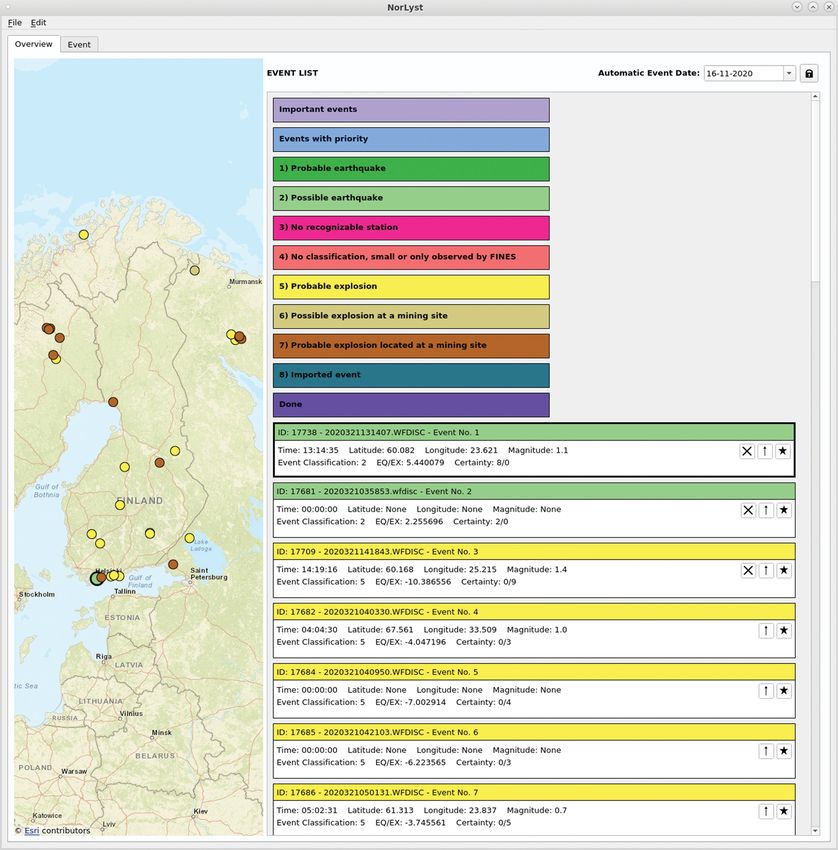
Figure 1. Earthquakes (circle symbols, ML ≥ 0) in Finland and                                   and Kuusamo) and those with network densifications (Helsinki
                  adjacent areas on a map with Finnish seismic stations. Color and                                and Ostrobothnia) are labeled. Earthquake data derive from the
                  circle size scale with the magnitude of the event. Symbols are                                  Fennoscandian Earthquake Catalog (FENCAT), covering years
                  slightly transparent, and for clarity, greater events are plotted                               1375–2014, and ISUH seismic bulletins, covering years 2015–
                  with larger symbols. Areas of notable seismic activity (Kouvola                                 2020.

                  2       Seismological Research Letters                                                               www.srl-online.org   •   Volume XX   •   Number XX   •   – 2021

Downloaded from http://pubs.geoscienceworld.org/ssa/srl/article-pdf/doi/10.1785/0220200352/5248739/srl-2020352.1.pdf
by University of Helsinki user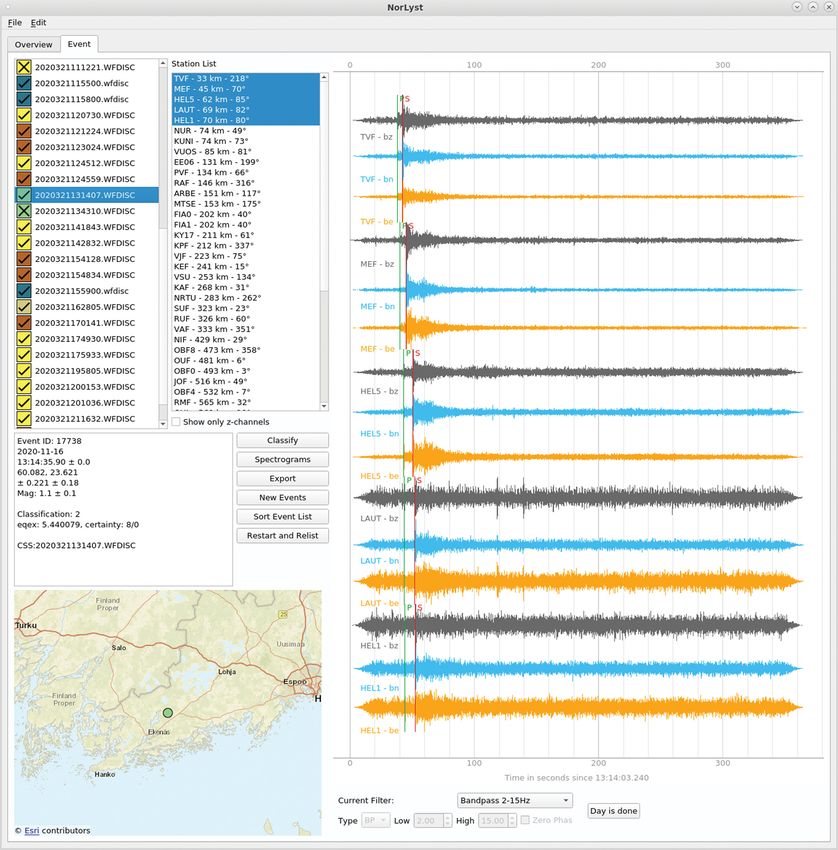
European Seismology. All seismic stations in the HE network are                                 from the Helsinki network follow the same standards as the
              equipped with broadband seismometers. The sensor instrumen-                                     national network. The Helsinki network allows for monitoring
              tation comes from manufacturers Geotech, Güralp, Nanometrics,                                   seismicity in the Helsinki region with lower detection thresh-
              and Streckeisen, whereas the accompanying digitizers are from                                   old and better location accuracy than before and is expected to
              Earthdata and Nanometrics.                                                                      facilitate research on natural and induced seismicity as well as
                  Finland is situated on the Fennoscandian Shield, where the                                  on the numerous explosions associated with infrastructure
              surface area covers some of the most ancient crust of Earth                                     development in urban areas.
              from Precambrian time (Lehtinen et al., 2005). Most seismic
              stations have been deployed on bedrock outcrops, and some                                       Automatic Seismic Data Classification
              FN stations such as OLKF (66.321° N, 29.400° E; see Fig. 1)                                     and Magnitude Determination
              have been installed in boreholes drilled into the bedrock. The                                  In a seismically quiet intraplate region, most seismic events are
              seismic waveform data are of high quality, not only because of                                  explosions. Since May 2010, only local events have been proc-
              state-of-the-art instrumentation but also because of the crys-                                  essed in the daily analysis of the FNSN, except for events from
              talline bedrock and only thin sedimentary layer where it exists                                 known nuclear test sites. Events at a distance >1000 km from
              (Nironen, 2017; Tiira et al., 2020). In contrast, the geology of                                Oulu, Finland (65.017° N, 25.467° E; see Fig. 1) are regarded as
              Estonia, our southern neighbor, is characterized by a sedimen-                                  teleseismic events that are not processed in the daily analysis.
              tary layer hundreds of meters thick that increases toward the                                   Oulu has been selected as the reference location because it is
              south (Raukas and Teedumäe, 1997).                                                              located very close to the geographic center of the analysis area.
                  Data from all seismic stations fuel research activities, in-                                    Until May 2010, teleseismic events were routinely reviewed.
              cluding investigations of postglacial faults, shallow swarm-type                                As real-time data access and seismic data analyses methods
              seismicity, and properties of induced seismicity. Temporary                                     have developed, handpicking data in national data centers was
              local seismic networks have been installed for research pur-                                    no longer needed for global seismic research. The shift of focus
              poses in the Kuusamo and Kouvola regions, which exhibit a                                       of analyses to local seismology had become possible as the
              higher level of natural seismicity compared with other parts of                                 instruments got better and station network denser, providing
              the country (Veikkolainen et al., 2017). In addition, a local net-                              data on higher frequencies and sufficient network coverage to
              work of eight stations has been installed to monitor the site of a                              detect and analyze typically small local events. Detection of
              possible future nuclear power plant in Ostrobothnia, according                                  large global earthquakes is still implemented in the national
              to regulations of the International Atomic Energy Agency                                        natural disaster warning system Luonnononnettomuuksien
              (Vuorinen et al., 2019). Data from the Ostrobothnian deploy-                                    varoitusjärjestelmä (LUOVA) maintained by ISUH in
              ment have been important for developing a ground-motion pre-                                    cooperation with the Finnish Meteorological Institute and the
              diction equation for Fennoscandia (Fülöp et al., 2020). The areas                               Finnish Environment Institute (Säntti and Kortström, 2010)
              of notable seismic interest as well as earthquakes of M L 0.0 and                               under the control of the Finnish Ministry of Transport and
              greater are plotted in Figure 1, along with permanent seismic                                   Communications. No routine analysis of waveform data is car-
              stations in Finland. Probability density functions of power spec-                               ried out in the on-duty LUOVA service except for nuclear tests
              tral density (McNamara and Buland, 2004) for selected stations                                  for which data from the FINES array are used. Waveform data
              show low ambient noise. They are available in Figures S1–S4,                                    from the FINES array are continuously transferred to the head-
              available in the supplemental material to this article.                                         quarters of the CTBTO using a secured satellite network.
                  The use of carbon-neutral sources of energy is on the                                           The automatic seismic event classification tool Automaija
              increase in Finland, and geothermal energy is considered to                                     (Kortström et al., 2016) uses the signal energy distribution of
              have a lot of potential. A consequence is a new focus on urban                                  the incoming waveform data to detect seismic events and to
              areas, which were previously disregarded in seismic monitor-                                    distinguish between natural and anthropogenic events. It
              ing. A semipermanent network of five seismic instruments was                                    calculates a preliminary origin time, location, and magnitude
              deployed around the site of a geothermal heating facility in                                    for each event. It also analyzes the probability for each event to
              Espoo in the Helsinki capital region to monitor induced earth-                                  be an earthquake or explosion and provides timing for iden-
              quakes and to regulate operation during the stimulations in 2018                                tifiable seismic phases. Automaija classifies seismic data into
              and 2020 (Ader et al., 2020). The network was complemented by                                   seven different groups:
              the temporary deployment of dozens of short-period sensors
              arranged in different array configurations (Hillers et al., 2020).                              1. Probable earthquakes
              Data from the temporary networks used in such projects may                                      2. Uncertain classification
              have restricted data access (Hillers et al., 2019).                                             3. No recognizable station (this previously included events
                  Another network consisting of three stations with the same                                     only observed by FINES; this is a legacy category to be
              instrumentation as the national network has been established                                       removed in future)
              in Helsinki following the initiative of the city of Helsinki. Data                              4. No classification, small or only observed by FINES

              Volume XX        •   Number XX          •   – 2021      •   www.srl-online.org                                                 Seismological Research Letters   3

Downloaded from http://pubs.geoscienceworld.org/ssa/srl/article-pdf/doi/10.1785/0220200352/5248739/srl-2020352.1.pdf
by University of Helsinki user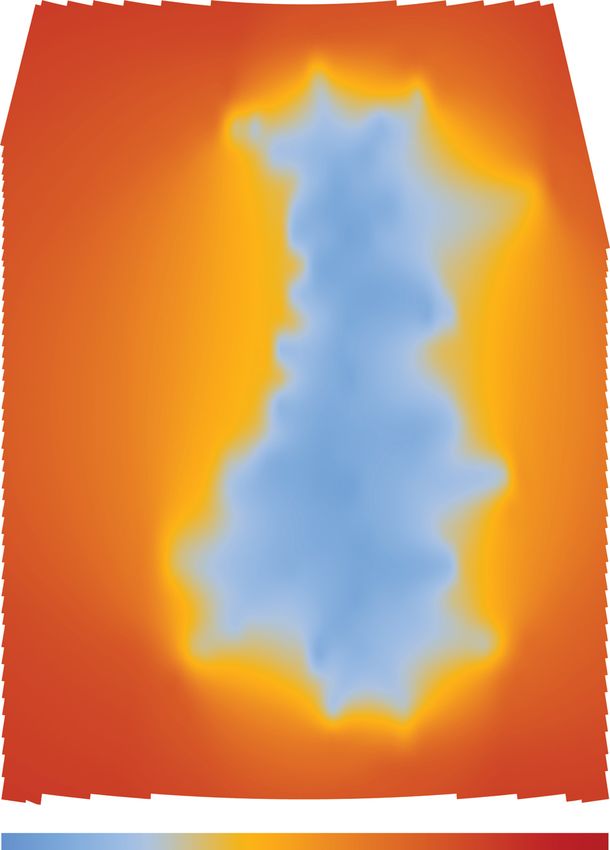
5. Probable explosion                                                                               When M L HEL was introduced in the late 1990s, instru-
                  6. Possible explosion at a mining site                                                          ments were mainly short period, operating with a compara-
                  7. Probable explosion located at a mining site                                                  tively low sampling rate of 20 Hz. Very sparse near-source
                                                                                                                  data are available from this time. Modern broadband seismom-
                      For groups 6 and 7, the system relies on an internal database                               eters with a sampling rate of 40–500 Hz have been deployed
                  of mining sites in the analysis region. A separate flag is given                                since then, and the station density of the network increased in
                  for events for which the closest operating seismic station is any                               tandem, leading to more accurate magnitude estimates.
                  of the Ostrobothnia network stations. The success rate of                                           All individual FNSN stations transmit continuous waveform
                  Automaija classifications is 94%–97% for all data, as deter-                                    data to the ISUH servers at a sampling frequency of 100–250 Hz,
                  mined subsequently by comparing reviewed daily analysis                                         and all FINES array substations at a frequency of 40 Hz. Data are
                  results with automatic determinations. The rate is slightly bet-                                stored in miniSEED archive format, with event files stored sep-
                  ter for events with higher magnitudes and larger depths. The                                    arately in CSS 3.0 format (Anderson et al., 1990). These are fur-
                  daily and weekly distribution of events is utilized to resolve a                                ther processed using the Geotool software (Henson and Coyne,
                  blasting time window for each mine, and signals not associated                                  1993) in the daily analysis. Seismogram data are produced for
                  with natural earthquakes within this time–space window are                                      visual inspection in three time intervals: 0–8, 8–16, and 16–24
                  interpreted as recurring blasts. Successive explosions with a                                   UTC (local time is in the East European Standard Time Zone,
                  very small time interval so that signals overlap may be some-                                   UTC+2). These data are updated hourly. The amplitude of the
                  times mistaken for earthquakes in the fully automatic classifi-                                 ambient noise in the data typically varies with the atmospheric
                  cation process because of misidentification of phases after the                                 and weather conditions. Most permanent stations are situated in
                  first P- and S-wave picks. For shallow events with assigned                                     wind-shielded cabins outside major population centers and
                  fixed depths, more accurate location and depth estimates                                        away from large water bodies. However, an adequate network
                  may be obtained by studying the maximum amplitude ratio                                         geometry means that certain stations are inevitably located close
                  of Rayleigh wave Rg to Sg as done, for example, for swarm-type                                  to the Baltic Sea. The detection threshold of the network is
                  seismicity in the relatively homogeneous Vyborg rapakivi                                        M L 0.9 for the Finnish territory as determined with seismic
                  granite batholith (Uski et al., 2006) in the southeast of Finland.                              network simulations using magnitude and maximum detection
                      Calculation of distance and back azimuth to the epicenter is                                distance (Tiira et al., 2016). The threshold is significantly lower
                  based on travel-time differences of seismic phases and on the                                   in areas with network densifications.
                  ISUH crustal model. For Finnish earthquakes, the automatic                                          In the current ISUH crustal velocity model, the topmost
                  procedure usually estimates location, time, and magnitude                                       granitic layer spans from surface to 15 km depth and the
                  from waveform data better than depth; therefore in automatic                                    basaltic layer from 15 to 40 km, which is the Moho depth. P
                  processing, the depth is always fixed to zero. In manual analy-                                 and S waves refracted from the granitic layer are indicated with
                  ses, the depth is fixed if the standard deviation of depth deter-                               g (Pg, Sg), waves refracted from basaltic layer with b (Pb, Sb), and
                  minations of permanent stations is >30% of the estimated                                        waves refracted from the Moho with n (Pn, Sn). A 3D crustal
                  depth value, if the distance to the closest station is >100 km,                                 velocity model is being developed at ISUH and will be
                  or the azimuthal gap is >180°. The typically used values for fixed                              implemented in the daily workflow of event determination. The
                  depths are 1, 2, 5, 10, and 15 km. In particular, shallow events                                model utilizes results of numerous Finnish structural seismology
                  with clearly discernible surface waves often fall into this category.                           experiments and tomographic studies (e.g., Kukkonen and
                  Although the FNSN is a relatively sparse network, the locations                                 Lahtinen, 2006; Hyvönen et al., 2007; Tiira et al., 2020). It is
                  of its stations have been optimized to keep the azimuthal gap                                   expected to be a significant improvement over the current
                  below 90° over most of the territory. The situation is the poorest                              layer-cake model for providing more accurate location estimates.
                  in eastern Finland (Fig. 2), and data from seismic stations in                                      In 2018 (2019), the FNSN stations detected 19,431 (20,286)
                  northwestern Russia do not improve the situation significantly.                                 seismic events, of which 421 (371) or 2% (2%), were inter-
                  Although the number of seismic stations in this region is reason-                               preted as earthquakes. The overwhelming number of seismic
                  able (Morozov et al., 2019), only the PUL and LVZ stations occa-                                events not classified as earthquakes are explosions, mining-
                  sionally provide waveform data for our analysis.                                                induced events, or unidentified events in the classification
                      All FNSN seismic stations deliver waveform data in vertical,                                scheme used by the institute. The increase of detected events
                  east-west and north-south components. The magnitude used is                                     from 2018 to 2019 is most likely a result of an improved net-
                  the local Helsinki magnitude M L HEL (Uski and Tuppurainen,                                   work that can more easily detect anthropogenic seismic
                  1996), which is always calculated from the vertical component.                                  sources, especially in the Finnish capital region. The decrease
                  The magnitude was originally estimated using the period and                                     of the seismic background noise during the societal restrictions
                  arrival time of Sg phases recorded at stations with distances                                   of the COVID-19 pandemic was also visible in Helsinki and its
                  >150 km from the epicenter, but the method has been further                                     vicinity, in line with global trends (Lecocq et al., 2020), albeit in
                  developed so that it is valid also for shorter distances.                                       a higher frequency band.

                  4       Seismological Research Letters                                                               www.srl-online.org   •   Volume XX   •   Number XX   •   – 2021

Downloaded from http://pubs.geoscienceworld.org/ssa/srl/article-pdf/doi/10.1785/0220200352/5248739/srl-2020352.1.pdf
by University of Helsinki user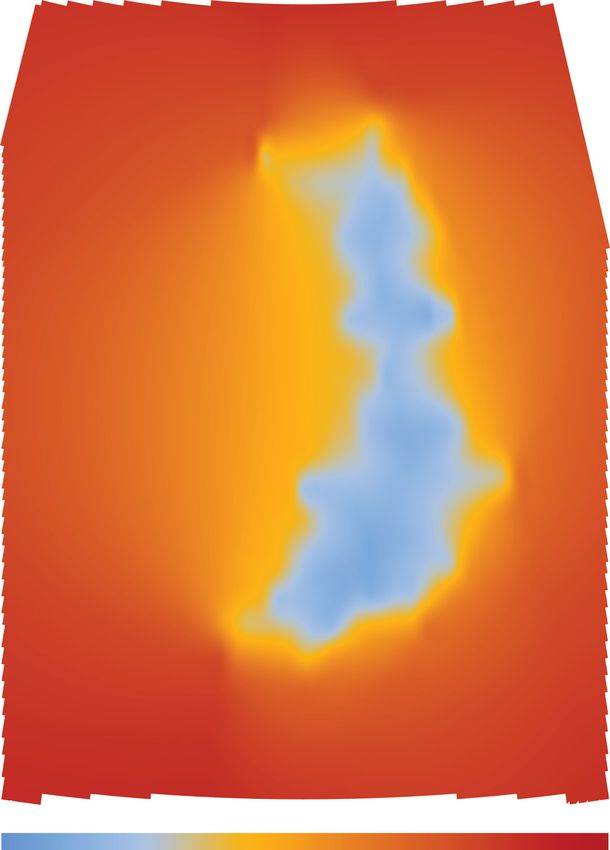
(a) (b)
70˚ 70˚
270
18
0
90
18
0
90
180
90
90
65˚ 65˚
270
180
180
90
90
0
18
90
60˚ 60˚
180
27
0
15˚ 20˚ 25˚ 30˚ 15˚ 20˚ 25˚ 30˚
0 30 60 90 120 150 180 210 240 270 300 330 360 0 30 60 90 120 150 180 210 240 270 300 330 360
Maximum azimuthal gap (°) Maximum azimuthal gap (°)
NorDB Database and NorLyst Analysis Figure 2. (a) Map of permanent seismic stations in Finland. Stations
Tool of network densifications in Ostrobothnia and Helsinki are
excluded. Color scale shows the maximum azimuthal gap of a
Since 2017, the NorDB database has been developed at ISUH to
seismic event recorded by these stations. Because data are
store Nordic format seismic data in a secure and coherent man- transmitted to Finland from nearest stations in neighboring
ner. The database runs on PostgreSQL and Python 3 in Unix- countries as well, the true azimuthal gap in Finnish border regions
based operating systems. It is currently only used internally at is smaller than that visible in the map. See (b) for a map with
ISUH, although it can handle all Nordic format data from other Finnish stations and other stations delivering data to the Institute
countries as well. NorDB is accessible via command line tool, of Seismology, University of Helsinki (ISUH). (b) Map of permanent
seismic stations in Finland (triangles) and adjacent areas
through which most basic functions are available. The Nordic (squares) delivering data to ISUH. Stations of network densifica-
event table is the most important item in the database, linking tions in Ostrobothnia and Helsinki are not shown. Color scale
one seismological event to all relevant metadata. The Nordic shows the maximum azimuthal gap of a seismic event recorded by
event table also links to a Nordic event root table, which links these stations. See (a) for a map with Finnish stations only.
to all different analyses of the same event. These analyses can
include the automatic solution and various analyst-reviewed sol-
utions. This technique ensures that there is no need to delete old azimuthal gap, and minimum distance to a station for all data
records of the event when a new analysis is completed. In addi- from the year 2000 and earlier.
tion, all analyses can adhere to a strict hierarchy by comparing Each solution of a seismic event in NorDB is associated with
their event type. a permanent unique identifier. The same event may have two
In the NorDB structure, each seismic event is read from a or more solutions in the database with different solution types.
file contained in a Nordic filename table. New events from the The currently used values of solution type are:
network are automatically fed to the database using a shell
script that generates a date and timestamp to a creation infor- • F (final),
mation table. Because the script is usually run periodically, cre- • A (automatic),
ation information may be the same for various events with • O (other),
different origin times. Instrumental data related to each event • REV (reviewed event), and
include information about the number of observing stations, • TRASH (duplicates as well as noise and incorrect data).
Volume XX • Number XX • – 2021 • www.srl-online.org Seismological Research Letters 5
Downloaded from http://pubs.geoscienceworld.org/ssa/srl/article-pdf/doi/10.1785/0220200352/5248739/srl-2020352.1.pdf
by University of Helsinki user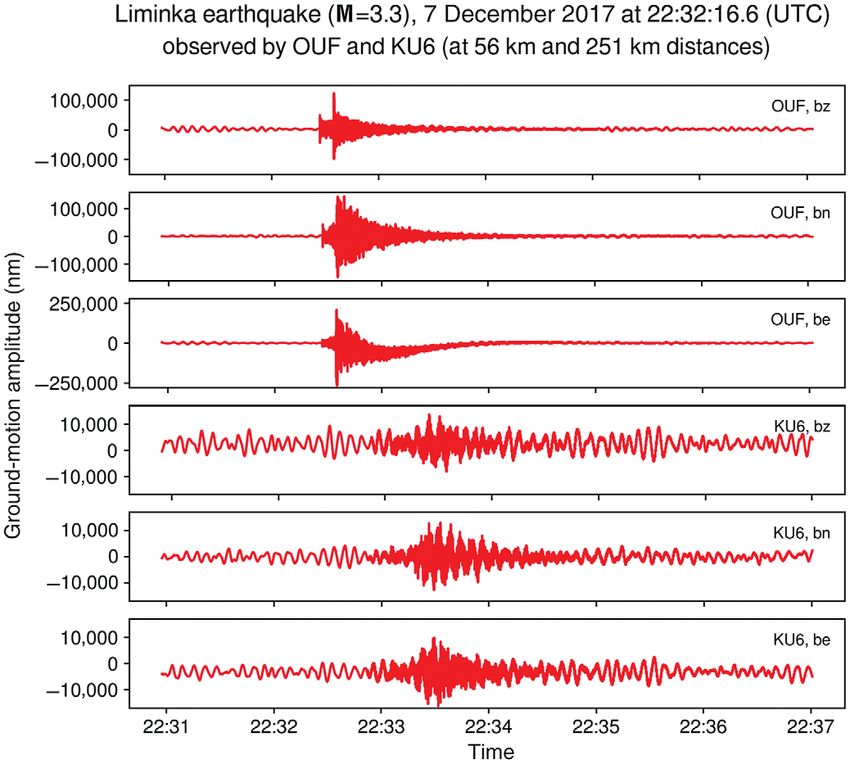
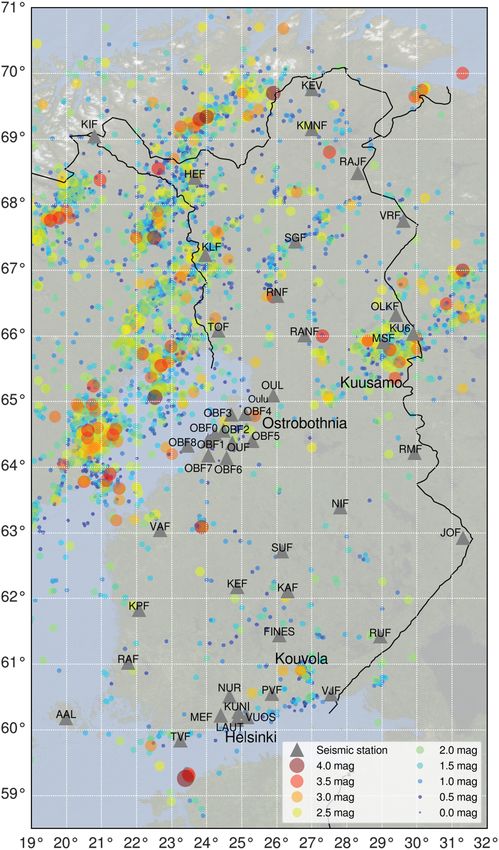
Automatic events (A) are pushed to the database each night                                   Figure 3. Illustration of a daily event list in the user interface of
                  and reviewed in the daily analysis. After the analysis of an                                    NorLyst software. Events from Monday, 16 November 2020 are
                                                                                                                  shown here according to the classification scheme. Each event
                  event, a reviewed solution (REV) is generated, but the auto-
                                                                                                                  class is associated with a specific color in the list and in the map.
                  matic solution for the same event is still retained in the data-
                  base. Final event solutions (F) are generated when seismic
                  bulletins are constructed, but the two other solutions (A)                                          The seismic analysis tool NorLyst fetches data from NorDB.
                  and (REV) are also retained in this situation. The user may                                     It features a graphical user interface based on PyQt5 (Figs. 3
                  also add new solution types to the database. In addition to sol-                                and 4), allowing the user to filter seismograms, view spectra,
                  ution types, solution tags may be added to the database in the                                  and carry out other core analysis tasks.
                  future. Tags are intended for distinguishing project data from                                      The focus of analysis is nowadays on the verification of auto-
                  other data.                                                                                     matically detected events rather than picking events manually.

                  6       Seismological Research Letters                                                               www.srl-online.org   •   Volume XX   •   Number XX   •   – 2021

Downloaded from http://pubs.geoscienceworld.org/ssa/srl/article-pdf/doi/10.1785/0220200352/5248739/srl-2020352.1.pdf
by University of Helsinki user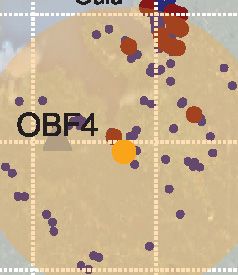
Fully manual analysis is conducted for earthquakes and excep-                                   Figure 4. Illustration of a confirmed earthquake from Raasepori,
              tionally large or otherwise interesting societally relevant seismic                             southern Finland, on 16 November 2020 in the user interface of
              events, such as mine collapses or events that could be induced by                               the NorLyst software. Waveform data and automatic phase picks
                                                                                                              for stations that have registered the event are available by
              other engineering activity. In June 2020, the analysts of the insti-
                                                                                                              selecting events in the list. Phase picks are denoted by green and
              tute began using NorLyst for reviewing events that do not                                       red colors. In the event list, colors are the same as in Figure 3.
              require manual picking of seismic phases. Most of these are                                     HEL1 and HEL5 are temporary stations in the Finnish capital
              explosions from mines in Finland and adjacent areas. Geotool                                    region.
              is still used for manual picking of seismic phases, and manually
              analyzed Nordic files are typically imported to NorLyst before
              the completion of the daily analysis in NorLyst.
                  The stable version of NorDB runs on a database server at
              ISUH and automatic backups are generated to a server in a

              Volume XX        •   Number XX          •   – 2021      •   www.srl-online.org                                                 Seismological Research Letters   7

Downloaded from http://pubs.geoscienceworld.org/ssa/srl/article-pdf/doi/10.1785/0220200352/5248739/srl-2020352.1.pdf
by University of Helsinki user
remote location once a day. Development of the database con- era. The Lurøy, Norway, earthquake of 31 August 1819 is an
tinues, and the data structure, which now closely follows the illustrative example (Mäntyniemi et al., 2020).
Nordic format, may be updated in the future. For example, the
need for calculating more than three magnitudes for a certain The 2017 M 3.3 Liminka Earthquake: An
event will be considered. Other development targets include Example of Collecting Waveform and
the removal of the need for reconfiguring NorDB for a certain Macroseismic Data
user after installing a version update and the direct transfer of Waveform data from all permanent seismic stations in Finland
macroseismic data to the database. can be conveniently processed using ObsPy modules of the
Python language (Krischer et al., 2015). Here, we present an
Macroseismic Observatory Practice in example of handling waveform data from one of the deepest
Finland earthquakes in Finland. It occurred in Liminka, northern
Macroseismology is an important interface between the seis- Ostrobothnia, on 7 December 2017 at 22:32:16.6 UTC (8
mological community and the general public. The crystalline December at 00:32:16.6 local time) and was assigned a local
bedrock and low attenuation of seismic waves make it possible magnitude of 3.3. It was the strongest earthquake in Finland
for the local population to observe and experience even since the M L 3.5 Kuusamo event of 15 September 2000. The
low-magnitude seismic events. Since the turn of the 2000s, Liminka event was located at 64.785° N, 25.370° E, at the
an online macroseismic questionnaire is maintained on the boundary of mudstone-dominated lithology in the north and
ISUH website, available in Finnish, Swedish, and English. granitoid-dominated lithology in the south. This is 25 km
Submission of an observation automatically transfers it to a south-southwest of downtown Oulu and 10 km north-
spreadsheet file at the server. Seismologists and seismic northeast of the nearest known surface fault, yet the true
analysts handle the data according to the General Data distance to this fault may differ because the event was as deep
Protection Regulation of the European Union. All personal as 32 km as estimated from data of OBF0–OBF8 stations
information is removed 30 days after the submission. Prior (Vuorinen et al., 2018). See Figures 5 and 6 for details.
to this, the observer is contacted upon request. Macroseismic As part of the annual reporting of operation and seismic
intensity is not assigned to locations routinely because of the activity in the area monitored by OBF0–OBF8 stations, a
low magnitudes, but the observations are classified into catego- fault-plane solution is available for the earthquake. The solution
ries of “not felt” and “felt” and/or “heard.” Larger-magnitude shows a mainly horizontal dislocation along the strike of the
earthquakes can be subjected to specific macroseismic inves- fault. The fault plane is nearly vertical and in north-
tigations. In the ISUH seismic bulletins, the code “FELT” is northwest–south-southeast direction (strike 333°, dip 87°, rake
used for events observed by citizens. −20°). The auxiliary plane (strike 65°, dip 70°, rake 176°) is an
The online macroseismic data are strongly biased toward unlikely solution considering the local geology. Some uncer-
positive responses, but they are obtained without any survey tainty in the solution is evident because the event was located
launched by seismologists. Combined with the denser net- outside the local network, yet the solution is very similar to sol-
works available today, this means that macroseismic observa- utions for other smaller earthquakes in the same region and is
tions can be associated with very small events, far below M L 1, therefore assumed to reflect the general trend of tectonic struc-
if they are shallow, and close to population centers. Seismic tures in the area. The similarity to the fault plane of the M L 1.3
events observed noninstrumentally in the 2000s include local, earthquake in Lumijoki on 8 October 2018 is particularly impor-
regional, and global earthquakes; induced earthquakes; explo- tant because the epicentral distance between these two events is
sions; cryoseisms; and supersonic booms. Providing an accu- only 14 km (Vuorinen et al., 2018). It is possible that the events
rate reason for the observation has value in situations of occurred on the same fault, particularly because the Lumijoki
sudden confusion and concern by citizens. event also was deep, with a focal depth of 28 km. The azimuth,
In 2019, ISUH received 496 macroseismic observations, 98 as seen from the Liminka event, also follows the trend of faults in
of which could be associated with a known earthquake. Other the area. The fault plane of the Lumijoki earthquake strongly
sources were supersonic booms (19 observations), a sewage resembles that of Liminka event (strike 329°, dip 78°, rake −9°)
plant construction site (30), and quarry explosions (75). For and of the auxiliary plane (strike 61°, dip 81°, rake −168°).
251 observations, no specific source could be identified. ISUH received >500 citizen observations of the Liminka
The second important reason behind continued macroseis- earthquake. These are illustrated in Figure 5. The farthest
mic activities is comparison with preinstrumental earthquakes. observations were over 240 km from the epicenter. In the vicin-
The seismicity record can be extended back in time about three ity, ground shaking was widely felt (intensities IV, IV–V, and V
centuries with the help of preinstrumental data (Mäntyniemi, European Macroseismic Scale-98), but no damage to property
2017a,b). The time span is sufficient to demonstrate that earth- was reported. Instrumental data were available from stations at
quakes with larger areas of perceptibility have occurred in the much longer distances. Figure 6 shows waveform data of the
past, although they have not occurred during the instrumental Liminka earthquake recorded by the Oulainen (OUF) and
8 Seismological Research Letters www.srl-online.org • Volume XX • Number XX • – 2021
Downloaded from http://pubs.geoscienceworld.org/ssa/srl/article-pdf/doi/10.1785/0220200352/5248739/srl-2020352.1.pdf
by University of Helsinki userUniversity) and research insti-
tutions (Geological Survey of
Finland, National Land Survey,
Finnish Meteorological
Institute, VTT Technical
Research Centre of Finland, and
CSC - IT Centre for Science)
with the core task of maintain-
ing geophysical observatories
and laboratories in Finland. In
addition to the University of
Helsinki, the Sodankylä
Geophysical Observatory at the
University of Oulu produces
and delivers seismic data and
services in the FIN-EPOS
framework.
EPOS is the pan-European
research infrastructure for data
in Solid Earth Geophysics, aim-
ing to support a safe and sus-
tainable society. In the Nordic
countries, its implementation
in the form of Nordic EPOS
has been initiated recently, but
the history of Nordic co-opera-
tion in seismology dates further
back. The Nordic Seminars in
Seismology have been organ-
Figure 5. Macroseismic map of the ML 3.3 Liminka earthquake of 7 December 2017. Small blue dots
denote felt observations, and red dots audible ones. The shaded orange circular area has a radius of
ized since 1969 in Finland,
25 km around the epicenter, which is marked with a solid orange dot. Seismic stations are denoted Sweden, Norway, Denmark,
by triangle symbols. Locations of the city of Oulu and other remarkable towns are also shown. and Iceland to provide an
annual forum for interaction
and exchange, and Nordic for-
mat has been applied for seis-
Kuusamo (Riekki) (KU6) stations located 56 km and 251 km mic bulletin data since 1985 to allow convenient data
from the epicenter, respectively. The event was also observed transfer. However, QuakeML is the standard seismological data
by all OBF stations (Valtonen et al., 2013) that were all located format within EPOS. Tools for data conversion between NordicAcknowledgments
The authors thank all contributing to the operation, maintenance, and
expansion of seismic networks in Finland and the Academy of Finland
(the Finnish initiative for the European Plate Observing System [FIN-
EPOS]), Finnish Ministry for Foreign Affairs, the City of Helsinki, and
Fennovoima Inc. for funding. The helpful comments and suggestions
by Editor-in-Chief Allison Bent, Reviewer Emily Wolin, and an anony-
mous reviewer were of great value.
References
Ader, T., M. Chendorain, M. Free, M. T. Saarno, P. Heikkinen, P. E.
Malin, P. Leary, G. Kwiatek, G. Dresen, F. Bluemle, et al.
(2020). Design and implementation of a traffic light system for deep
geothermal well stimulation in Finland, J. Seismol. 24, 991–1014.
Ahjos, T., and M. Uski (1992). Earthquakes in northern Europe in
1375–1989, Tectonophysics 207, 1–23.
Anderson, J., W. E. Farrell, K. Garcia, J. Given, and H. Swanger (1990).
Center for seismic studies version 3 database: Schema reference
manual, Technical Report C90-01, Center of Seismic Studies,
Arlington, Virginia, 61 pp.
Figure 6. Plotted waveform data of Liminka earthquake as Coyne, J., D. Bobrov, P. Bormann, E. Duran, P. Grenard, G. Haralabus,
observed by stations in Oulainen (OUF) and Kuusamo (Riekki)
I. Kitov, and Y. Starovoit (2012). CTBTO: Goals, networks, data
(KU6). Vertical axis shows the ground motion amplitude in
analysis and data availability, in New Manual of Seismological
nanometers and horizontal axis the time in UTC.
Observatory Practice 2 (NMSOP-2), P. Bormann, (Editor),
Deutsches GeoForschungsZentrum GFZ, Potsdam, Germany, 1–41.
Fülöp, L., V. Jussila, R. Aapasuo, T. Vuorinen, and P. Mäntyniemi
the need to install software locally. We also aim at the integration (2020). A ground-motion prediction equation for Fennoscandian
of the online earthquake map to NorDB. nuclear installations, Bull. Seismol. Soc. Am. 110, 1211–1230.
GEOFON Data Centre (1993). GEOFON Seismic Network, Deutsches
Data and Resources GeoForschungsZentrum GFZ, Other/Seismic Network, doi:
The Finnish National Seismic Network (HE) is available at doi: 10 10.14470/TR560404.
.14470/UR044600, the University of Bergen Seismic Network (NS) is Henson, I., and J. Coyne (1993). The Geotool seismic analysis
available at doi: 10.7914/SN/NS, the Swedish National Seismic system, Proc. of the 15th Annual Seismic Research Symposium,
Network (UP) is available at doi: 10.18159/SNSN, the GEOFON Phillips Laboratory Report PL-TR-93-2160, 8–10 September 1993.
(GFZ) German Research Centre for Geosciences Network (GE) is avail- Hillers, G., T. A. T. Vuorinen, E. J. Arola, V. E. Katajisto, M. P.
able at doi: 10.14470/TR560404, and the IRIS (IDA) Seismic Network Koskenniemi, B. M. McKevitt, S. Rezaei, L. A. Rinne, I. E.
(II) is available at doi: 10.7914/SN/II. Access https://www.orfeus-eu.org Salmenperä, P. J. Seipäjärvi, et al. (2019). A 100 3-component
for Observatories and Research Facilities for European Seismology Sensor Deployment to Monitor the 2018 EGS Stimulation in
(ORFEUS). Reviewed FNSN seismic bulletin data obtained from the Espoo/Helsinki, Southern Finland, Dataset, GFZ Data Services,
daily analysis are accessible at https://www.seismo.helsinki.fi/bulletin/ doi: 10.5880/GIPP.201802.1.
list/norBull.html. Final bulletins after magnitude homogenization Hillers, G., T. A. T. Vuorinen, M. R. Uski, J. T. Kortström, P. B.
and addition of data from partner institutes are available from 1991 Mäntyniemi, T. Tiira, P. E. Malin, and T. Saarno (2020).
to June 2018 and preliminary bulletins from July 2018 to recent days. The 2018 geothermal reservoir stimulation in Espoo/Helsinki,
Some figures in this article were generated using Generic Mapping Southern Finland: Seismic network anatomy and data features,
Tools (Wessel et al., 2013) and ObsPy (Krischer et al., 2015). The docu- Seismol. Res. Lett. 91, no. 2A, 770–786.
mentation of NorDB is available at https://nordb.readthedocs Hyvönen, T., T. Tiira, A. Korja, P. Heikkinen, E. Rautioaho, and
.io and is subject to changes during the development of the software. SVEKALAPKO Seismic Tomography Working Group (2007).
Noise levels of seismic stations RMF, PVF, SUF, and VRF were inves- A tomographic crustal velocity model of the central
tigated using PQLX software (https://ds.iris.edu/ds/nodes/dmc/ Fennoscandian Shield, Geophys. J. Int. 168, 1210–1226.
software/downloads/pqlx), and resulting power spectral density prob- Institute Of Seismology, University of Helsinki (1980). HE: The
ability density functions for the period of 1 January to 1 December 2020 Finnish National Seismic Network, GFZ Data Services, doi:
are provided in the form of supplemental material (Figs. S1–S4). All 10.14470/UR044600.
websites were last accessed in December 2020. Korja, A., and T. Vuorinen (2016). FIN-EPOS: Finnish national
initiative of the European Plate Observing System, I. T. Kukkonen,
Declaration of Competing Interests S. Heinonen, K. J. Oinonen, T. K. Arhe, O. Eklund, F. Karell, E.
The authors acknowledge there are no conflicts of interest Kozlovskaya, A. V. Luttinen, R. Lahtinen, and J. Lunkka, et al.
recorded. (Editors), Lithosphere 2016: Ninth Symposium on the Structure,
10 Seismological Research Letters www.srl-online.org • Volume XX • Number XX • – 2021
Downloaded from http://pubs.geoscienceworld.org/ssa/srl/article-pdf/doi/10.1785/0220200352/5248739/srl-2020352.1.pdf
by University of Helsinki userComposition and Evolution of the Lithosphere in Finland: Programme Raukas, A., and A. Teedumäe (1997). Geology and Mineral Resources
and Extended Abstracts University of Helsinki, 30–31. of Estonia, Estonian Academy Publishers, Tallinn, Estonia, 436 pp.
Kortström, J., M. Uski, and T. Tiira (2016). Automatic classification of Rønnevik, C., J. Havskov, T. Utheim, L. Ottemöller, K. Atakan, and J.
seismic events within a regional seismograph network, Comput. Michalek (2019). Nordic format (SEISAN) to QuakeML converter,
Geosci. 87, 22–30. Geophysical Research Abstracts EGU2019-15033.
Kozlovskaya, E., J. Narkilahti, J. Nevalainen, R. Hurskainen, and H. Säntti, K., and J. Kortström (2010). Building the national early warn-
Silvennoinen (2016). Seismic observations at the Sodankylä ing system for natural disasters in Finland: LUOVA Project 2008–
Geophysical Observatory: History, present, and the future, 2010, The 41st Nordic Seminar on Detection Seismology, Aarhus,
Geosci. Instrum. Methods Data Syst. 5, 365–382. Denmark, 30–31.
Krischer, L., T. Megies, R. Barsch, M. Beyreuther, T. Lecocq, C. Caudron, Scripps Institution of Oceanography (1986). IRIS/IDA Seismic
and J. Wassermann (2015). ObsPy: A bridge for seismology into the Network, International Federation of Digital Seismograph
scientific Python ecosystem, Comput. Sci. Discov. 8, 014003. Networks, doi: 10.7914/SN/II.
Kukkonen, I. T. and R. Lahtinen (Editor) (2006). Finnish Reflection Simojoki, H. (1978). The History of Geophysics in Finland 1828-1918,
Experiment FIRE 2001–2005, Geological Survey of Finland, Societas Scientarium Fennica, 157 pp.
Special Paper 43, 247 pp. Tiira, T., T. Janik, T. Skrzynik, K. Komminaho, A. Heinonen, T.
Lecocq, T., S. P. Hicks, K. Van Noten, K. van Wijk, P. Koelemeijer, R. Veikkolainen, S. Väkevä, and A. Korja (2020). Full-scale crustal
S. M. De Plaen, F. Massin, G. Hillers, R. E. Anthony, M.-T. interpretation of Kokkola-Kymi (KOKKY) seismic profile,
Apoloner, et al. (2020). Global quieting of high-frequency Fennoscandian Shield, Pure Appl. Geophys. 177, 3775–3795.
seismic noise due to COVID-19 pandemic lockdown Tiira, T., M. Uski, J. Kortström, O. Kaisko, and A. Korja (2016). Local
measures, Science 369, no. 6509, 1338–1343, doi: 10.1126/scien- seismic network for monitoring of a potential nuclear power plant
ce.abd2438. area, J. Seismol. 20, 397–417.
Lehtinen, M., P. A. Nurmi, and O. T. Rämö (2005). Precambrian University Of Bergen (1982). NS: University of Bergen Seismic
Geology of Finland. Key to the Evolution of the Fennoscandian Network, International Federation of Digital Seismograph
Shield, Developments in Precambrian Geology, Elsevier, Networks, doi: 10.7914/SN/NS.
Amsterdam, The Netherlands, 736 pp. University of Uppsala (1904). UP: Swedish National Seismic Network,
Luosto, U., and T. Hyvönen (2001). Seismology in Finland in the doi: 10.18159/SNSN.
twentieth century, Geophysica 37, 147–185. Uski, M., and A. Tuppurainen (1996). A new local magnitude scale for
Mäntyniemi, P. (2017a). Macroseismology in Finland from the 1730s the Finnish seismic network, Tectonophysics 261, 23–37.
to the 2000s. Part 1: History of the macroseismic questionnaire, Uski, M., T. Tiira, A. Korja, and S. Elo (2006). The 2003 earthquake swarm
Geophysica 52, 3–21. in Anjalankoski, south-eastern Finland, Tectonophysics 422, 55–69.
Mäntyniemi, P. (2017b). Macroseismology in Finland from the 1730s Valtonen, O., M. Uski, A. Korja, T. Tiira, and J. Kortström (2013).
to the 2000s: Part 2: From an obligation of the learned elite to citi- Optimal configuration of a micro-earthquake network, Adv.
zen science, Geophysica 52, 23–41. Geosci. 34, 33–36.
Mäntyniemi, P. B., M. B. Sørensen, T. N. Tatevossian, R. E. Veikkolainen, T., I. T. Kukkonen, and T. Tiira (2017). Heat flow, seis-
Tatevossian, and B. Lund (2020). A reappraisal of the Lurøy, mic cut-off depth and thermal modeling of the Fennoscandian
Norway, earthquake of 31 August 1819, Seismol. Res. Lett. 91, Shield, Geophys. J. Int. 211, 1414–1427.
2462–2472. Vuorinen, T., O. Kaisko, J. Kortström, M. Uski, and T. Tiira (2018).
McNamara, D. E., and R. P. Buland (2004). Ambient noise levels in the Operation and seismic observations of seismic network OBF in
continental United States, Bull. Seismol. Soc. Am. 94, 1517–1527. 2017, Report T-98, University of Helsinki, Institute of
Morozov, A. N., N. V. Vaganova, Y. V. Konechnaya, I. A. Zueva, V. E. Seismology, 38 pp. (in Finnish).
Asming, N. N. Noskova, N. V. Sharov, V. A. Assinovskaya, N. M. Vuorinen, T., P. Seipäjärvi, J. Kortström, M. Uski, and T. Tiira (2019).
Panas, and Z. A. Evtyugina (2019). Recent seismicity in northern Operation and seismic observations of seismic network OBF in 2018,
European Russia, J. Seismol. 24, 37–53. Report T-99, University of Helsinki, Institute of Seismology, 32 pp.
Nironen, M. (Editor) (2017). Bedrock of Finland at the Scale 1:1,000,000 (in Finnish).
—Major Stratigraphic Units, Metamorphism and Tectonic Wessel, P., W. H. F. Smith, R. Scharroo, J. Luis, and F. Wobbe (2013).
Evolution, Geological Survey of Finland, Special Paper 60, 128 pp. Generic Mapping Tools: Improved version released, Eos Trans.
Pirhonen, S. (1996). Seventy years of seismological recording in AGU 94, no. 45, 409–410.
Finland, in Seismograph Recording in Sweden, Norway, – with
Arctic Regions, Denmark – with Greenland, and Finland, R.
Wahlström (Editor), Proc. of the Uppsala Wiechert Jubilee Manuscript received 1 October 2020
Seminar, Uppsala University, Uppsala, Sweden, 22–23 August 1994. Published online 24 February 2021
Volume XX • Number XX • – 2021 • www.srl-online.org Seismological Research Letters 11
Downloaded from http://pubs.geoscienceworld.org/ssa/srl/article-pdf/doi/10.1785/0220200352/5248739/srl-2020352.1.pdf
by University of Helsinki userYou can also read