Maps and Mash-ups: The National Atlas and Google Earth in a Geodata Infrastructure
←
→
Page content transcription
If your browser does not render page correctly, please read the page content below
12th AGILE International Conference on Geographic Information Science 2009                 page 1 of 11
Leibniz Universität Hannover, Germany

Maps and Mash-ups: The National Atlas and Google Earth in
               a Geodata Infrastructure
                               Barend Köbben and Marc Graham
           International Institute for Geo-Information Science and Earth Observation (ITC),
                                        Enschede, The Netherlands

INTRODUCTION

    This paper is about different worlds, and how we try to unite them. The worlds we talk about are
different occurrences or expressions of spatial data in different technological environments: One of
them is the world of National Atlases, collections of complex, high quality maps presenting a nation
to the geographically interested. The second is the world of Geodata Infrastructures (GDIs), highly
organised, standardised and institutionalised large collections of spatial data and services. The third
world is that of Virtual Globes, computer applications that bring the Earth as a highly interactive 3D
representation to the desktops of the masses. These worlds represent also different areas of expertise.
The atlas is where cartographers, with their focus on semiology, usability, graphic communication
and aesthetic design, are most at home. Their digital tools are graphic design software and multimedia
and visualisation toolkits. The GDIs are typically the domain of the (geo-)information scientists and
GIS technicians. Their 'native' technological environment has an IT focus on multi-user databases,
distributed services and high-end client software. Virtual globes are produced by hard-core
informatics specialists: programmers that specialise in real-time 3D rendering of large data volumes,
fast image tiling and texturing, similar to computer gaming technology. Their users however are
mostly not aware of, nor interested in the technology behind the products. They don't need that to be
able to make sensible use of it (again not unlike computer gamers).

     We argue that the users of these three worlds are becoming more and more similar. Most of them
routinely use computer programs to access them. Nowadays, any standard computer connected to the
internet is capable of showing the virtual globes, which not long ago would need the performance of
high-end professional workstations. It therefore can also easily be used to view atlas information, and
cartographers have indeed been making their information available in mass-consumer environments,
first as multimedia presentations on CDs, but nowadays mostly as interactive websites. The web is
also the main distribution platform for GDIs, and around the world policy makers have been
expressing the intention that GDI information should be available and useable for the general public
(the INSPIRE initiative (URL6) is a good example of this). Therefore generally available end-user
applications and websites that show or consume spatial data out of a GDI will likely be more and
more common in the near future.

    In the paper we describe the three worlds mentioned, specifically in the Dutch context. We
introduce Geo-Webservices as the binding technology between them. The RGI-111 project, whose
central goal is the integration of the Dutch National Atlas into the Dutch National Geodata
Infrastructure, is briefly introduced. Then we describe in some more detail our tests to further
integrate these two with the Google Earth virtual globe. We explain how we could not use actual
Dutch National GDI data, because at the time these were not available yet in a useable service form.
Instead we took data of similar granularity and complexity, namely the Dutch portion of Open Street
Map and served them, mimicking the foreseen Dutch GDI set up. We explain the architecture, using
Geoserver to serve the data from a PostGIS spatial database through Network Links and KML to
Google Earth. The technical as well as the cartographic optimisations we employed are presented, as
well as a discussion of the results.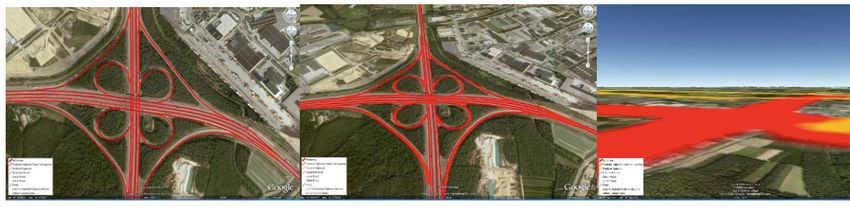
12th AGILE International Conference on Geographic Information Science 2009                  page 2 of 11
Leibniz Universität Hannover, Germany

THREE DIFFERENT WORLDS

The Dutch National Atlas

     National Atlases are collections of complex, high quality maps presenting a nation. They present
a synthesis of the spatial knowledge that characterizes that nation and to that end they contain
comprehensive combinations of geographical datasets that completely cover a country. A very
important aspect of atlases in general but particularly of national atlases is that all information has
been processed to be comparable: the same level of generalization is applied; information has been
collected for comparable reference periods; similar classification methods as well as similar class
boundaries and legend colours are used. The main point of bringing all the various types of spatial
information together in a national atlas is to make sure that this comparison can be fruitful (Kraak et
al, 2009; Sieber & Huber, 2007). Added to that is a very important narrative function, i.e. atlases not
only present lots of comparable information, but try to combine it into an explanation, a story about
the country that gives a more comprehensive understanding than could be obtained from just the
separate maps. In other words, there is a synergy where the whole atlas is more than the sum of its
parts.

    A first Dutch national atlas was published by the 'Foundation for the Scientific Atlas of the
Netherlands' in the years 1963–1978. A second edition followed from 1989 to 1995. It was produced
by an Atlas Bureau, backed by the Ministry of Education, but when it was completed the Ministry’s
outlook had changed, claiming that from now on such endeavours as a national atlas should be self-
supporting, and resulting in the atlas bureau’ closing . Since then the Foundation has been trying to
keep the national atlas concept alive, and to this end it was decided to make all maps from the
previous two editions available on the web (URL 1). With 1,5M hits since mid 2000 this website
seems to answer user needs. But, as the information contained in these maps is getting out of date,
new initiatives were needed. (Kraak et al, 2009)

    Today national atlases are still made as printed books, but cartographers have also been making
their information available in digital mass-consumer environments. First as multimedia presentations
on CDs, but with the rise of the World Wide Web they soon started developing interactive websites,
as early tests for an online Dutch National Atlas demonstrate (see Köbben and Koop, 1997). Until
recently, most digital atlases were produced using the traditional digital tools of cartographers:
graphic design software and multimedia and visualisation toolkits. And although these result in
products that can be of excellent quality and usability in themselves, they are also on themselves:
They lack the interoperability and connections with the wider digital world outside that we come to
expect in this age of Geodata Infrastructures.

The Dutch National Geodata Infrastructure

     Geodata Infrastructures (GDIs) have been defined by Groot and McLaughlin (2000) as “a set of
institutional, technical and economical arrangements, to enhance the availability (access and use) for
correct, up-to-date, fit-for-purpose and integrated geo-information, timely and at an affordable price,
with the goals to support decision making processes related to countries’ sustainable development”.
They can be characterised as highly organised, standardised and institutionalised, large collections of
spatial data and services. GDI implementation within the European Union is guided by the INSPIRE
initiative (URL6). In the Netherlands the INSPIRE implementation is translated into practice guided
by the GIDEON report. The ambition for the Dutch GDI, stated in that report is “spatial information
provision to the digital society” (Ministry of Housing etc., 2008). It aims at making spatial
information available for a broad range of stakeholders, in a multitude of application areas. The report
mentions among many others all levels of government, public services, industry and private citizens.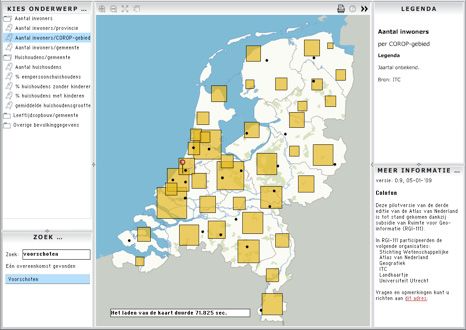
12th AGILE International Conference on Geographic Information Science 2009                 page 3 of 11
Leibniz Universität Hannover, Germany

    The implementation of the GIDEON report and the INSPIRE directive in the Netherlands has
been taken up under the direction of the organisation Geonovum (URL12). Many results of these are
already available: relevant (meta)data standards and INSPIRE implementation guidelines have been
published, a national metadata warehouse (Nationaal GeoRegister) has been established, etcetera. But
unfortunately only a few test data services using these were actually 'live' at the time of writing.

    With such a broad scope, interoperability of the components of any GDI is of course a must. And
whereas technical interoperability is already a challenge, semantic interoperability is even more
complicated. The producers of the data traditionally worked in isolation, and many of their products
were not originally meant for combining with other data sets. The users all have quite different needs,
both in the data they require and the use they want to make of that data. This makes using a GDI for
any implementation that needs a close integration of its component pieces, such as a National Atlas,
especially challenging. A GDI in itself, although it will allow mapping the different data sets, does
not constitute an atlas, because the maps cannot be compared and therefore not combined into a
narrative. It thus will not constitute more then the sum of its parts, as a good atlas would.

Virtual Globes

     Virtual Globes can be described as computer applications that bring the Earth as a highly
interactive 3D representation to the desktops of the masses. Their quick rise to popularity was noted
in an editorial in Nature (2006): “Millions of people across the world are zooming in from space,
flying across continents, and swooping over mountains and through cities, thanks to Google Earth,
NASA's World Wind, and other free virtual globes…”. The most popular of these is without doubt
Google Earth. Originally known as EarthViewer, it was developed by a company called Keyhole Inc.
EarthViewer became famous during the 2003 invasion of Iraq, when it was used to enhance coverage
of the war with a sophisticated use of satellite imagery that was fluid and almost game-like, with its
high quality, high frame rate visualisation. In October 2004 Keyhole Inc was acquired by search
provider Google, with the intention of expanding search from the non-spatial realm of the internet
with a more geographically oriented service (URL8). Google Earth displays the Earth through a
combination of different layers of information, including a terrain model that varies from 10m to 90m
resolution, imagery from many different sources including aerial photography and satellite images,
borders, place names, roads, 3D buildings and links to geo-referenced videos and photos. In addition
to these layers, users can load their own spatial data.

     Many authors have noted the advantages of this platform for scientists and other experts in
making their findings more relevant to the general public (e.g. Craglia et al, 2008; Sheppard and
Cizek, 2008). Other possible benefits are an increased impact on target communities, enhanced
collaboration with other expert users, increased publicity and recognition, and improved fund-raising
for research (Sieber, 2006). The appeal of virtual globes for members of the general public seems to
lie, as Sheppard and Cizek (2008) write “...in the realism, the sensation of flying towards or over the
earth, the ability to view their own homes or other meaningful locations, and the sense of their own
control over the medium and data: through navigation, manipulation of visible data, and even adding
their own data for viewing by others”.

THE WORLDS CONVERGING

    As we noted in the introduction, the three worlds we described are converging. We argue this is
because the users increasingly access them with similar tools, namely web-based clients and because
the underlying technology is more and more based on distributed computing and standardised
interfaces, resulting in interoperable geo-webservices.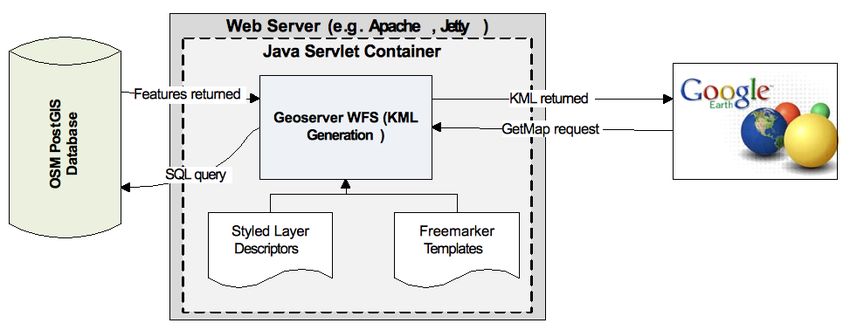
12th AGILE International Conference on Geographic Information Science 2009                  page 4 of 11
Leibniz Universität Hannover, Germany

The combining technology: Geo-webservices

     Interoperable geo-webservices are the latest in a long line of software for handling geographic, or
spatial, information. In 1962 Roger Tomlinson built the Canada Geographic Information System to
determine the land capability for rural Canada by mapping information about soils, agriculture, land
use, etc. Tomlinsons GIS software was running on a large mainframe computer and its architecture
was what we now call monolithic, with the presentation logic, application logic, and data
management layers combined in one software tier. Nowadays larger GISs, like other software
systems, have their logical layers separated. Because the client software is separated from the
application logic, the same back-end can serve different client platforms. Equally the data being used
in the analysis part can come from various different information sources, from various providers, even
from different places on the globe. Probably the best-known example of such a distributed system
approach is the World Wide Web. This kind of system is only possible when the different
components are guaranteed to work together, because they are interoperable.

     Interoperability in computer systems means in the first place that the systems are able to transfer
data seamlessly. This can be achieved by having the data encoded in a standardized, platform and
application independent manner. Nowadays, the popular encoding scheme used for that purpose is the
eXtensible Markup Language (XML). Interoperability also means that two information systems
should be able to access distributed functionality in a seamless manner. There are many ways of
setting up such Service Oriented Architectures, but by far the most used distribution platform is the
WWW and the SOA’s implemented on that are logically called webservices. If webservices have
spatial functionality, for example if they use geographic data, can output maps or find routes, we call
them geo-webservices.

    There are many geo-webservices available, the best-known proponent of it probably being Google
Maps. This, and other examples (such as Yahoo Maps, MSN Virtual Earth or MultiMap), can be used
by anybody, as their interfaces are publicly available, but they are still proprietary in that they are
defined, developed and owned by commercial companies. Alternatively, Open Standards are created
in an open, participatory process, where everyone interested can influence the standard. There is a set
of such well-defined Open Standards for Geo-Webservices: the Open Web Services (OWS) of the
Open Geospatial Consortium (URL3).

The National Atlas as a gateway to the GDI

    Recent technological and organisational developments in the Dutch national GDI have stimulated
us to take a fresh look at the national atlas concept. In a recent project within the Dutch national
research program “Ruimte voor Geoinformatie”, a feasibility study and prototype implementation
have been executed of automatic visualization of geodata available through the national GDI, in a
systematic and cartographically accountable way to guarantee an up-to-date national atlas. The
objective was to investigate how the national atlas could be organized as an integral part of the
geodata infrastructure. The atlas would benefit from an up-to-date data flow, and the GDI would
benefit from integrated visual summaries of available geodata and geoservices in well designed
comparable maps using the narrative characteristics of the atlas. As such the national atlas would
provide alternative interactive and dynamic access to the GDI (Kraak et al., 2009).

    The architecture of the national atlas in the national geodata infrastructure will be employing the
OWS specifications in a multi-tier set-up. In most existing GDIs the maps are delivered to the end-
user from WMSes. Mapping clients combine the output of several such services in a compound map.
However, from an atlas viewpoint this is not a desirable solution, as the portrayals of these layers are
not matched to each other and to the larger overall atlas goals described earlier. Therefore the
National Atlas should primarily use data services instead of portrayal services: It will consume data
from GDI WFS sources, and combine and portray that data in a cartographically sound client-side
12th AGILE International Conference on Geographic Information Science 2009 page 5 of 11
Leibniz Universität Hannover, Germany
application. The data integration and mapping component is used to determine which cartography
(map type, classification, etc.) is suitable for specific data layers and their combinations, and which
design templates are required to achieve this. To achieve high quality and interactive visualizations,
rich vector graphics technology is used to display the maps on the client side.
The current prototype, shown in Figure 1, at present implements the mapping client using Flash,
the pragmatic reason being we could base that on existing efforts. Having it based on Open Standards,
such as SVG, instead of the proprietary Flash technology would in the longer term be desirable. The
RGI-111 project and the technical implementation of the prototype are described in more detail in
Kraak et al. (2009), and the prototype (in Dutch) can be tested on URL1.
Figure 1: Screen dump of the National Atlas prototype (from URL1).
Unfortunately, at the time of our project we could not use actual Dutch National GDI services. As
explained earlier, there is considerable activity ongoing, but unfortunately only a few test data
services using these were actually 'live' and none of these matched the criteria for our test cases,
because they were not available yet in a useable Web Features Service form. We therefore are
mimicking the foreseen Dutch GDI set up, by taking actual data from the Central Bureau of Statistics
(who are planning to be one of the first to have actual WFS available within the GDI), but doing the
WFS serving (using the implementation standards already set by INSPIRE and Geonovum) from our
own servers.
A further step was to see how this could be combined with virtual globes. The integration of these
with traditional atlas maps is cartographically rather challenging, as the atlas maps are usually not
best suited to be displayed in a 3D environment in combination with satellite or air photo imagery.
But technologically it is relatively easy, because software such as Google Earth does allow external
graphics to be shown, geo-located within the 'native' layers. To combine the virtual globes with atlas
maps in a GDI environment however is a considerable technological challenge. That's because the
GDI usually comprises of (very) large data volumes, of varying levels of scale and detail, and the data
have to be extracted live from the geo-webservices. Further additions to the cartographic challenge
are the limited possibilities for mapping graphics within the virtual globe file formats and APIs. In the12th AGILE International Conference on Geographic Information Science 2009 page 6 of 11
Leibniz Universität Hannover, Germany
next section we will describe how we tested out the possibilities by pragmatically putting together
existing components and data sources in a manner that is usually called a mash-up.
MASHING UP: PUTTING GDI DATA ON A VIRTUAL GLOBE FOR THE
NATIONAL ATLAS
The term mash-up can be traced back to the first efforts of people to use the then newly released
Google Maps for showing their own data, such as Adrian Holovaty's ChicagoCrime.org. Google
Maps did not originally have a public application programming interface (API), but developers
reverse-engineered it to use the system for their own purposes, and eventually Google released their
API (Turner, 2006). Mash-ups can be defined as “a web application that combines data from more
than one source into a single integrated tool. The term implies easy, fast integration, frequently done
by access to open APIs and data sources to produce results data owners had no idea could be
produced” (URL5).
Test case: Open Street Map data in Google Earth
For our test we were looking for an appropriate data source. As explained before, the current state
of the Dutch GDI did not allow us using actual services. The Statistics Bureau data used in the atlas
prototype could be used, but we were also interested to see if we could take a more challenging
dataset. The statistics data is simple and small, and the actual Dutch GDI is expected to contain also
datasets of considerably larger size and complexity, and much more variation in granularity. After
consideration of various sources, we settled on using the Open Street Map data of the Netherlands.
The Open Street Map Project (URL4) is a community created, freely available mapping dataset. The
features are created by contributors using GPS or survey devices, and are combined through wiki-
style collaborative software. There are currently OSM mapping projects running all over the world on
all the major continents in a total of 112 countries. The data collection for the Netherlands was greatly
helped by a large data donation by the commercial company Automotive Navigation Data. The
dataset consists of transport, land use and other location data within the Netherlands and is available
under a Creative Commons License. It is a large data set, some layers have an extremely large
number of vertices, and the road layer alone contains 1,037,773 features. Figure 2 shows a
comparison of the maximum, average and minimum number of vertices per feature per layer. The
data were loaded into a PostGIS spatial database.
Figure 2: Comparison of vertices per feature, for selected OSM layers.
To show external features in Google Earth, one has to make these available in a format known as
KML (Keyhole Markup Language). It's an XML based mark-up language for describing and styling
spatial information. It uses many elements derived from GML, as well as several that are specific to12th AGILE International Conference on Geographic Information Science 2009 page 7 of 11
Leibniz Universität Hannover, Germany
the Google Earth environment. These include image overlays, screen overlays, photo overlays as well
as support for including three dimensional models. It is differentiated from GML by its inclusion of
styling information. This is useful, as it allows KML to function as a form of vector WMS output.
KML has recently received OGC specification status (URL3). Our geo-webservice thus had to be able
to extract the data from the PostGIS database and return it as KML, with proper cartographic styling.
A selection of different KML serving architectures were investigated, and in some cases limited
testing was undertaken in order to select the most promising option for further work. Both ESRI's
ArcGIS Server and SafeSoft's FME Server were discarded because they are proprietary software.
UMN MapServer, combined with the KML MapServer project (URL10) does not currently support a
bounding box, meaning that all the data for each layer will be loaded every time the map is refreshed.
WFS-KML Gateway is a promising project that is currently under development by Eduardo Riesco at
Universidad de Valladolid in Spain (URL9). It can be placed into any servlet container and directly
serves KML from a WFS. However, it is still in early development, and not mature enough for our
purpose (e.g. it currently only supports polygon rendering).
We finally selected Geoserver (URL7) for the completion of the project. It is a popular, fully
featured WMS/WFS, and a very mature Open Source project with a large community. It reads from a
broad range of data stores. It is focused on the WFS side of geo-web services, with emphasis on
optimising the delivery of geographic features and attributes, rather than just images of the data,
however it is still a competent WMS. The core functionality of Geoserver is delivered through Java
servlets. These implement OWS compliant geo-webservices that respond to http requests, and deliver
data in a variety of formats, one of which is KML (other OGC standard outputs include WMS, WFS,
GeoJSON and GeoRSS to name a few). The delivery of the data in KML is done through the OGC
WMS standard by simply specifying "application/vnd.google-earth.kml+xml" as the output format.
The styling of the data is done via another OGC standard – styled layer descriptors (SLDs).
Figure 3: Architecture of the system.
An overview of the resulting architecture of our test system is shown in Figure 3. Once this was
up and running, we could deliver the OSM data to Google Earth and for example show all 1 million
plus roads and streets of the Netherlands draped on the globe. But although this worked (if you had
enough patience) it was by no means the atlas-quality depiction of GDI data on a virtual globe we
were looking for. In order to achieve that, a number of optimisation measures had to be taken, both in
the technical and the cartographic sense.
Technical optimisation
The first optimisation target was the OSM database. An obvious step was to make sure all
columns were properly indexed. Spatial indexing especially can help the query planner to12th AGILE International Conference on Geographic Information Science 2009 page 8 of 11
Leibniz Universität Hannover, Germany
significantly optimise queries for limited spatial extents. Furthermore we split up the original tables
into separate, scale-dependent tables, so that for depiction on smaller scales some tables could be
skipped altogether. Next we pre-processed the conversion of the original Dutch RD geometry into the
lat-lon geometry on the WGS84 datum that Google Earth requires.
In the Geoserver middleware, the main optimisation could be found in the built-in features of the
KML reflector script, which include KMScore and KMAttr. The KMScore is a value that determines
the point at which the display of the layers in Google Earth changes from vector to raster. When the
number of features returned from the server passes the threshold set in the KMScore, the layer is
shown as an image rather than vectors. The KMScore is a log function, where 0 = always raster, and
100 = always vector. A choice can also be made between providing the attributes of the features or
not, using the KMAttr option. If it is turned on then the features are available via an information
point, if turned off the point won't be there and the attributes are not available. This significantly
reduces the amount of KML to be displayed.
The database, Geoserver and Google Earth all support standard scaling measures, such as on-
server caching, round robin load distribution and multi-tier server architectures. Google Earth itself
has many built-in optimisation strategies for caching and asynchronous loading and depiction of data,
but these can not be tweaked by us. One optimisation that can be influenced is the KML regionating
mechanism. This is the process of creating a hierarchy of NetworkLinks that each displays a small
amount of KML at a different scale. Regionation seems to be more suitable for large, unstructured
data that would otherwise be obscuring each other. A good example of this is the sample Swiss
Transit dataset on the Google Code webpage (URL11). The different layers that were used for this
project have defined scales at which we want either all the features to be present, or none of them.
Therefore it was decided that regionating was not suitable for these data.
Cartographic optimisation
The OSM data used in this context is intended to serve as an analogue for the proposed National
Atlas dataset. Because of this it is important to consider the appropriateness of Google Earth as a way
to display this sort of data. Firstly, it is important that the underlying imagery in Google Earth is
considered when choosing the symbology for the features. Google Earth obtains imagery from many
different sources, and often the quality, colour and resolution vary dramatically between images. It is
possible certain symbology that is easily visible and looks attractive overlaid on one kind of imagery
looks inappropriate on imagery from a different source. In Google Earth the imagery could change
overnight, so we tried employing visualisations appropriate for as broad a range of backgrounds as
possible. Secondly, the ability to display information through vector or raster representations is very
powerful, but it is not without cartographic shortcomings. There is often a significant change in the
way the same symbology appears when the change is made from vector to raster symbols, and vice
versa. Also the angle of view can have a significant effect on the way features are displayed. For
example, in Figure 4 you can see some polyline features that are shown first as vectors, then a raster
image overlay, then a raster at an oblique angle. In all three situations they appear different. There is
not much that can be done about the way that Google Earth renders rasters at an angle, as this is part
of the behaviour of the software. However it can be minimised by ensuring that features are only
displayed at scales that are suitable for vector rendering, and setting the KMLScore value so that they
are always shown as vectors.12th AGILE International Conference on Geographic Information Science 2009 page 9 of 11
Leibniz Universität Hannover, Germany
Figure 4: Raster and vector symbology in various situations.
The SLD standard used in Geoserver to define the (carto)graphic attributes of the map depiction is
quite powerful and supports most of what is needed in proper mapping. But we had to take into
account that the SLD features are translated by Geoserver to KML whenever a vector depiction is
needed, and the vector KML representation is rather more limited in its cartographic possibilities. We
had to take care to only use SLD descriptions that 'translate' well to KML.
CONCLUSION
In conclusion, we are satisfied with the results of our tests in some areas: the performance,
robustness and saleability are rather good. The example in Figure 5 and similar views that readers are
invited to create for themselves by going to the test site (URL2) show a responsive view on a huge
amount of data that can be shown in an understandable and cartographically efficient manner. Less
pleased we were with the control we have over the styling, making the possibilities the system offers
for having a consistent styling automatically rendered in all situations limited. Quite a lot of 'manual
tweaking' is needed for optimal results, which is not desirable in a GDI environment. In some areas
we have no results yet: As we used our own data, we need to test at a later stage (when suitable data
becomes available) how well the set-up adapts to being used within the actual Dutch GDI. Also we
want to execute tests with end users to assess the usability and usefulness of the system and possibly
compare it to other set-ups.
We feel that our test has shown that the convergence of the three worlds of National Atlases,
GDIs and virtual globes is feasible in a technological sense and can also be a useful and approachable
tool for users to access the rich information source of a National GDI. To that end, the results have
been included in the final reporting for the RGI-111 project and the virtual globe connection can
become a valuable part of the Dutch National Atlas portal.12th AGILE International Conference on Geographic Information Science 2009 page 10 of 11
Leibniz Universität Hannover, Germany
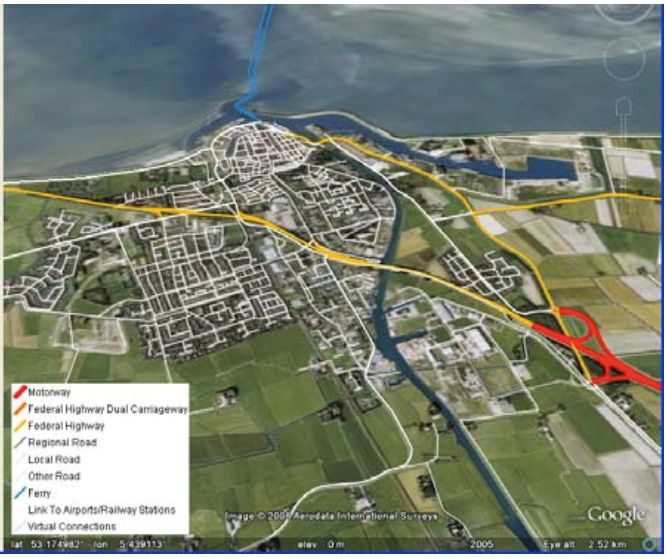
Figure 5: example of the data viewed in Google Earth: the most detailed level street data shown
on an aerial photo background (try it out at URL2).
WEBSITES
URL1: Dutch national atlas website. http://www.nationaleatlas.nl/, accessed January 2009.
URL2: National atlas and Google earth test site. http://geoserver.itc.nl/NatAtlas/GE/, accessed
January 2009.
URL3: Open Geospatial Consortium Home Page. http://www.opengeospatial.org/, accessed January
2009.
URL4: Open Street Map. http://www.openstreetmap.org/, accessed December 2008.
URL5: Wikipedia, http://en.wikipedia.org/wiki/Mashup_(web_application_hybrid), accessed
November 2008.
URL6: INSPIRE website. http://inspire.jrc.ec. europa.eu/, accessed June 2008.
URL7: Geoserver website. http://geoserver.org/, accessed November 2008.
URL8: Google Corporate Information. http://www.google.com/corporate/history.htm, accessed July
2008.
URL9: WFS-KML Gateway website. http://eduardoriesco.com/wfs_kml_gw/, accessed January 2009.12th AGILE International Conference on Geographic Information Science 2009 page 11 of 11
Leibniz Universität Hannover, Germany
URL10: KML Mapserver website. http://sourceforge.net/pro jects/kmlmapserver/, accessed January
2009.
URL11: Swiss transit regionating sample. http://code.google.com/p/regionator/wiki/SwissTransit,
accessed June 2008.
URL12: Geonovum site. http://geonovum.nl/, accessed November 2008.
BIBLIOGRAPHY
Craglia, M., Goodchild, M. F., Annoni, A., Camara, G., Gould, M., Kuhn, W., Mark, D., Masser, I.,
Maguire, D., Liang, S., and Parsons, E. Next-generation digital earth. a position paper from
the vespucci initiative for the advancement of geographic information science. International
Journal of Spatial Data Infrastructures Research 3 (2008), 146–167.
Groot, R., and McLaughlin, J. Geospatial data infrastructure–concepts, cases and good practice.
Oxford University Press, Oxford, etc., 2000.
Köbben, B., and Koop, R. A Dutch Atlas Information System - Using the Internet for electronic atlas
data retrieval. In 18th ICA Conference (Stockholm, 1997), International Cartographic
Association, pp. 1932–1937.
Kraak, M.-J., Ormeling, F., Köbben, B., and Aditya, T. The potential of a national atlas as integral
part of the geodata infrastructure exemplified by the new dutch national atlas. In Spatial Data
Infrastructure Convergence: Research, Emerging Trends, and Critical Assessment (Rotterdam,
2009), GSDI Association.
Ministry of Housing, Spatial Planning and Environment. GIDEON - key geo-information facility for
the netherlands - approach and implementation strategy [2008-2011]. VROM, Den Haag,
2008.
Nature. Think global. Nature 439, 7078 (2006), 763–763.
Sheppard, S. R., and Cizek, P. The ethics of google earth: Crossing thresholds from spatial data to
landscape visualisation. Journal of Environmental Management. In Press, Corrected Proof
(2008), DOI: 10.1016/j.jenvman.2007.09.012.
Sieber, R., and Huber, S. Atlas of Switzerland 2 - a highly interactive thematic national atlas. In
Multimedia cartography, W. Cartwright, M. P. Peterson, and G. Gartner, Eds. Springer
Verlag, Berlin, etc., 2007, pp. 161–182.
Turner, A. J. Introduction to Neogeography. O’Reilly Shortcuts. O’Reilly, 2006.
Parts of this paper are based on the (unpublished) ITC Geoinformatics Master report:
Graham, M. G. Integrating large volume data services with Google Earth mapping. GFM3, ITC,
Enschede, 2008.You can also read