Real Time Weather Monitoring System Using Iot - ITM Web of ...
←
→
Page content transcription
If your browser does not render page correctly, please read the page content below
ITM Web of Conferences 40, 01006 (2021)                                                                  https://doi.org/10.1051/itmconf/20214001006
ICACC-2021

             Real Time Weather Monitoring System Using Iot
             Puja Sharma1 and Shiva Prakash2
             Department of Information Technology and Computer Application
             Madan Mohan Malaviya University of Technology, Gorakhpur

                          Abstract: In Today’s World, knowing live environmental condition is one of the biggest issues because
                          there is an IoT of hurdles arrives when live environmental condition is measured. The proposed system will
                          remove this problem since it monitors real-time weather conditions. In this proposed work we will monitor
                          the live weather’s parameter of the Gorakhpur Region. The proposed system will work on the client-server
                          architecture model using IoT. The system is organized in Two-tier Architecture. Our proposed system
                          contains a various sensor which will monitor the temperature of the region, humidity, Rain value and
                          pressure of the system. The sensor captured data and send it to the node MCU controller. Arduino ide is
                          used to upload the sensed data. The serial monitor has worked as a gateway between the sensor and the
                          cloud. The data is pushed by the sensor on a serial monitor. The serial monitors an IP address. The HTTP
                          protocol is used to view the data on the webserver. This paper displays the data on the webserver and
                          monitor the real-time data of weather using environmental parameter or sensor. Using a webserver,
                          everyone can monitor the weather’s condition from anywhere without depending on any application or
                          website. The data is available publicly. With the help of this proposed system, we measure the weather
                          condition of the Gorakhpur Region. After getting results from the various sensor, it is observed that our
                          proposed model achieves better results in comparison with the standard weather parameter.

           1 Introduction                                                      weather monitoring system. S It will help the farmer
                                                                               before reaping and sowing. In Gorakhpur Region, the
           Monitoring weather’s condition plays an extensive role              total geographical area of this region is around 3488.8
           in every person’s life. The impact of the environment’s             square km and cultivable land is 26428 hectares, In
           condition causes numerous challenges in various fields              which the percentage of irrigated area is 76.5 %. The
           like agriculture, industry, constructions as well as more           main crop of this region is Paddy. The total area is
           other fields. But the measured impact occurs mostly in              around 152655 hectares. The amount of water if became
           agriculture and industry. As we all know, agriculture               high then it will be a problem for farmers. Because in the
           perform a crucial role in India’s Economy. Almost One-              sowing of paddy it needs water sufficiently but if the
           fourth of India’s economy is acquired from Agriculture.             quantity of water will grow then it should be a problem
           Over the recent year, smart agriculture was a debated               for farmer. So, to remove this problem, if the weather’s
           topic in the world. In IoT [13,16], the smart word                  condition is known then it will be beneficial for them.
           indicates that the use of minimum parameters produces a             The main objective of our system is to provide an
           better result. It reduces the use of land, water, time as           indication of whether that would be beneficial for the
           well and the uses of the new technology and science for             farmers before sowing crops or reaping crops. In this
           the enhancement of crops. The security is one of the                paper, Section-II shows the literature review.
           major issues [17,18] in IoT network, lot of security                Development of weather monitoring system is done in
           techniques are available but still many several                     section III. Section IV describes the hardware parts of
           possibilities to enhance the existing security.                     our system. Section V portrays the analysis of our
           In agriculture, Before the yield, the Farming process               experimental result in real-time. The next part will be the
           consists of several phases and in that weather plays the            summary or conclusion parts of this research.
           most extensive role. In Gorakhpur Region, the situation
           of rain mostly happens. It is situated near the border of           2 Literature Survey-
           India “Nepal” and Nepal is a hilly area due to which the            The author in [1], proposed a robust and affordable
           rainy situation occurs mostly. Due to this situation, the           Automatic weather station. In this paper, the author
           farming problem occurs due to heavy rainfall. In this               elaborates how the weather prediction system is
           situation, an indication of weather’s condition is an               becoming a crucial challenge in every Weather extreme
           important aspect before sowing or reaping the crops.                event that causes an adverse effect of the system on lives
           Hence in this situation, the monitoring of weather’s                and property as well. Hence the accuracy of weather data
           condition [14,15] would help farmers with the help of a             is being one of the critical challenges to enhance the

             *
              Puja Sharma: shravi.pujasharma012@gmail.com

  © The Authors, published by EDP Sciences. This is an open access article distributed under the terms of the Creative Commons Attribution License 4.0
  (http://creativecommons.org/licenses/by/4.0/).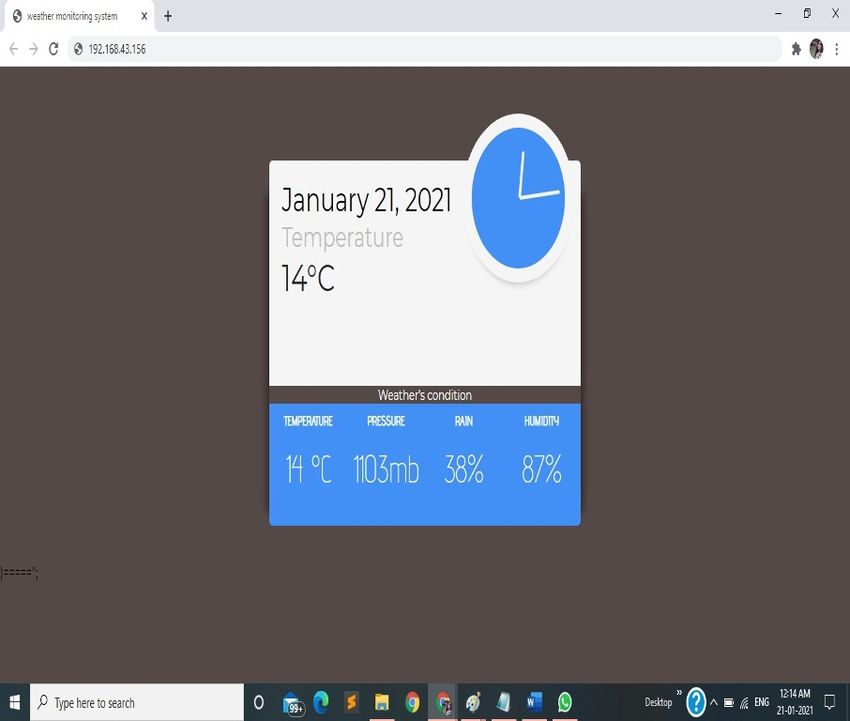
ITM Web of Conferences 40, 01006 (2021)                                                              https://doi.org/10.1051/itmconf/20214001006
ICACC-2021

          weather prediction skills and build up the resilience to          programmed with node MCU and Arduino ide. In this
          effect of detrimental weather report condition. The               paper Author uses only two gadgets to measure the
          author describes that Uganda and various other                    weather conditions i.e., Wemos and OLED, After the
          developing countries have looked challenges in                    connection, it will store the data on the cloud for storing
          developing timely & accurate weather data due to scarce           data a thingspeak website is used to display the data
          weathers observation. The scarce weather monitoring is            regarding weather. The system displays the data on
          a part of the high cost of developing automatic weather           OLED and thing speak cloud. The author's aim is to
          situations. The restricted funding is available to national       obtain live information on weather conditions on OLED
          meteorological services of the respective countries. In           display.
          this proposed system the author firstly takes care of the         The author in [4], proposed a system that monitors and
          problems and then applies them. The author proposed an            predicts the weather condition by which anyone can plan
          Automatic weather monitoring Station based on a                   for our day-to-day life. This activity became helpful in
          wireless sensor network. The planning of the author is to         every field either in agriculture or industry. So as to
          develop three generations of Automatic weather stations           achieve monitoring and predicting weather info, the
          or AWS prototypes. In this research, the author evaluates         author uses 2 stages of the weather management system.
          the 1st-generation AWS prototype to improve the 2nd               In which they amalgamated the information from the
          generation depending upon the need and generation. The            sensors, bus mobility, and deep learning technology is
          author provides a suggestion to improve the non-                  used to allow a weather reporting system in stations and
          functional requirement such a power consumption, data             buses in real-time. Forecasting of weather is achieved
          accuracy, reliability, and data transmission in order to          through the friction model. Depending upon the sensing
          have an Automatic Weather Station. The non-functional             measurement from vehicles like buses, the work
          requirement collapsed with cost reduction in order to             incorporates the strength of local information processing.
          produce a robust and affordable Automatic Weather                 The author talks about in stage-I, sensing of weather’s
          Station (AWS) Therefore the proposed work, like                   condition, multilayer perception model and long-term
          developing countries like Uganda will be able to acquire          memory are trained and then it will verify using
          the AWS in suitable quantities. So that it can improve            temperature data, humidity, air pressure of test
          the weather forecasting                                           environment. In Stage-II, the training is applied to learn
          The author in [2], presents an IoT-based weather                  the time series of weather information. To get accurate
          monitoring system. In this research, the environmental            data or not, to check the system performance, the author
          parameter can be retrieved through sensors. The author            comparing the predicted weather data and actually
          uses a different sensor to scale the various parameter like       obtained data from the environment Protection
          humidity, temperature, pressure, rain value & the LDR             Administrator and central Baeuro of Taichung
          sensor is used. The system also calculates the dew point          observation system that calculate the prediction of
          value from the temperature prototype. The temperature             accuracy. The author finally talks about the proposed
          sensor can be used to measure the value of the particular         system has reliable performance on monitoring of
          area, room, or any place. With the help of the LDR                weather. And this model also proposed a one-day
          sensor, the light intensity can be used as described by the       weather forecast or prediction via the training model. So
          author. The author in this used an additional                     finally, the author demonstrates that this system presents
          functionality of the weather monitoring as SMS alert              a real-time weather monitoring and prediction system
          system based on the exceed the value of the sensing               using bus information management. The author
          parameters as temperature, humidity, pressure, light              represents 4 basic components 1- Information
          intensity, and rain value. The author also adds an email          management. 2- Interactive bus stop 3- Machine learning
          and tweet post alerting system. The author in this system         predictive model 4- weather information platform. In
          uses node MCU 8266, and various sensors.                          this, information shown via dynamic chart.
          In this paper [3], the author represents a low-cost live          The author [5], implement an IoT-based weather
          weather monitoring system using OLED display, in                  monitoring system, in this research paper, the author
          which the author displays the various fields where the            describes that how with the help of IoT technology, the
          IoT has produced innovative things in the system. The             weather can be monitored. And which provide the info
          author described A new revolutionary system. Which                of climate-changing conditions. With the help of this
          measures the real-time Weather's condition. The                   project, people can be aware of the climate condition
          monitoring weather situation is very much helpful for             changes. It gives an accurate and efficient output and the
          everyone either for farmer or industry or daily working           algorithm as the swarm is used to implement for further
          people or for school as well. So, the author by                   improving the accuracy. So, in this project, the author
          developing a live weather monitoring system reduced the           aims to make a weather monitoring with the help of IoT.
          difficulty level for farmers and industry as well. In this        In this project, the hardware and software are used which
          paper, the author uses an OLED display that will display          makes it easy to implement. In the project, the author
          the weather conditions and In the proposed model, the             uses a different sensor to collect the information of the
          author uses an ESP8266-EX microcontroller-based                   climate and stored it in the cloud. For this storage, the
          WeMos D1 board executed on Arduino, that retrieved                website www.thingspeak.com is commonly used for
          the data from the cloud. WeMos D1 is a wifi module that           Internet of things projects. And from the cloud storage
          is developed on ESP- 8266EX microcontroller. It has a             space, it extracts the whole weather data and uploads it
          4MB flash memory. It one of the Excellent which is                to the android mobile application using an API key.

                                                                        2
ITM Web of Conferences 40, 01006 (2021) https://doi.org/10.1051/itmconf/20214001006
ICACC-2021
Tools which detect the rain drops, is called rain sensor. information in the excel sheet and that can get SMS in
Once the plague reveals the raindrops on the strips and the mobile with the help of the Global System for
the voltage is considered from that. And there is no short Mobile communication model. The dense circuitry is
circuit condition that occurs because water is a bad developed around the LPC1768(ARM) microcontroller
conductor and the sensor acts like variable resistance. is used in this system. The program like embedded C
Once a measurement of voltage is completed then the using the IDE is used in this project. JTAG is used to
circuit takes the output. The voltage is measure through a loading programs into a microcontroller. The LABVIEW
potentiometer and to transfer analog signal to digital is a platform that develops the environment for a visual
signal the system applies LM393 Comparator. The LED programming language from National Instrument. The
turns on when the power supply system is observed and name of the graphical is “G”. Data transferring from
there have no water drops on the sensor then the digital hardware could be received in LABVIEW using a serial
output is high. And the sensor also dictates when the communication system. The reading shows the different
sensor has moisture on the sensor plate the digital output data with the indication like metering etc. LABVIEW
is actively low. For measuring the humidity three sensors result from view on EXCEL FILE and locate the file into
can be used as humidity sensing components, TC the folder and updating of the value can be displayed in
thermistors, and An IC at the back of sensors. For the excel file. Hence, in this way, this system monitors
humidity measurement humidity component is used it the environmental parameter. The embedded controlled
has two electrodes. Node MCU is used as a controller. In sensor has been demonstrated reliable themselves.
IoT projects, the Node MCU is basically used. This In paper [7], discusses the implementation of a weather
programmed using Arduino IDE. The scripting language monitoring system using a WFI module. The weather
LUA is used for programming. NodeMCU runs on the monitoring system performs the process through the
ESP8266 WIFI module. This Android STUDIO is used connection of Wi-Fi. The system contains a transmitter
it is developed by google developers. The aim of this section and receiving section. The transmitting section
application is to make processing easier. contains the Wi-Fi module, controller, various sensors.
Android studio is used to implement a common The receiving section contains the web server, router,
application to show the streaming of data from thing website, etc. the working of the system is defined by the
space. With this smartphone application, the weather author as, multiple sensors such as sensor, pressure,
condition can be monitored. Now after designing the humidity sensor reads the environmental temperature,
application, it will display temperature, humidity, heat, pressure, humidity respectively. The rain gauge sensor
and raindrops and is stored on the cloud. The author uses the tipping bucket technique. In this technique,
provided an API Key to bring in our data from the measure the no. of times, a calibrated bucket is
thingspeak website to the android device. exhausted from the rainwater. And in that water is filled
This paper [6] presents a paper, i.e. Design and to calibrated mark, and hence the emptied one tip is
implementation of weather monitoring and controlling implied and multiplied by 0.02mm and that’s the final
system. In this project, the author emphasized that how amount of rain. The wind gauge is applied to sense the
the weather monitoring system works. According to the wind speed and wind direction. The signal conditioning
author, weather monitoring system plays a major in our is mandatory for getting the exact wind velocity value.
daily life. Hence the collection of information of Signal conditioning contains an optocoupler in the
temporary changes of environment situation is crucial. In system and the output is shown to the Schmitt trigger,
the industrial field, there have certain hazards available. which is a bi-stable circuit. In this circuit when the input
In the earlier systems, the industry is totally dependent raises across a certain threshold, the output increases to a
upon mechanical and electromechanical instruments. continuously increases maximum and decreases to the
And it has some drawbacks of that system such as poor early 0 when the voltage input value falls down another
rigidity, human intervention is required and associated threshold. Each sensor‘s output is accepted by the D1
parallax errors, durability requires. Hence, to remove this controller and handled in a compulsory format. Those
drawback a remote monitoring system is needed and the values are transmitted using Wi-Fi to the main server.
principal goal of this system to produce a standalone All the values of sensed data are maintained on the main
modular weather monitoring system with the in-built server and routed and show continuously on the website.
facility of remote monitoring and communicating to The refreshing rate of 10 seconds. The database is
capture & send the metrological parameter. Therefore, it created using the MySQL query language. A PHP
is very much important to monitor the weather. In this scripting language is used to display the information on
research paper, the author implements an embedded the website.
system and plot a weather reporting and monitoring In this project [8], the author proposed, “A LOW-COST
system which enables weather monitoring system. This ZIGBEE BASED AUTOMATIC WIRELESS
type of system consists of a couple of sensors as gas, WEATHER STATION WITH GUI AND WEB
temperature, rain, humidity sensor, etc monitored. HOSTING FACILITY”. The author focuses on the
LPC1768 microcontroller (ARM9) is used as a core current climate condition and conceptualized a model, in
system as all the sensors are connected with this sensor which a ZigBee wireless link is used. Because seeing the
and collected the information regarding weather as today’s condition stirring the quality of human life and
temperature, humidity, pressure, etc. After collecting all also affect the increasing population activity. In the
the data send it to the LABVIEW by applying serial current situation, the metrological parameter data
communication. This module kept the details collection is necessary rather than limited, and keep used
3ITM Web of Conferences 40, 01006 (2021) https://doi.org/10.1051/itmconf/20214001006
ICACC-2021
of the comprehensively monitoring system due to cost Each sensor is connected with nodeMCU. It transmits
constraint and availability of human is just a drawback in the sensed data from the cloud and data analysis is
the system. In this research paper, the author suggested performed and shows the result in the resultant view on
and implemented a low-cost hardware module based on the website. Data is fetched from the cloud in the CSV
the Arduino Uno Board. With this board, it measures the file format. And after that for further processing, it
metrological data, it includes the typical temperature, includes the data from the cloud in R Studio, and then
sensor, atmosphere, wind speed, wind direction and data is processed using various algorithms.
sends all the information to the GUI system which is This paper [10], presents the “Embedded weather station
running on a laptop through Zigbee wireless link. The with Remote wireless control”. In this paper, the author
GUI is a convenient and standalone application for the elaborates on the importance of a weather monitoring
Windows operating system. It is implemented in the system. The author describes that how the weather
LABVIEW. The LABVIEW application graphically monitoring system works in now a day. It is very
displays the current situation and logs the data that is important to know the climate condition before going
accessible by MS excel. The system has a facility to host outside for any specific work. This paper describes what
the same information on the webpage. This system has a is the field where weather monitoring is important. The
mathematical model that is efficient in creating and field like agriculture, military, entertainment, industries,
generating a short-time local alert on weather etc. there is so various solution for monitoring the
parameters. weather parameter. It describes the three solutions which
The system provides a real-time effect. The main are a solution for monitoring the weather. The first one,
objective of this model to detect the condition mapping, using a static weather station. The second one is based
and weather forecasting most necessarily, it warns the on the wireless sensor network. and the 3rd one is, using
people of its devastating effects. This would be very a low dimension weather station. In this research paper,
much helpful for landing the aircraft, cloud burst, the author represents a weather station made up of
healthcare effect, tornado, tsunami, navigational, and the temperature, luminosity, pressure, humidity, sensor
shipborne effect. implanted with a microcontroller based on the board.
In the paper [9], The author proposed an “An Intelligent The weather station is restrained with an SMS service of
weathering system using the internet of thing” research mobile phones.
in which, with the help of machine learning algorithm The author [11] conceptualized the weather monitoring
and IoT technology, climate condition is measure and concept using Artificial intelligence. According to the
predicts the next upcoming condition. The author author, weather forecasting is a statical method instead
presents the system that is a very much cost-effective of using a binary decision concept. The intention of the
and efficient method for controlling the weather author is to implement an intelligent weather prediction
condition and sends it to the cloud so that the value is system. Since the system has a mandatory tool and this
fetched and available on the internet and can be seen tool used to measure the maximum and minimum
anywhere by connecting through the internet. There is a temperature, rainfall for a sampled period of the day and
significant role of temperature, humidity, pressure in the then analysed. The prediction is done on the basis of
system. also have a different area used in the system available data, which is achieved using machine learning
such as agriculture, logistics, etc. weather monitoring, Algorithms. The prediction and analysis are based on the
and forecasting is important for the advancement of linear regression which predicts the upcoming day’s
these industries. IoT technology used in the formation weather condition with better accuracy. The accuracy is
and development of this research, that is an advanced & achieved more than 90% is achieved with machine
efficient approach for connecting the sensor to the cloud learning techniques. The recent research strikes that with
that stored the real-time data and connects the whole the use of machine learning techniques the system
world of things through a network. The thing might be achieved better accuracy and better performance. The
anything as the sensor, electronic gadget, and automotive machine learning technique is a branch of AI. It has
electronic equipment as well. The whole system deals proven that it is a robust technology in analysing and
with the monitoring and controlling the environmental predicting. Machine learning performs an important role
condition like temperature, smoke, gas, wind, pressure in various field as Industrial, agriculture, logistics,
relative humidity level, and many other gases with healthcare and etc. And where weather forecasting is an
sensor transfer the data or information to the cloud important area. In this paper, the result is verified with a
platform and store the data on it. A machine learning multiclass classification algorithm using a logistic
prediction algorithm is used in this system. Machine regression algorithm with ANN i.e., Artificial neural
learning is a branch of AI (Artificial Intelligent) which network. This paper also talks about the disadvantages of
deals with analysing and predicting the given dataset. using ANN (artificial neural network), multi-
The collected data is analysed. The real-time data sent classification. Because they did not provide any value to
through the sensor can be reachable through the internet the nearest of the day, not the probability of the day that
in the entire world. The methodology which is used by how the day is going to be. In this system, the support
the author as node MCU microcontroller is used to vector machine learning techniques can be used in
gather the information from discrete sensor which is prediction and it works on large data and provides the
basically on the code dumped in Nodemcu, send the data best result. But in this classification, there has presented
to the specific cloud as Thingspeak is used for displaying some redundant data. And that must be escaped. The
both the data with web view and also application view. only power is to be taken by the system that gives the
4ITM Web of Conferences 40, 01006 (2021) https://doi.org/10.1051/itmconf/20214001006
ICACC-2021
best result is to update the data set in order. to reflect the Table 2. Grouped sensor nodes under various modes.
accurate result. It performs well when the data set is in
huge amounts. And provided over a seventh of the data Sensor node-1 Sensor node-2 Sensor node-3
is to be forecasted. This module assists in predicting and
DHT11 BMP 180 Raindrop sensor
monitoring the weather condition with a better rate of (Temperature and (Barometric (Rain sensor)
accuracy in an effective manner. pressure sensor) pressure)
In [12], the author talks about the real-time accessible
system. The author proposed a method in this paper
using IoT technology. In this research, the system deals
A novel weather monitoring system using IoT is
with monitoring the weather and climate condition
proposed. In this paper, the author presents 3 different
changes as UV radiation, pressure, temperature,
sensors organized in different forms of bundles in the
humidity, and even carbon monoxide levels present in
system. The model describes how the sensor is
the air. It uses different sensors to collect the info and
connected to the microcontroller node MCU. Sensors are
sent it to the web page to view and sensed data presents
connected with the node mcu8266 in the architecture.
in the visual view. If the info is upload on the web
The system is arranged in this manner that data will
server, then it can be accessed from anywhere in the
automatically fetch from sensors and will upload while
world. The project consists of a mobile application that
connecting with wi-fi and displays the data on the
sends a notification for an alert system to provide
webpages. The proposed model uses three sensors meant
warnings to people about drastic and sudden changes in
to acquire temperature, pressure, humidity, raindrops
weather. To forecasting the most complex weather, it
which are shown with mode1, mode2, and mode3 in
cannot be done using a sensor only but we need an API
above table 1. The modes are described as Temperature
that analyses the data is collected by the sensor and
and humidity (MODE-1), Barometric pressure (MODE-
predict the accurate result. This API can be used to
2), and Raindrop sensor (MODE-3) represents in table 2
access the data anywhere, anytime with ease. And it also
as well. By consolidating table 1 and table 2 shows as-
stores the data for further use. This system requires less
Mode 1 indicates as Sensor node 1 which contains 1
maintenance because it uses fewer parts and has a
DHT11sensor for measuring the temperature and
compact design. The component doesn’t consume more
humidity of the environment. Mode 2, indicates sensor 2
power .and it can also powered by a solar panel. The
which contains BMP 180 sensor for measuring the
author said that if we compare it to another device that is
barometric pressure from the environment. And the last
available in the market is cheaper and more cost-
one is Mode 3, which indicates sensor 3 that contains a
effective. This type of project used in the metrological
raindrop sensor, its name suggest it indicate, it is used to
department, aviation, weather station, marine industries,
measure the raindrops from the environment. The
etc.
proposed system is an effective weather monitoring
system with less no. of sensors. It is reliable and also
3 Development of Weather monitoring free and available publicly. we can use multiple sensors
System using Multi Sensors for weather monitoring like wind speed, wind direction,
The aim of this paper is to develop a Weather monitoring PIR sensor, and many more. But in our proposed model
system which will observe the weather’s situation and we are using three sensors to check the working of the
monitor live environmental parameter continuously system and reliability of the system. The proposed model
through wi-fi. The weather monitoring system makes use measures the accurate value of the environmental
of various sensors to measure the parameters. condition
Table 1. Multiple modes in weather monitoring System 4 Hardware Illustration of the proposed
system
Mode 1 If mode 1 presents, DHT11 i.e., temperature and Fig 1 represents the architecture diagram. With the help
pressure, if it is on, then it captures the of this architecture, Every sensor is connected with node
temperature value and represents it on the MCU pins. The power supply is given to the node MCU
webpage by USB which is connected with pc.
Mode 2 If mode 2 presents, BMP 180 i.e., it shows the
barometric pressure of the environment.
Mode 3 If mode 3 present, the Rain sensor module i.e., it
shows the rain value of the environment.
5ITM Web of Conferences 40, 01006 (2021) https://doi.org/10.1051/itmconf/20214001006
ICACC-2021
The operational range of BMP is -40 degrees to
+85 degrees Celsius.
⮚ This chip uses I2C 7- bit address 0X77.
4.1.4 Mode 3 Sensors (Raindrop sensor)
⮚ The raindrop sensor is used to measure the
detection of water beyond humidity sensor
detects.
⮚ Rain sensor detects water on its sensor board of
raindrop sensor.
⮚ The board act as a variable that will change
from 100K Ohm.
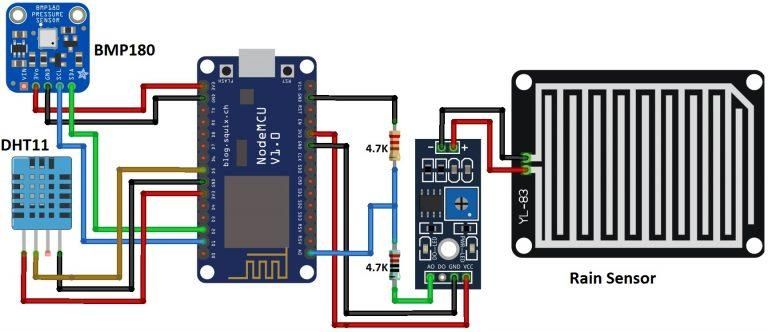
5 Circuit Diagram
The circuit diagram of our proposed system is given
below. The diagram represents the connection of the
sensor and how the connection will be done.
Fig 1.: The proposed model architecture of weather
monitoring system.
4.1 Sensors, Gateway, and Data logging
Fig.2. Circuit diagram of the weather monitoring system
4.1.1 Gateway or data collector: In our proposed
The Dht11 sensor, BMP 180 sensor, rain sensor, all are
system, nodeMCU works as a gateway of the model.
connected with the node MCU pins and the power
From the connection of the system, data is sent to the
supply is done by USB cable to connect the hardware to
local network and that will display on the web page of
the system. The prototype model is represented in the
our pc.
above images. All the connections should be done in the
same manner then will get a proper result. The below
4.1.2 Mode 1 Sensor (Temperature and humidity
tables show the pin connection for each sensor.
Sensor): DHT11 sensor allows us to measure both to
temperature and humidity of our system. This sensor
operates at 5V and utilizes a current of 2.5 mA. The
Table 3. Pin configuration between node MCU and
sensor can consider temperature values from 0 degrees to
DHT1
50 degrees. The humidity measures from 20%-90%.
With an accuracy of +_ 1 degree and +-1 % as well. It
VCC 3V3
uses 3 to 5V power and input/output.
⮚ It has 2.5 mA max current usage during DATA D5
conversion.
⮚ It is good for 20-80% humidity with an GND GND
accuracy of 5%
⮚ It is just good for)-50 degree Celsius. Table 4. Pin Configuration between node MCU and
⮚ It has 4 pins with 0.1 spacing between them BMP sensor
SDA D2
4.1.3 Mode 2 Sensors (Barometric pressure)
BMP 180 is a digital barometric pressure sensor that SCL D1
measures the pressure of the environment. It follows
BMP085 and brings many enhancements. GND GND
⮚ It has ultra-low power consumption down to VIN 3V3
3micro ampere
⮚ It operates on 3 to 5V dc voltage
⮚ The pressure-sensing rate of BMP 180 is 300- Table 5. Pin Configuration between node MCU and Rain
1100 hPa (9000-500m above the sea level) sensor:
A0 GND (including with 4.7k
register)
6ITM Web of Conferences 40, 01006 (2021) https://doi.org/10.1051/itmconf/20214001006
ICACC-2021
GND GND code there and click on verify and wait for almost 1-2
min to complete verification and then choose an option
VCC 3V3 to upload the code then it compiles successful and done
uploading successfully. After that open the serial
6 Flow chart of the proposed model monitor. There, it shows that system is connected with
Wi-Fi. When hardware connection is established, HTTP
request starts processing, and then it will show an IP
address on the serial monitor. Then copy the IP address
and paste it on a web browser like chrome, internet
explorer, opera, etc. You can select any browser and it
will show the corresponding temperature value,
humidity, pressure, and rain value. The result is showing
below
Fig.4. Final Result another web page
Hence, the above fig.4 shows the result on the webpage
contains different parameters information from the
weather. As the weather of Gorakhpur region is very
cold and rain possibility is also very high. The
temperature, pressure, and rain sensor have a different
variation available.
Fig.3. Flow chart of the proposed model
The flowchart describes the functioning of our proposed
8 Experimental Results and Analysis
system. This proposed system is developed as a weather
monitoring system for the Gorakhpur region. This The function of “weather monitoring system using IOT”,
system is comprising of only three sensors and display the agenda of this system to design a system which keeps
the result on the webpage using HTTP. track of weather condition and simultaneously measuring
environmental variables through the internet of things.
Fig shows a prototype development for a weather
7 Working Process monitoring system with some parameters. The developed
After making all the connections as shown in fig.2. The weather monitoring system monitor different parameters
power supply is provided to node MCU through a USB like humidity, pressure rain value, etc. After making the
cable. Which is connected with our personal computer. connection as per in fig.2 the value from the temperature
We have written two code modules. The first one is to and humidity sensor, pressure sensor, and rain sensor
connect to the different sensors in Arduino code and the value is observed on the webserver. Here we are storing
second code module is for the web page which is written observed data on the web server through HTTP requests
in java script. on the webpage.
Table 6.: Experimental reading obtained at
After providing connection to hardware. Then upload Kushinagar place (near Gorakhpur)
the code which we have written. But before uploading
code, it needs to verify. So, Open Arduino ide then write
7ITM Web of Conferences 40, 01006 (2021) https://doi.org/10.1051/itmconf/20214001006
ICACC-2021
Experimental result Experimental result
Date- 21 January 2021 Date-25 Jan 2021
S. Time Weathe Temp Humi Pressure Rain S. Time weather Temp Humi Pressure Rain
N. r eratur dity value value N. eratur dity value value
e value e value
value value
1. 9:00a Fog 14 °C 87% 1016mb 38 % 8:30a Cloudy 11 °C 78% 1019mb 29%
m ar 1. m ar
11:00a Cloudy 12°C 76% 1020mb 26%
2. 12:00 Cloudy 13 °C 78% 1018mb 32% 2. m ar
pm ar 2:30p Partially 16 °C 66% 1016mb 30%
Partiall 3. m sunny ar
3. 2:00p y 14 °C 72% 1019mb 34% 4:30p Sunny 72% 1015mb 28%
m sunny ar 4. m 15 °C ar
4. 5:00p Fog 15 °C 73% 1018mb 39%
m ar In table 8 we have measured the environment parameter
with the help of different sensors for Gida Location
In the above table, we have taken the weather Gorakhpur.
information of Kushinagar nearby Gorakhpur. We have This experiment is developed using a prototype model of
gathered sensor data on 21 January 2021 at different the environment. This has been developed within the
time slots. The sensed value is shown in table 6. Gorakhpur region in three different locations. The
locations are Kushinagar, MMMUT college Gorakhpur
Table 7: Experimental reading obtained at Gorakhpur and Gida Gorakhpur. Primarily we have tested in the
(MMMUT college) Kushinagar region in the month of January and dated 21
Jan 2021. Secondly in MMMUT college Gorakhpur and
Experimental result then Gida Gorakhpur location. We have placed
Date-25 Jan 2021 temperature and humidity sensors, pressure sensor, and
S. Tim Weat Temp Humidi Pressur Rain rain sensor and start detecting the environment’s
N. e her eratur ty e value value parameters. When the reading obtained from sensors, we
e value have tabulated all the readings captured through sensors
value according to their location, date, and time for analysis.
10a Fog 12 °C 88% 1018mb 30 % The sensor’s analysis is shown below.
1. m ar
11a Fog 14°C 78% 1019mb 32% 8.1Temperature
2. m ar As shown in table 6 we have first sensed temperature
12: Clou 16 °C 70% 1133mb 30% value at the Kushinagar location. On 21 January 2021, at
3. 30p dy ar time 9:00 am, we measure the minimum temperature as
m 7 and the maximum temperature is 21degree and found
2p Parti 15 °C 70% 101mba 28% the average temperature is 14 degrees and the real-time
4. m ally r temperature is 13 degrees. To analyse more, we have
sunn taken a temperature reading through the sensor at the
y different time slots. At 12pm, the average temperature or
relative temperature is 13 degrees and the weather is
Here, we have sensed the weather’s information for cloudy. On the same day, at 2:00 pm, the average
MMMUT college. In this experiment, we measured the temperature value is 14degree and next time instance the
temperature, humidity, rain, and pressure value dated 25 average temperature value is 15 degrees. Hence at all the
January 2021. The above table 7 represents the sensed time, we have compared with real-time temperature
value with our proposed model for MMMUT location. value we found that temperature value is approximately
Table 8: Experimental reading obtained at Gida accurate at Kushinagar place.
Gorakhpur Like, Kushinagar place, On 25 January 2021, we have
also measured temperature value at different time
instance of MMMUT College Gorakhpur Location is
shown in table 7 In the morning, at 10:00 am, we
measured average temperature value is 12 degree and
real-time temperature value is 12degree. At 11:am, the
average temperature value captured value is 12degree
and the real-time temperature is 13degree. Another time
interval is 12:30 pm, captured average temperature value
is 16degree but the real-time temperature is 15degree
and at 2:00 pm, the observed average temperature value
8ITM Web of Conferences 40, 01006 (2021) https://doi.org/10.1051/itmconf/20214001006
ICACC-2021
is 15degree, and the available real-time temperature is have seen that the pressure value is very much similar to
15degree. Hence in this way, we can say that at the real-time obtained data for the Kushinagar location.
MMMUT College Gorakhpur location the sensed In the same manner, we have sensed pressure value for
temperature value is extremely nearer to the real-time MMMUT College and Gida Gorakhpur location and we
temperature. found that observed pressure is nearer to the real-time
Same as the previous location, we have measured pressure value. The sensed pressure data is tabulated in
temperature value at Gida Location at multiple time table 7 and table 8.
instance on 26 January 2021 which is shown in table 8.
Now we measure the temperature value at 8:30 am, the 8.4 Rain
average temperature value is 11degree and the real-time Rain value is observed in percentage form. Like all the
temperature is 12degree. At 11:00 am, the relative above parameters is measured, the rain sensor value is
captured temperature value is 12degree and the real-time also measured. In the same way, the Rain value is
temperature is 13degree. At 2:30 pm, the observed measured and compared with real-time data and found
average temperature is 16degree and the actual that like other parameters it is also very much accurate.
temperature is 16degree and the last time instance, the So first we measure for Kushinagar location and the date
sensed average temperature data is 15degree and the is 21 January 2021. The average rain value is 38% at
real-time observed temp is 15 degrees. 9:00 pm and the real value is 35%. Again, we measured
Hence with the above result, we can say that the at 12:00pm, the average rain value is 32% and the
observed result through our proposed model is sensed instantaneous value is 33%. We measure again at
temperature data is closed by real-time data. another time i.e., 2:00 pm then the rain value is 34% and
at the same time, the real-time value is 33%. At 5:00 pm,
8.2 Humidity the rain value is 39% and the rain value in real-time is
As we have measured the temperature value of a 38%. These readings are obtained at the different time
particular location, in the same manner, we have slots. On the basis of the above rain value data, we can
measured the humidity value. Firstly, measure the say that it is almost similar to the real value. And we can
humidity value of Kushinagar then MMMUT College say the possibility of rain is less.
Gorakhpur, and then Gida Gorakhpur location. In Hence like the above location we have also analysed that
Kushinagar, the sensed humidity is 87 % and the the value of rain for MMMUT College and Gida location
humidity value in real-time is 89% at 9:00 am. Next, at is also the same and almost gives accurate values of rain
12:00pm, the average humidity percentage is 78% and value. For these two locations, the readings are available
the real-time humidity value is 77%. At 2:00 pm, the in table 7 and table 8.
average humidity value in percentage is 72% and in real- Hence with this experiment analysis, we can take an idea
time, the humidity value is 72%. And last time reading for our future planning. This will especially help in
which we have measured i.e., at 5:00 pm, humidity value industry, agriculture, and various field. So, if we provide
is 73% and real-time observed data is 74%. So, after this facility to the farmer to do an experiment with this
taking the reading for Kushinagar, we have analysed that system then they will collect data with these sensors and
humidity value is almost accurate when compared to the make analysis and perform their action according to the
real-time observed data through the internet. gathered information of weather.
Likewise, for MMMUT College and Gida Gorakhpur,
the humidity value is sensed through our proposed 9 Conclusion
model, dated on 25 Jan and 26 Jan 2021. We have seen Devices that monitor weather’s parameters with
that observed and real-time percentage value of humidity minimum cost in our proposed system. The proposed
gives nearly accurate value. We have sensed reading for system works on the client-side architecture model. The
both locations with date and time is shown in table 7 and proposed approach observed various environmental
table 8. information using multiple sensors. The system which is
designed has used less sensor than the existing model.
8.3 Pressure The main aim of our proposed model is to make the
Pressure value of Kushinagar, MMMUT College system cost-effective, affordable. So that everyone can
Gorakhpur and Gida Gorakhpur is observed and is use it freely. In our proposed system, capturing multiple
referred to in table 6, table and table. The first reading data from multiple sensors and send all the data to the
has been taken for the Kushinagar location and tabulated webpage by HTTP request protocol on the webserver.
in table 6. The first reading is taken at 9:00 am and the Here, the proposed system performs working in the
average value of pressure is 1016mbar (millibar pressure region of Gorakhpur. In this region, we have sensed the
unit) and the real-time pressure value is 1016mbar. Next, value for three locations i.e. Kushinagar, MMMUT
at 12:00pm, the average pressure value is 1018 mbar and College, and Gida Gorakhpur. Then we have arranged all
the average pressure value in real-time is 1018mbr. Next the values in table form with respect to their data and
at 2:00 pm, the pressure value on average is 1019mbar time and done analysis. The proposed model is not only
and the real pressure value is 1017mbar. And at 5:00 pm, collecting data but also making decisions on the basis of
the average value of pressure is 1018 and the real-time observed data. It is very much helpful for farmers
pressure value is 1018mbr. Hence in this way, we have because it collects environmental data making an
observed and compare with real-time pressure and we interpretation for the former. But it is also very important
9ITM Web of Conferences 40, 01006 (2021) https://doi.org/10.1051/itmconf/20214001006
ICACC-2021
for making another decision such as or industry work [12] Yashaswi Rahul, Rimsha Afreen, Divya Kamini
purpose, transportation. The accuracy of the proposed “Smart weather monitoring and real-time alert system
model nearly accurate with real data using IoT” International Research Journal of
Engineering and Technology (IRJET) Volume: 05 Issue:
Reference 10, Oct(2018)
[13] Ravi Sharma, Shiva Prakash and Pankaj Kumar,
[1] Mary Nsabagwaa, Maximus Byamukamab, “Methodology, Applications and Challenges of WSN-
Emmanuel Kondelaa, “Towards a robust and affordable IoT”, IEEE International Conference of Electrical and
Automatic Weather Station “, journal homepage: Electronics Engineering (ICE3—2020), jointly
www.elsevier.com/locate/deveng. organized by Madan Mohan Malaviya University of
[2] Ravi Kishore Kodali and Snehashish Mandal “IoT Technology Gorakhpur and North Dakota State
Based Weather Station” 2016 International Conference University, Fargo, USA, Pid197, Feb. 14-15, (2020)
on Control, Instrumentation, Communication and [14] Garima Verma, Shiva Prakash, “A Comparative
Computational Technologies (ICCICCT) 978-1-5090- Study Based on Different Energy Saving Mechanisms
5240-0/16/$31.00, IEEE, (2016) Based on Green Internet of Things (GIoT)”, IEEE
[3] Ravi Kishore Kodali and Archana Sahu “An IoT 8thInternational Conference on Reliability, Infocom
based Weather Information Prototype Using WeMos” Technology and Optimization (ICRITO-2020),
2016 2nd International Conference on Contemporary IEEE Conference Record Number 48877, Amity
Computing and Informatics (ic3i), 978-1-5090-5256- University, Noida, India, Pid631, June 4-05, (2020)
1/16/$31.00, IEEE, (2016)
[4] Zi-Qi Huang, Ying-Chih Chen and Chih-Yu Wen, [15] Ferdin Joe John Joseph “IoT Based Weather
“Real-Time Weather Monitoring and Prediction Using Monitoring System for Effective Analytics
City Buses and Machine Learning”, Vols. 3 to 21 “International Journal of Engineering and Advanced
Published 10 September (2020) Technology (IJEAT) ISSN: 2249 – 8958, Volume-8
[5] Kavya Ladi, A V S N Manoj, G V N Deepak, “IOT Issue-4, April (2019)
Based Weather Reporting System to Find Dynamic [16] Raj Kumar, Shiva Prakash, “Performance &
Climatic Parameters”, International Conference on Parametric Analysis of IoT's Motes with Different
Energy, Communication, Data Analytics and Soft Network Topologies”, International Conference on
Computing (ICECDS-2017) Electrical and Electronics Engineering, jointly organized
[6] P. Susmitha, G. Sowmyabala “Design and by School of Engineering The University of Malaya,
Implementation of Weather Monitoring and Controlling Kuala Lumpur, Malaysia & Centre of Excellence- Power
System”, International Journal of Computer Applications Engineering and Clean Energy Integration, Galgotias
(0975 – 8887) Volume 97– No.3, (July 2014) University, India in the collaboration with NPTI, Pid
[7] Tanmay Parashar1, Shobhit Gahlot2, Akash 175, January 2nd -3rd, (2021)
Godbole3, Y.B. Thakare4 “Weather Monitoring System [17] Garima Verma, Shiva Prakash, “Emerging Security
Using Wi-Fi”, (IJSR) ISSN (Online): 2319-7064 Index Threats, Countermeasures, Issues and Future Aspects on
Copernicus Value (2015): 78.96, 2015 Internet of Things (IoT): A Systematic Literature
[8] Nutant Sabharwal, Rajesh Kumar, Abhishek Thakur, Review”, 2nd International Conference on Future
Jitender Sharma “A LOW-COST ZIGBEE BASED Learning Aspects of Mechanical Engineering (FLAME
AUTOMATIC WIRELESS WEATHER STATION 2020), Organized by Department of Mechanical
WITH GUI AND WEB HOSTING FACILITY” e-ISSN: Engineering, Amity School of Engineering &
1694-2310 | p-ISSN: 1694-2426, Vol. 1, Spl. Issue 2 Technology. Amity University, Noida, Uttar Pradesh,
(May 2014) India, Pid 231, August 5th -7th(2020)
[9] M. Prasanna, M. Iyapparaja, M. Vinothkumar, B [18] Saijshree Srivastava, Shiva Prakash, “An Analysis
Ramamurthy, S.S. Manivannan,” An Intelligent Weather of Various IoT Security Techniques: A Review”, IEEE
Monitoring System using Internet of Things”, 8thInternational Conference on Reliability, Infocom
International Journal of Recent Technology and Technology and Optimization (ICRITO-2020),
Engineering (IJRTE) ISSN: 2277-3878, Volume-8 Issue- IEEE Conference Record Number 48877, Amity
4, November (2019) University, Noida, India IA, Pid360, June 4-05(2020)
[10] Mircea Popa and Catalin Iapa “Embedded Weather [19] Garima Verma and Shiva Prakash, “Internet of
Station with Remote Wireless Control”, 19th Things for Healthcare: Research Challenges and Future
Telecommunications forum TELFOR 2011 Serbia, Prospects”, Springer, 1st International Conference on
Belgrade, November 22-24, 2011, 978-1-4577-1500- Advanced Communication and Computational
6/11/$26.00, IEEE, 2011 Technology (ICACCT), NIT Kurukshetra, Kurukshetra,
[11] T.R.V. Anandharajan G. Abhishek Hariharan, K.K. Haryana, India, Pid 75, December 6-7, (2019)
Vignajeth, R. Jijendiran4kushmita “Weather Monitoring
Using Artificial Intelligence” 2016 International
Conference on Computational Intelligence and
Networks. 2375-5822/16 $31.00, IEEE DOI
10.1109/CINE.2016.26, (2016)
10You can also read