PROPOSED* Qualified Timberland Property Appraisal Manual - Georgia Department of Revenue
←
→
Page content transcription
If your browser does not render page correctly, please read the page content below

*PROPOSED*

       Georgia Department of Revenue

 Qualified Timberland Property
        Appraisal Manual
                March 2020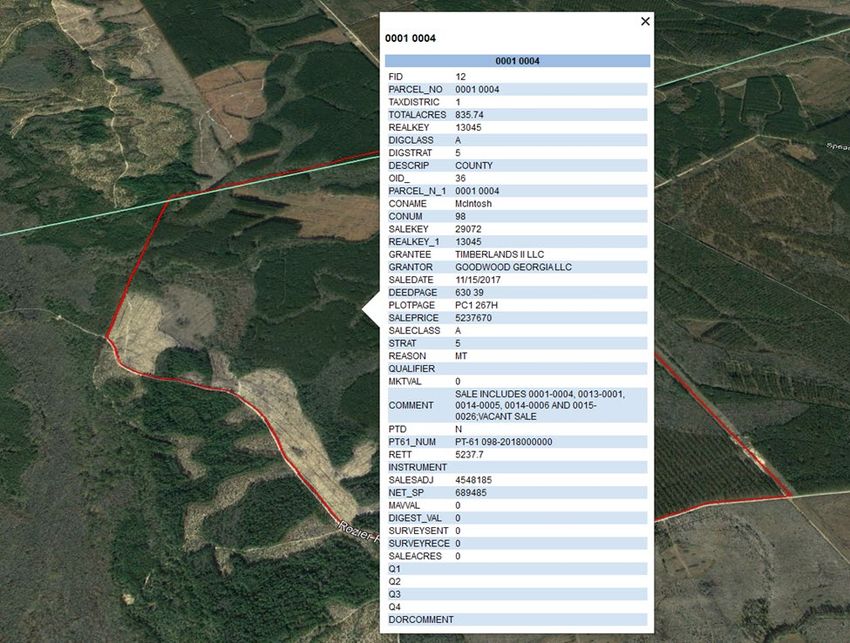
State of Georgia

      David M. Curry
                                   Department of Revenue                                  Ellen Mills
                                           4125 Welcome All Road
      Commissioner                                                                         Director
                                           Atlanta, Georgia 30349
                                               (404) 724-7000

                                              March 3, 2020

To:     Members of the Public and County Tax Officials

From: David M. Curry, Commissioner of the Georgia Department of Revenue

Re:     Qualified Timberland Property Appraisal Manual

This manual has been developed by the Department of Revenue for the purpose of fulfilling the
Commissioner’s responsibility to adopt and maintain a qualified timberland property appraisal manual that
shall be used by the Department in the appraisal of qualified timberland property for ad valorem tax
purposes.

The information contained in this manual is provided pursuant to the requirements of O.C.G.A. §§ 48-5-600
through 48-5-607, and as such contains the complete parameters for the appraisal of qualified property
including a Commercial Timberland Table of Per Acre Values, projected Forest Land Conservation Use Table
of Values, and a formula to ensure that the final Qualified Timberland Property Fair Market Value is no less
than 175% of such property’s Forest Land Conservation Use Value.

The staff of the Local Government Services Division looks forward to the administration of the Qualified
Timberland Property Program and are available to provide information or clarification upon request.

Respectfully submitted,

David M. Curry
State Revenue Commissioner

                                                                                                          1
Contents
PROGRAM OVERVIEW ..............................................................................................................................................3
CLASSIFICATION AND APPRAISAL CONCEPTS.................................................................................................................4
REGISTRATION, APPLICATION, AND RETURN ................................................................................................................5
   Notice to County: Certification (or Decertification) of Qualified Taxpayer .....................................................7
CALCULATING THE QTP FAIR MARKET VALUE ..............................................................................................................8
   Property Location.............................................................................................................................................8
       Ecological Region (1-4) .................................................................................................................................8
       Conservation Use Valuation Districts (1-9) ..................................................................................................9
       Location Assignment by County................................................................................................................ 10
   Soil Type ........................................................................................................................................................ 11
       Soil Class Delineation ................................................................................................................................ 11
   Tables of Per Acre Values.............................................................................................................................. 13
       2020 Commercial Timberland Table of Per Acre Values .......................................................................... 13
       ‘Projected’ 2020 Forest Land Conservation Use Table of Values ............................................................. 14
   Final Value and Comparison ......................................................................................................................... 15
       Notice to Taxpayer: QTP Assessment ....................................................................................................... 16
REGULATIONS....................................................................................................................................................... 17
   560-11-16-.01 Application of Subject ........................................................................................................... 17
   560-11-16-.02 Definitions ............................................................................................................................. 17
   560-11-16-.03 Applications ........................................................................................................................... 18
   560-11-16-.04 Appeals .................................................................................................................................. 19
   560-11-16-.05 Table of Commercial Timberland Per Acre Values by Ecological Region and Soil Productivity
   Classification ................................................................................................................................................. 20
THE VALUATION APPROACHES ................................................................................................................................ 21
   Department of Revenue - Market Approach Methodology ......................................................................... 21
   University of Georgia - Income Approach Methodology .............................................................................. 27
   Reconciliation of Market and Income Approaches....................................................................................... 28

                                                                                                                                                                      2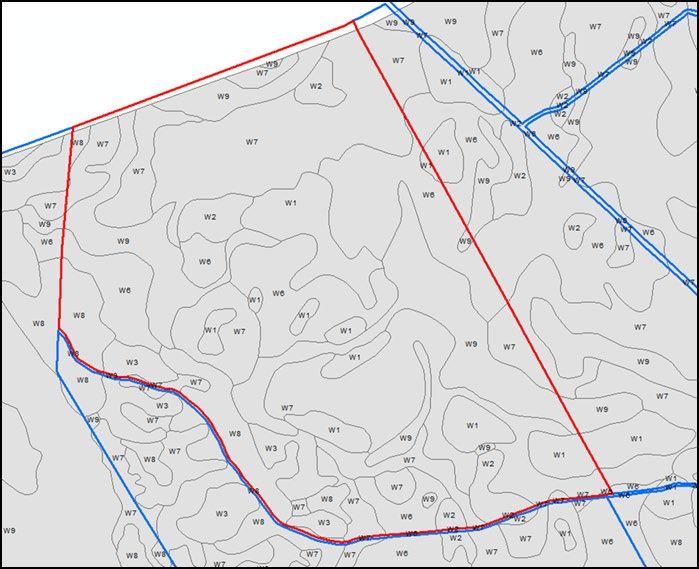
PROGRAM OVERVIEW

On November 6, 2018, Georgia voters approved a constitutional amendment 1, which created a new sub-
classification of property for ad valorem tax purposes, known as Qualified Timberland Property (QTP). The
new law directed the Georgia Department of Revenue (Department) to develop a ‘Qualified Timberland
Property Appraisal Manual’ including a regional table of values to be used by the commissioner in the appraisal
of such timberland property beginning in tax year 2020 2.

To facilitate the initial development of the ‘Qualified Timberland Property Appraisal Manual’, the Department
contracted with the University of Georgia for consulting services provided by experts of the Warnell School of
Forestry and Natural Resources. University consultants applied income valuation methodologies designed to
estimate bare land values by calculating the present value of perpetual periodic timber incomes. During the
same timeframe, Department appraisal staff employed a market approach valuation methodology, where
sales prices of commercial timberland tracts were identified, analyzed, and adjusted to determine bare land
transaction values. The Department ensured that commercial timberland sales prices were adjusted for the
value of exempt standing timber included in each transaction.

The objective of the Department and UGA was to create a table of values, by ecoregion and soil productivity,
that mirrored the amount a knowledgeable buyer would pay, and willing seller would accept, for commercial
timberland in a bona fide arms-length transaction, while recognizing that the value of standing/growing
timber must be excluded from the assessment 3. The findings of the University and the Department were
reconciled and weighted resulting in the ‘Commercial Timberland Table of Per Acre Values’ to be used in the
appraisal of Qualified Timberland Property. Additionally, per Georgia statute, the final determination of the
‘Qualified Timberland Property Fair Market Value’ of any property shall be no less than 175% of such
property’s Forest Land Conservation Use Value 4.

Property owners desiring to enter property in the QTP program must register with the commissioner and must
file a return and application requesting approval for the assessment program. Under the new code,
‘timberland property’ is defined as tangible real property that has as its primary use the bona fide production
of trees for the primary purpose of producing timber for commercial uses. Property qualifying for special
assessment as Qualified Timberland Property must meet additional requirements including (1) the timberland
property must be at least 50 contiguous acres; (2) the production of trees must be for the purpose of making
a profit; (3) the production of trees must be the primary activity taking place on the property; and (4) a
consistent effort must be clearly demonstrated in land management in accordance with accepted commercial
forestry practices, which may include reforestation, periodic thinning, undergrowth control of unwanted
vegetation, fertilization, prescribed burning, sales of timber, and maintenance of firebreaks.

When such property can be reasonably classified as qualified timberland property, the commissioner shall
appraise the property according to the provisions adopted in the ‘Qualified Timberland Property Appraisal
Manual’ and shall deliver an appraisal to the county board of assessors by July 1st of each year.

1
  2017-2018 General Assembly Regular Session - HB85 and HR51
2 Title 48, Chapter 5, Article 13 – Ad Valorem Taxation of Qualified Timberland Property
3 O.C.G.A. 48-5-7.5 “standing timber shall be assessed for ad valorem taxation only once …”
4 O.C.G.A. 48-5-271. Table of values for conservation use value of forest land.

                                                                                                             3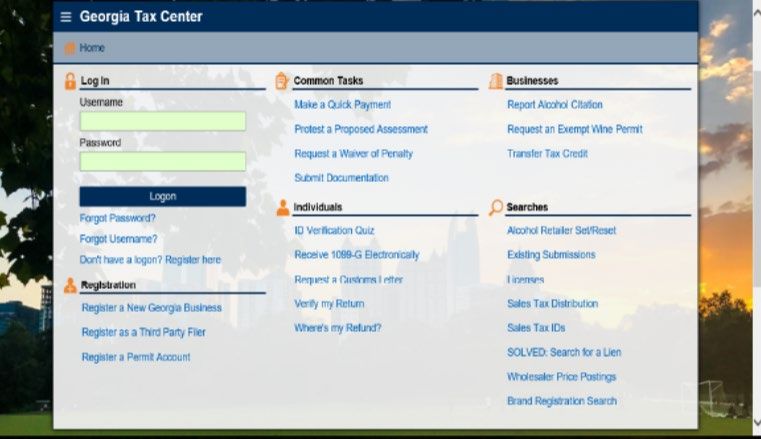
CLASSIFICATION AND APPRAISAL CONCEPTS

The appraisal of property begins with a determination of the definition of value sought and the accurate
identification and classification of the subject property being appraised.

For ad valorem tax appraisal purpose, ‘Fair Market Value’ is defined in Georgia Code as the amount a
knowledgeable buyer would pay for the property and a willing seller would accept for the property at an arm's
length, bona fide sale. The income approach, if data are available, shall be considered in determining the fair
market value of income-producing property. 5 In addition, the Georgia Constitution requires that all ad
valorem taxation be uniform upon the same class of subjects within the territorial limits of the authority
levying the tax 6. Uniformity in ad valorem taxation is designed to ensure, as near as possible, that each
taxpayer is required to pay only their fair proportionate share of the tax burden.

Certain property classifications in Georgia are appraised and taxed strictly according to existing use value even
though such property’s fair market value may yield a higher appraisal. Provisions in the Georgia Constitution
exempt such special classifications from the uniformity requirement. Two of these special classifications
include Bona Fide Conservation Use and Forest Land Conservation Use properties. Both require the taxpayer
to maintain the subject property in a qualifying use for a 10-year covenant period or risk a tax penalty.
Qualified Timberland Property is not subject to 10-year covenants or tax penalties and is appraised by the
Department using a table of per acre fair market values based on ecoregion and soil productivity relative to
properties bought and sold for use as commercial timberland. In addition, the final QTP valuation calculation
ultimately ensures that no property’s appraisal is less than 175 percent of such property’s Forest Land
Conservation Use value.

‘Appraisal Principles’ are the basic economic concepts underlying appraisal. They include Anticipation,
Balance, Change, Conformity, Contribution, Substitution, Competition, Demand, Highest and Best Use, and
the Law of Variable Proportions. 7 ‘Highest and Best Use’ requires that each property be appraised as though
it were being put to its most profitable use, given probable legal, physical, and financial constraints. 8 When
classifying property for a market value estimation, it is necessary to determine which of the competing uses
is the highest and best use, and for tax purposes that use must be a probable use and not an unlikely or
speculative one. A potential use that yields a high immediate income, but for a short duration, may not be as
valuable as a use that results in a lower, but more prolonged income stream. The way in which a property is
used plays an essential role in its value. However, almost all property is subject to competing uses, and in
time, the highest and best use of a property may change. 9

In classifying property as Qualified Timberland Property for appraisal by the Department at fair market value
using this manual, the subject property should have both its ‘existing use’ and reasonably determined ‘highest
and best use’ as the good faith, real, actual, and genuine production of trees for commercial uses where such
use is demonstrated with evidence.

5 O.C.G.A. 48-5-2. Definitions.
6
  Georgia Constitution Article VII, Section I, Paragraph III. Uniformity; classification of property; assessment of agricultural land; utilities
7 International Association of Assessing Officials – Glossary for Property Appraisal and Assessment, Second Edition
8 International Association of Assessing Officials – Glossary for Property Appraisal and Assessment, Second Edition
9 International Association of Assessing Officials – Property Appraisal and Assessment Administration, Chapter 4; Appraisal Theory

                                                                                                                                                   4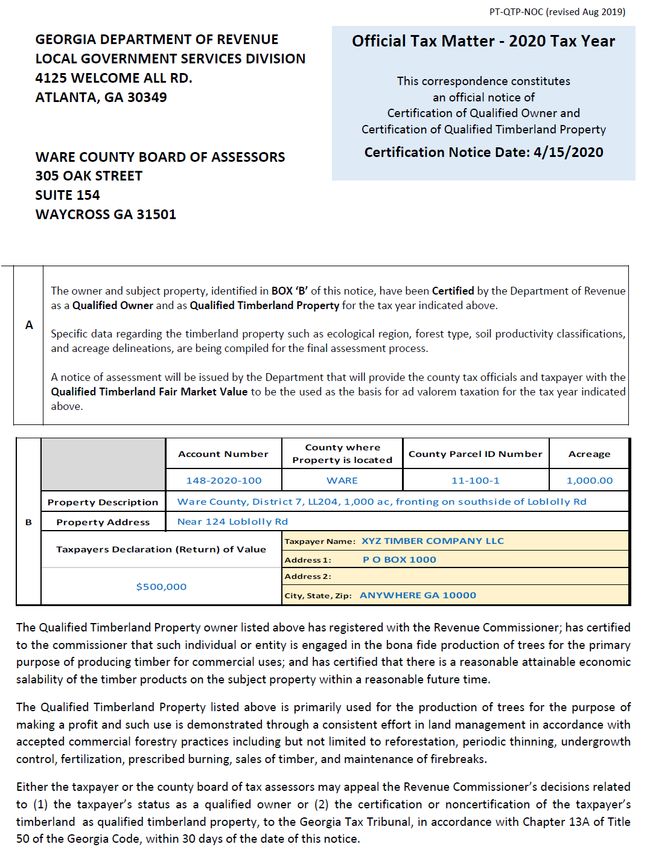
REGISTRATION, APPLICATION, AND RETURN

Beginning January 1, 2020, property owners desiring the benefit of Qualified Timberland Property assessment
must register online with the Department via the Georgia Tax Center (GTC). The Georgia Tax Center is a one-
stop shop for electronic filing which enables entities across the nation to file returns required to be submitted
to the Georgia Revenue Commissioner (e.g. sales and use tax, withholding tax, 911 fees, motor fuel tax, alcohol
licensing applications). Electronic filing in GTC reduces the chances of return errors; provides a secure-
encrypted method of delivery; is available 24 hours, 7 days per week; and saves time and money.

                                             https://gtc.dor.ga.gov

GTC has been modified to accept Qualified Timberland Property owner registration, application, and return
functions. Companies who have previously registered in the Georgia Tax Center for other tax types, must
login to GTC to add Central Assessment to their existing profile. In addition, county tax offices must also
register with GTC in order to view correspondence issued by the Department. Central Assessment is a unit
within the Local Government Services Division of the Georgia Department of Revenue responsible for the
following duties:

            1.   Appraisal of public utilities, railroads, and airline flight equipment
            2.   Appraisal, tax collection, and tax distribution on railroad equipment companies
            3.   Collection and distribution of payments in lieu of tax made by Tennessee Valley Authority
            4.   Collection and distribution of Public Service Commission fees
            5.   Tax collection on certain chartered railroads
            6.   Appraisal of Qualified Timberland Property

                                                                                                               5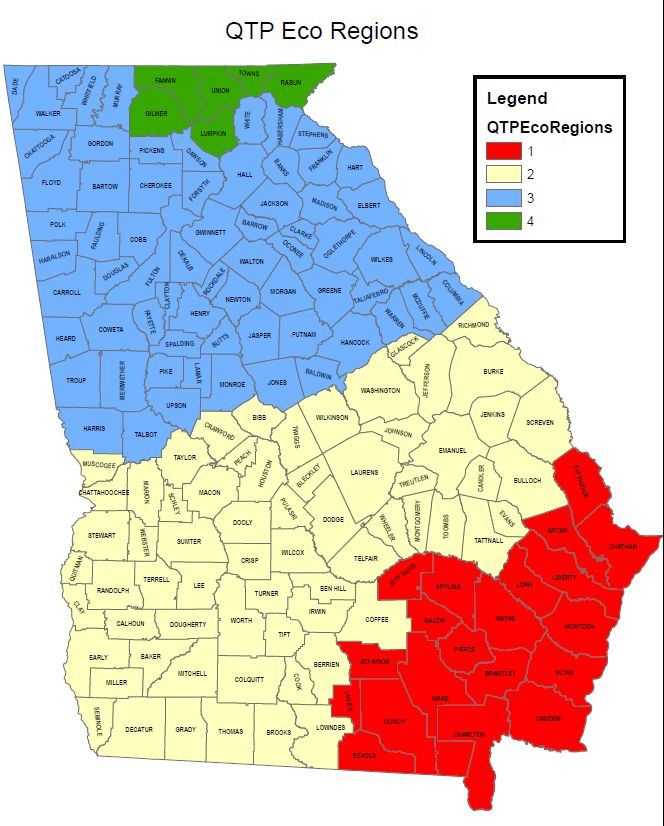
Once registered in GTC, property owners will then be able to electronically file an application and return
requesting assessment under the Qualified Timberland Property program. Applications must be filed annually
between January 1st and March 1st. Failure to annually renew the QTP application will result in the property
being decertified for the program.

The online application will enable the property owner to calculate an estimated QTP value before submitting
their final request for this special assessment. In addition, the system will prompt the owner to provide
descriptive information about the property and to upload a written forest management plan.

                                                                                                          6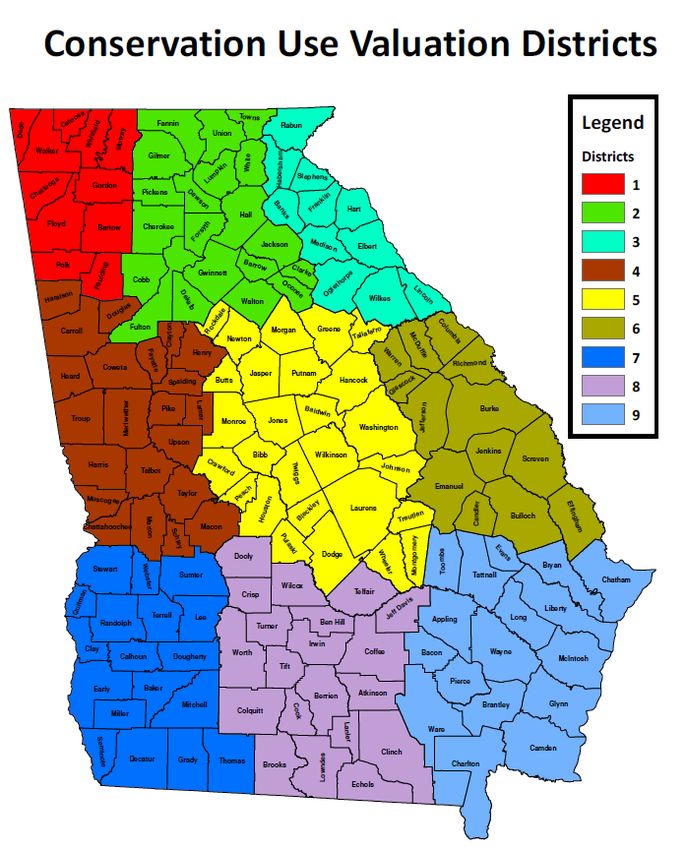
Notice to County: Certification (or Decertification) of Qualified Taxpayer

By April 15th each year, a notice will be provided to each county detailing the property within their
jurisdiction that has been certified or decertified for the QTP program.

                                                                                                        7
CALCULATING THE QTP FAIR MARKET VALUE

The calculation of Qualified Timberland Property Fair Market Value (QTP-FMV) requires identification of
location (Ecoregion and Conservation Use Value Assessment District); classification of soil types and
associated productivity ratings (W1-W9); application of tables of value (Commercial Timberland and Forest
Land Conservation Use); and a final value computation equaling the greater of Commercial Timberland Value
or 175% of Forest Land Conservation Use Value.

Property Location

The valuation tables have been established using a combination of location-specific income capitalization and
sales comparison data. Therefore, the first step in finding a QTP-FMV requires determining two location
factors; one developed according to Ecological Region, and another developed according to Conservation Use
Value Assessment District.

Ecological Region (1-4)

The United States Department of Agriculture (USDA) Forest Service has established geographic areas, known
as ‘eco-regions’, where properties share similar attributes such as climate, precipitation, temperature,
vegetation, soils, and terrain. These attributes affect forest growth rates, and by extension timberland
productivity and value. The Department has adopted four major regions, from these areas defined by the U.S.
Forest Service, for the purpose of developing the Commercial Timberland Table of Values.

    1.   Lower Coastal Plain
    2.   Upper Coastal Plain
    3.   Piedmont and Ridge-Valley
    4.   Blue Ridge Mountains

                                                                                                           8
Conservation Use Valuation Districts (1-9)

The United States Department of Agriculture (USDA) National Agricultural Statistics Service (NASS) has
established nine reporting districts within the State of Georgia to facilitate surveys and reporting of
agricultural statistics. Pursuant to O.C.G.A. 48-5-269.1, the Department has established by regulation nine
Conservation Use Valuation Assessment districts (CUVA 1 through CUVA 9) according to NASS designations
for the purpose of establishing the Forest Land Conservation Use Table of Values.

   1.   Northwest
   2.   North Central
   3.   Northeast
   4.   West Central
   5.   Central
   6.   East Central
   7.   Southwest
   8.   South Central
   9.   Southeast

               Illustration: Location Assignment for 1,000 acres located in Ware County

                                             Ecoregion =    #1

                                             CUVA District = #9

                                                                                                         9
Location Assignment by County
County Ecological Region Conservation Use County Ecological Region Conservation Use
County Name County Name
Number (1-4) Value Area (1-9) Number (1-4) Value Area (1-9)
1 APPLING 1 9 81 JEFFERSON 2 6
2 ATKINSON 1 8 82 JENKINS 2 6
3 BACON 1 9 83 JOHNSON 2 5
4 BAKER 2 7 84 JONES 3 5
5 BALDWIN 3 5 85 LAMAR 3 4
6 BANKS 3 3 86 LANIER 1 8
7 BARROW 3 2 87 LAURENS 2 5
8 BARTOW 3 1 88 LEE 2 7
9 BEN HILL 2 8 89 LIBERTY 1 9
10 BERRIEN 2 8 90 LINCOLN 3 3
11 BIBB 2 5 91 LONG 1 9
12 BLECKLEY 2 5 92 LOWNDES 2 8
13 BRANTLEY 1 9 93 LUMPKIN 4 2
14 BROOKS 2 8 94 MACON 2 4
15 BRYAN 1 9 95 MADISON 3 3
16 BULLOCH 2 6 96 MARION 2 4
17 BURKE 2 6 97 MCDUFFIE 3 6
18 BUTTS 3 5 98 MCINTOSH 1 9
19 CALHOUN 2 7 99 MERIWETHER 3 4
20 CAMDEN 1 9 100 MILLER 2 7
21 CANDLER 2 6 101 MITCHELL 2 7
22 CARROLL 3 4 102 MONROE 3 5
23 CATOOSA 3 1 103 MONTGOMERY 2 5
24 CHARLTON 1 9 104 MORGAN 3 5
25 CHATHAM 1 9 105 MURRAY 3 1
26 CHATTAHOOCHEE 2 4 106 MUSCOGEE 2 4
27 CHATTOOGA 3 1 107 NEWTON 3 5
28 CHEROKEE 3 2 108 OCONEE 3 2
29 CLARKE 3 2 109 OGLETHORPE 3 3
30 CLAY 2 7 110 PAULDING 3 1
31 CLAYTON 3 4 111 PEACH 2 5
32 CLINCH 1 8 112 PICKENS 3 2
33 COBB 3 2 113 PIERCE 1 9
34 COFFEE 2 8 114 PIKE 3 4
35 COLQUITT 2 8 115 POLK 3 1
36 COLUMBIA 3 6 116 PULASKI 2 5
37 COOK 2 8 117 PUTNAM 3 5
38 COWETA 3 4 118 QUITMAN 2 7
39 CRAWFORD 2 5 119 RABUN 4 3
40 CRISP 2 8 120 RANDOLPH 2 7
41 DADE 3 1 121 RICHMOND 2 6
42 DAWSON 3 2 122 ROCKDALE 3 5
43 DECATUR 2 7 123 SCHLEY 2 4
44 DEKALB 3 2 124 SCREVEN 2 6
45 DODGE 2 5 125 SEMINOLE 2 7
46 DOOLY 2 8 126 SPALDING 3 4
47 DOUGHERTY 2 7 127 STEPHENS 3 3
48 DOUGLAS 3 4 128 STEWART 2 7
49 EARLY 2 7 129 SUMTER 2 7
50 ECHOLS 1 8 130 TALBOT 3 4
51 EFFINGHAM 1 6 131 TALIAFERRO 3 5
52 ELBERT 3 3 132 TATTNALL 2 9
53 EMANUEL 2 6 133 TAYLOR 2 4
54 EVANS 2 9 134 TELFAIR 2 8
55 FANNIN 4 2 135 TERRELL 2 7
56 FAYETTE 3 4 136 THOMAS 2 7
57 FLOYD 3 1 137 TIFT 2 8
58 FORSYTH 3 2 138 TOOMBS 2 9
59 FRANKLIN 3 3 139 TOWNS 4 2
60 FULTON 3 2 140 TREUTLEN 2 5
61 GILMER 4 2 141 TROUP 3 4
62 GLASCOCK 2 6 142 TURNER 2 8
63 GLYNN 1 9 143 TWIGGS 2 5
64 GORDON 3 1 144 UNION 4 2
65 GRADY 2 7 145 UPSON 3 4
66 GREENE 3 5 146 WALKER 3 1
67 GWINNETT 3 2 147 WALTON 3 2
68 HABERSHAM 3 3 148 WARE 1 9
69 HALL 3 2 149 WARREN 3 6
70 HANCOCK 3 5 150 WASHINGTON 2 5
71 HARALSON 3 4 151 WAYNE 1 9
72 HARRIS 3 4 152 WEBSTER 2 7
73 HART 3 3 153 WHEELER 2 5
74 HEARD 3 4 154 WHITE 3 2
75 HENRY 3 4 155 WHITFIELD 3 1
76 HOUSTON 2 5 156 WILCOX 2 8
77 IRWIN 2 8 157 WILKES 3 3
78 JACKSON 3 2 158 WILKINSON 2 5
79 JASPER 3 5 159 WORTH 2 8
80 JEFF DAVIS 1 8
10Soil Type
The Department developed nine (9) soil class productivity ratings for QTP properties based on the prescribed
methodology for determining soil productivity classes for Forest Land Protection Act (FLPA) properties
pursuant to Department Regulation 560-11-10-.09(3)(b)2(i) and 560-11-11-.12. Providing nine soil
productivity classes for QTP properties ensures a more uniform appraisal process in the application of 175
percent of Forest Land Conservation Use Value pursuant to OCGA 48-5-601(e).
Recent soil symbol data was downloaded, by county, from the United States Department of Agriculture
(USDA) Natural Resources Conservation Service (NRCS) website. The NRCS data contains soil symbol spatial
GIS (Geographic Information System) data as well as tabular reporting data for soils within each county. The
soil symbol is converted to one of nine QTP soil class productivity ratings (W1-W9) by measure of the adjusted
site index for loblolly pine timber. Loblolly pine timber serves as the basis for soil symbol conversion due to
the species’ prevalence statewide. Adjustment factors for seedling mortality and equipment limitation are
applied to the site index to account for county specific soil conditions relative to climate conditions, erosion,
and topography. QTP soil class productivity ratings (W1-W9) are applied by measure of the adjusted site index
using the conversion chart below.
Adjusted Site Index (SI) Class
0 9 W9
10 59 W8
60 69 W7
70 74 W6
75 79 W5
80 80 W4
81 84 W3
85 89 W2
90 101 W1
Soil Class Delineation
The Department receives annual GIS parcel data from local county offices statewide as a Digest Submission
requirement. The required GIS parcel data must contain a minimum attribute database in addition to the
parcel property lines. Minimum attribute data must include but is not limited to the county map and parcel
number, the parcel’s legal/deeded acreage, the parcel’s digest classification code, the tax district code
applicable to the parcel, and a description of the tax district code applicable to the parcel for each parcel
appearing on the County Tax Digest for the year in which the digest is being submitted.
The Department downloads soil symbol GIS data from the United States Department of Agriculture (USDA)
Natural Resources Conservation Service (NRCS) website and converts those soil symbols to one of nine QTP
soil class productivity ratings (W1-W9) using the aforementioned methodology.
11County parcel data serves as the basis for parcel lines and legal/deeded acreage for each parcel by county.
Converted NRCS soil symbol GIS data serves as the basis for each QTP soil class productivity rating within each
parcel by county. The GIS data files (county and NRCS) are combined (unioned) in a GIS Environment. The
acreage calculations for QTP soil class productivity ratings are adjusted to total legal/deeded acreage to
account for inconsistencies in area calculations. The resulting file provides the Department with QTP soil class
productivity ratings (W1-W9), the acreage calculations for soil class productivity rating, and the applicable
parcel number by county.
Parcel soil map acreage delineation:
Example: Soil classification with productivity ratings by county:
Ware County (#148)
500 acres (BoB – Bonifay loamy sand) with productivity rating ‘2’
500 acres (FoB – Foxworth sand) with productivity rating ‘6’
12Tables of Per Acre Values
Determining the fair market value of qualified timberland property requires application of two separate
tables of value: (1) Commercial Timberland Table of Values, and (2) Forest Land Conservation Use Table of
Values.
2020 Commercial Timberland Table of Per Acre Values
The following Table of Per Acre Values represents a weighted reconciliation of the Market (50%) and Income
(50%) approaches developed to produce bare land ‘fair market’ values of land used for commercial timber
production in Georgia.
2020 COMMERCIAL TIMBERLAND TABLE OF PER ACRE VALUES
SOIL PRODUCTIVITY RATING
1 2 3 4 5 6 7 8 9
E 1 1,057 913 791 717 653 601 506 465 425
C
O
R 2 890 762 651 580 519 475 400 353 339
E
G 3 870 765 672 606 545 521 468 436 400
I
O
N 4 975 872 788 731 666 618 557 528 486
Example: Ware County is located in Ecoregion #1 and the subject property
contains 500 acres rated at soil productivity #2 and 500 acres rated at soil
productivity #6.
500 ac x $913 = 456,500
500 ac x $601 = 300,500
Total Value = 757,000 Commercial Timberland Value
13‘Projected’ 2020 Forest Land Conservation Use Table of Values
The following Table of Per Acre Values also represents a reconciliation of the Income (65%) and Market (35%)
approaches developed to produce bare land ‘current use’ values of property used primarily for the good faith
subsistence or commercial production of trees, timber, or other wood and wood fiber products from or on
the land including land conservation and ecological forest management in which commercial production of
wood and wood fiber products may be undertaken primarily for conservation and restoration purposes rather
than financial gain.
"Projected" 2020 FOREST LAND CONSERVATION USE TABLE OF PER ACRE VALUES
SOIL PRODUCTIVITY RATING
1 2 3 4 5 6 7 8 9
C 1 903 811 736 676 619 574 538 493 450
U
2 1,224 1,107 999 904 833 783 737 678 615
V
A 3 1,224 1,107 999 904 833 762 642 521 437
D 4 883 790 717 657 572 534 464 401 325
I
S
5 752 717 640 585 528 476 416 361 300
T 6 744 683 623 568 507 449 389 329 268
R
I 7 796 724 660 592 522 456 389 319 252
C
T 8 866 785 702 623 542 464 381 302 245
S
9 877 790 717 638 553 478 397 316 244
Example: Ware County is located in CUVA District #9 and the subject
property contains 500 acres rated at soil productivity #2 and 500 acres rated
at soil productivity #6.
500 ac x $790 = 395,000
500 ac x $478 = 239,000
Total Value = 634,000 Forest Land Conservation Use
14Final Value and Comparison
Pursuant to the newly approved Georgia Constitutional amendment and supporting statutes, the fair market
value of qualified timberland property shall be at least 175% of such property's forest land conservation use
value. This requires a final comparison to determine whether the value produced by the Commercial
Timberland Table of Values is at least 175% of the value produced by the Forest Land Conservation Use Table
of Values.
Example: The final QTP-FMV of the previously illustrated 1,000-acre tract in
Ware County is $1,109,500. The value produced by the 2020 Commercial
Timberland Table of Values is less than 175% of the property’s 2020 Forest
Land Conservation Use Value.
Forest Land Conservation Use Value = $634,000
Forest Land Conservation Use Value x 1.75% = $1,109,500
Commercial Timberland Value = $757,000
Qualified Timberland Property Fair Market Value = $1,109,500
For additional comparison, the fair market value produced using the 2019 Ware County Board of Assessors
in-house valuation schedules indicate that woodland with soil productivity rating of ’2’ is valued at $1980 per
acre and woodland with soil productivity rating of ‘6’ is valued at $1210 per acre. The Ware County valuation
schedule also allows for a tract size adjustment of .6832 for 1,000ac parcels. 10 While the county valuation
model allows for many other positive and negative adjustments (topography, flood plain, access, etc) a typical
woodland estimate may be as follows:
Example: Ware County Board of Assessors per acre woodland values by soil
productivity and size, assuming average accessibility and desirability:
500 ac x (productivity ‘2’) $1,980 = 990,000
500 ac x (productivity ‘6’) $1,210 = 605,000
1,595,000
Large Tract size adjustment factor .6832
Total Value 1,089,704 County Fair Mkt Value
10 Values taken from 2019 Ware County WinGap CAMA data and verified with county appraiser.
15Notice to Taxpayer: QTP Assessment
16REGULATIONS
560-11-16-.01 Application of Subject
Regulations in this Subject, 560-11-16, apply to the fair market valuation of Qualified Timberland Property
(QTP) in accordance with Article VII, Section I, Paragraph III (f.1) of the Constitution of Georgia and provided
for in Article 13 of Chapter 5 of Title 48 of the Georgia Code.
Statutory Authority: O.C.G.A. §§ 48-2-12, 48-5-600.1, 48-5-607.
560-11-16-.02 Definitions
As used in this Article, the term:
(a) “Bona Fide Production of Trees” means the good faith, real, actual, and genuine production of trees for
commercial uses.
(b) “Forest Management Plan” means a plan written by a registered forester to manage a forest stand. Forest
Management Plans may include, but are not limited to, information about soils, logging methods, disease or
insect problems, road conditions, growth and age data, environmental concerns, and recommended
silvicultural treatments and their timing.
(c) “Qualified Owner” means an individual or entity that meets the conditions of Code Section 48-5-603.
(d) “Qualified Timberland Property” (QTP) means timberland property that meets the conditions of Code
Section 48-5-604. Such property shall be classified as a separate and distinct class of tangible property for ad
valorem tax purposes.
(e) “Timberland Property” means tangible real property that has as its primary use the Bona Fide Production
of Trees for commercial uses.
Statutory Authority: O.C.G.A. §§ 48-2-12, 48-5-600, 48-5-607.
17560-11-16-.03 Applications
(1) All applications for certification as a Qualified Owner and for QTP certification shall be submitted
electronically through the Georgia Tax Center (GTC). No other filing method shall be permitted.
(2) Applications for certification as a Qualified Owner and for QTP certification must be filed annually with
the Revenue Commissioner between January 1 and March 1 of the applicable tax year.
(3) The applicant shall submit the following documentation to the Revenue Commissioner through GTC:
1. Application for QTP certification;
2. Evidence of the legal ownership of the property;
3. A legal description of the property for which QTP certification is sought, which must include parcel number
and:
(A) A plat of the property prepared by a licensed land surveyor, showing the location and measured
area of the parcel;
(B) A written legal description of the property delineating the metes and bounds and measured area;
or
(C) Such other alternative property boundary description as mutually agreed upon by the taxpayer
and the Revenue Commissioner that may accurately represent the parcel which is the subject of the
QTP application. An acceptable alternative property boundary description may include a parcel map
drawn by the county cartographer or GIS technician and signed by the county board of assessors and
taxpayer; and
4. Evidence that the property has as its primary use the Bona Fide Production of Trees for commercial uses,
which must include a Forest Management Plan. If it appears that the Forest Management Plan is not being
followed, the Revenue Commissioner may reject it, require an updated plan, or require additional evidence
that the plan is being followed.
(4) The applicant may also submit a soil map delineating the soil types on the property.
Statutory Authority: O.C.G.A. §§ 48-2-12, 48-5-603, 48-5-604, 48-5-607.
18560-11-16-.04 Appeals
(1) A taxpayer or county board of tax assessors may appeal the Revenue Commissioner's decisions related to
such taxpayer's status as a Qualified Owner; the certification or non-certification of such taxpayer's timberland
as QTP; or the appraised value of such taxpayer's QTP. Such appeals shall be made as an appeal to the Georgia
Tax Tribunal in accordance with Chapter 13A of Title 50 within 30 days of the Revenue Commissioner's
issuance of such decision.
(2) If the appraised value is disputed, an appeal may be made contesting the Revenue Commissioner’s
determination of the soil classification of any part or all of the QTP, as well as with regard to any alleged errors
made by the Revenue Commissioner in the application of the table of values or calculation of the minimum
threshold of value prescribed in the Constitution.
(3) A taxpayer, group of taxpayers, county board of tax assessors, or association representing taxpayers may
appeal the commissioner's decisions related to the commissioner's complete parameters for the appraisal of
QTP required by Code Section 48-5-602(d)(1). Such appeals shall be made as an appeal to the Georgia Tax
Tribunal in accordance with Chapter 13A of Title 50 within 60 days of the effective date of such manual.
Statutory Authority: O.C.G.A. §§ 48-2-12, 48-5-605, 48-5-606, 48-5-607.
19560-11-16-.05 Table of Commercial Timberland Per Acre Values by Ecological Region and Soil
Productivity Classification
(1) For the purpose of prescribing the 2020 table of values for use in the appraisal of Qualified Timberland
Property, the state shall be divided into four ecological regional valuation areas, and per acre values shall be
assigned to qualified land according to soil productivity classifications 1 – 9 (W1 – W9).
(a) Ecological region #1 includes the following counties: Appling, Atkinson, Bacon, Brantley, Bryan, Camden,
Charlton, Chatham, Clinch, Echols, Effingham, Glynn, Jeff Davis, Lanier, Liberty, Long, McIntosh, Pierce, Ware,
and Wayne. The following per acre values shall be applied to each qualified acre according to soil productivity
classifications W1 – W9:
W1-1,057, W2-913, W3-791, W4-717, W5-653, W6-601, W7-506, W8-465, W9-425.
(b) Ecological region #2 includes the following counties: Baker, Ben Hill, Berrien, Bibb, Bleckley, Brooks,
Bulloch, Burke, Calhoun, Candler, Chattahoochee, Clay, Coffee, Colquitt, Cook, Crawford, Crisp, Decatur,
Dodge, Dooly, Dougherty, Early, Emanuel, Evans, Glascock, Grady, Houston, Irwin, Jefferson, Jenkins, Johnson,
Laurens, Lee, Lowndes, Macon, Marion, Miller, Mitchell, Montgomery, Muscogee, Peach, Pulaski, Quitman,
Randolph, Richmond, Schley, Screven, Seminole, Stewart, Sumter, Tattnall, Taylor, Telfair, Terrell, Thomas,
Tift, Toombs, Treutlen, Turner, Twiggs, Washington, Webster, Wheeler, Wilcox, Wilkinson, and Worth. The
following per acre values shall be applied to each qualified acre according to soil productivity classifications
W1 – W9:
W1-890, W2-762, W3-651, W4-580, W5-519, W6-475, W7-400, W8-353, W9-339.
(c) Ecological region #3 includes the following counties: Baldwin, Banks, Barrow, Bartow, Butts, Carroll,
Catoosa, Chattooga, Cherokee, Clarke, Clayton, Cobb, Columbia, Coweta, Dade, Dawson, Dekalb, Douglas,
Elbert, Fayette, Floyd, Forsyth, Franklin, Fulton, Gordon, Greene, Gwinnett, Habersham, Hall, Hancock,
Haralson, Harris, Hart, Heard, Henry, Jackson, Jasper, Jones, Lamar, Lincoln, Madison, McDuffie, Meriwether,
Monroe, Morgan, Murray, Newton, Oconee, Oglethorpe, Paulding, Pickens, Pike, Polk, Putnam, Rockdale,
Spalding, Stephens, Talbot, Taliaferro, Troup, Upson, Walker, Walton, Warren, White, Whitfield, and Wilkes.
The following per acre values shall be applied to each qualified acre according to soil productivity
classifications W1 – W9:
W1-870, W2-765, W3-672, W4-606, W5-545, W6-521, W7-468, W8-436, W9-400.
(d) Ecological region #4 includes the following counties: Fannin, Gilmer, Lumpkin, Rabun, Towns, and Union.
The following per acre values shall be applied to each qualified acre according to soil productivity
classifications W1 – W9:
W1-975, W2-872, W3-788, W4-731, W5-666, W6-618, W7-557, W8-528, W9-486.
(2) The appraised value produced using the table of values in paragraph (1) of this Rule shall be determined
and, if needed, adjusted so that the final value is at least 175% of such property’s forest land conservation use
value.
Statutory Authority: O.C.G.A. §§ 48-2-12, 48-5-7, 48-5-602, 48-5-607.
20THE VALUATION APPROACHES
Department of Revenue - Market Approach Methodology
PURPOSE:
Establish a market approach ‘Table of Values’ for use by the commissioner in ad valorem tax appraisal of
Qualified Timberland Property.
DEFINITIONS:
‘Qualified timberland property’ means tangible real property that has as its primary use the good faith, real,
actual, and genuine production of trees for commercial uses that is titled to a qualified owner; that consists
of at least 50 contiguous acres where the production of trees on the property is being done for the purpose
of making a profit and is the primary activity taking place on the property; where a consistent effort has been
clearly demonstrated in land management in accordance with accepted commercial forestry practices; and
where such qualified owner submits a list of all parcels that contain such timberland property to the
commissioner and certifies that there is a reasonable attainable economic salability of the timber products
within a reasonable future time and the production of trees is being done for the purpose of making a profit
and is the primary activity taking place on the property.
‘Qualified Timberland Fair Market Value’ means the fair market value determined in accordance with Article
13 of Chapter 5 of Title 48, which requires the Commissioner to produce a manual that shall include a table of
regional values for timberland property based on soil productivity, while ensuring that no property’s appraisal
is less than 175 percent of such property’s Forest Land Conservation Use Value.
GENERAL CONSIDERATIONS:
Economic principles affecting approach. When applying the sales comparison approach, the appraisal staff
relied upon the economic principles of supply and demand, substitution, and contribution. The interaction of
supply and demand factors determine property prices; the principle of substitution states that a prudent
buyer will pay no more for a property than for a comparable property with similar utility; and the principle of
contribution means the value of a property component is measured by what value it adds to the whole.
21DATA COLLECTION:
Real estate transfer declaration forms. An initial discovery of sales was performed using real estate transfer
tax forms (PT-61) filed over the past three years with county clerks of superior court. Initially over 7,000
property sales were identified, using associated county tax digest data, as being classified as agricultural,
forestland, or conservation and containing a total tract size of 50 acres or more. The list of potentially
comparable sales was substantially reduced after reviewing board of assessors’ records and removing those
sales with open land or buildings or which otherwise appeared to be non-commercial.
The PT-61 and associated deed shown above represent a multi-parcel, multi-county sale of
commercial timberland.
22County Assessment Data. Department appraisal staff reviewed assessment records maintained by county
boards of assessors and cataloged the following information: map and parcel identifier; sale date; sale price;
buyer's name; seller's name; deed book and page number; vacant or improved; number of acres; and
representativeness of sale using the confirming criteria provided in sales ratio standards published by the
International Association of Assessing Officials.
Aerial Photography and Onsite Field Inspections. Department appraisal staff performed onsite field
inspections and a review of aerial photography of bona fide sale properties to ensure the data records were
accurate and complete.
The aerial shown above represents the McIntosh County portion of the sales transaction. A
registered forester provided an estimate of the standing timber value included in the sales
transaction.
23Geographic information. Computerized geographic information systems (GIS) were obtained from county tax
assessment offices and compiled by Department staff for all real property parcels statewide. GIS data included
the following information: streets and roads plotted and identified; boundary lines delineated for each parcel;
unique parcel identifying number; physical dimensions; and acreage estimate for each parcel. Digital soil map
data was obtained from the United States Department of Agriculture Natural Resource Soil Conservation
Service and utilized in conjunction with county parcel data in order to allocate soil types for each parcel.
Soil productivity ratings with acreage amounts are delineated above for the McIntosh County
parcel included in the $5 million sale.
24Surveys of Buyers and Sellers. The Department mailed questionnaires to buyers and sellers in order to
ascertain the conditions of each sale (i.e. related parties, value of standing timber in transaction, other
personal property or improvements included, etc.)
SALES QUALIFICATION:
Bona fide sales. Sales were analyzed by DOR appraisal staff to determine if the price paid was an accurate
indicator of the amount a knowledgeable buyer would pay, and a willing seller would accept, for commercial
timberland. Qualified sales included only bona fide arms-length transactions, where the commercial
production of timber represented both the existing use and highest and best use of such properties.
Sales Adjustments. The appraisal staff created a database of qualified commercial timberland sales and
applied adjustments to develop net sales prices to be used in the development of per acre bare land values.
Standing timber values to be excluded from sales prices were estimated through the following methods: (1)
direct contract between the Department and a registered forester; (2) timber estimate documentation
provided by county through contract with registered forester; (3) acquisition of sales qualification data from
registered forester; (4) timber estimate documentation provided by Georgia Department of Audits and
Accounts; (5) surveys of buyers and sellers; and (6) timber valuation data collected from appraisal vendor.
Multi-parcel/multi-jurisdictional qualified sales were adjusted using the sales allocation method by comparing
total sales price for all parcels sold to the total number of acres included in the sale.
25DEVELOPMENT OF TABLE OF VALUES:
Plotting Sales using GIS. After qualifying sales transactions, adjusting sales prices for standing timber value,
and collecting site-specific information, appraisal staff analyzed the trends and factors influencing value by
plotting sales using GIS data, reviewing site-specific information such as location, frontage, width, depth,
shape, size, topography, slope, drainage, hydrology, soil condition, soil productivity, quality of access, and the
proximity to timber processing facilities.
Determination of per acre values. Sales were analyzed to establish a representative benchmark price per acre
for each location and incremental per acre value adjustments associated with each of the nine soil productivity
levels. Missing values were extrapolated between soil productivity grades and compared to productivity
factors developed from timber production ratings used in the development of the Forest Land Conservation
Use Table of Values.
Sales Ratio Analysis. The appraisal staff conducted sales ratio studies to measure the accuracy of the table of
values relative to the market by using the tables to produce individual assessments on the same properties
included in the sales database. They thereby measured the level of value, uniformity, and bias produced by
the table of values, against the sales prices of bona fide commercial timberland occurring over the past three
years.
FINAL MARKET APPROACH TABLE OF PER ACRE VALUES:
Considering the information supplied by property owners and timber experts, the reliability of sales, and the
accuracy of adjustments made to such sales, the appraisal staff provides the following Market Approach Table
of Commercial Timberland Per Acre Values:
2020 Market Approach Table of Per Acre Values
SOIL PRODUCTIVITY RATING
1 2 3 4 5 6 7 8 9
E
1 1,300 1,157 1,040 975 910 878 813 780 715
C
O
R 2 1,000 890 800 750 700 650 600 550 540
E
G 3 1,150 1,024 920 863 805 776 748 719 661
I
O
4 1,425 1,268 1,140 1,069 998 962 926 891 819
N
26University of Georgia - Income Approach Methodology
The Department contracted with the University of Georgia Warnell School of Forestry and Natural Resources
for assistance in developing the income approach table of per acre values to be used in the appraisal of
Qualified Timberland Property. Since the new Georgia law required application of a regional table of per acre
values according to soil productivity, Department appraisers and UGA experts jointly agreed that the same
four major ecoregions, delineated by county, and the same nine soil productivity levels would be used in the
development of the respective tables. Each entity worked independently to arrive at a per acre table of values.
UGA developed discounted cash flow models for each ecoregion; surveyed commercial timberland
landowners to determine management practices, costs, and incidental incomes; established benchmark
values; and developed the following weighted average land expectation values of bare land by region for the
nine soil productivity levels:
2020 Income Approach Table of Per Acre Values
SOIL PRODUCTIVITY RATING
1 2 3 4 5 6 7 8 9
E 1 813 668 542 458 395 324 198 150 134
c
o
r 2 780 633 502 410 338 300 200 155 138
e
g
3 590 506 424 348 285 265 187 153 138
i
o
n 4 524 475 436 392 333 274 187 164 153
The University produced a 164-page report detailing the development of the above stated 2020 Income
Approach Table of Per Acre Values which may be provided upon request.
27Reconciliation of Market and Income Approaches
Objective: Determine ‘Fair Market Value of Qualified Timberland Property’ for ad valorem tax purpose.
Value is defined as the present worth of future benefits arising out of ownership to typical users and investors.
Market Value is defined as being the highest price estimated in terms of money which a property will bring if
exposed for sale in the open market, allowing a reasonable time to find a purchaser who buys with knowledge
of all uses to which the property is capable of being used.
Fair Market Value is defined in O.C.G.A. 48-5-2 as the amount a knowledgeable buyer would pay and a willing
seller would accept for the property at an arms-length, bona fide sale. The income approach, if data are
available, shall be considered in determining the fair market value of income-producing property, and, if actual
income and expense data are voluntarily supplied by the property owner, such data shall be considered in
such determination.
This definition requires analysis of arms-length transactions and implies that both buyer and
seller are informed of the uses to which the property may be put. Additionally, the income
approach is required to be considered, including actual property-specific income, thereby
factoring in an investment value component.
Investment Value means the specific value of a property to a particular investor or class of investors based on
individual investment requirements; distinguished from market value, which is impersonal and detached.
This definition points to application of the income approach based on the current use of a
property and may exclude considerations for highest and best use that are inherently included
in the sales comparison approach.
The appraisal process is designed to independently verify value through the three approaches (Cost, Market,
and Income). However, interrelationships exist between the approaches. For example, while the financial
community tends to rely on the income approach, the internal income approach components largely come
from data analyzed in the market and cost approaches.
The sales comparison approach estimates value by comparison with similar properties for which sales prices
are known. This approach is heavily relied on for tax purpose because of the ability to use comparable sales
to identify land attributes; build a mathematical model employing those attributes; and statistically measure
the result for uniformity, bias, and level of assessment. While commercial timberland owners may not be
largely concerned with some land attributes such as road frontage or permanent access, such investors do
include in their investment structure land sales as other highest and best use opportunities arise.
The income approach is based on the assumption that value equals the present worth of the rights to future
income. While commercial investors, who purchase properties that will be held for a long period of time
before resale, would want to know the current value per the market approach, such an investor may be more
interested in the income approach because the market approach value will change over the holding period.
One special issue in ad valorem tax appraisal is that land values and timber values are appraised and booked
separately. However, valuing land as if it were bare, when it will never really be bare, is a practice that does
28not reflect reality and may lead to inflated values if the appraiser fails to adequately adjust sales prices for
standing timber or may lead to very low values if the appraiser relies too heavily on investment value.
The final reconciliation and weighting of income approach and market approach value estimates must be
scrutinized for reliability and emphasis should be placed on the value estimate that appears to be most reliable
and compatible for the subject property and the definition of value sought:
1. The Department has identified sales of properties that would be qualified to enter the QTP program
and has employed timber industry experts and best information available to assist with the removal
of timber value from the sales prices. Buyers and sellers were interviewed; properties were physically
visited; topography and soil types were identified; the resulting data was compiled to determine per
acre timberland values by ecoregion and soil productivity; and those values were tested by sales ratio
standards. This market approach table of values will include all considerations of buyers and sellers
such as anticipated incidental incomes from hunting leases and potential future highest and best uses.
2. The University of Georgia has surveyed the forestry industry regarding management practices and
costs and incidental income from hunting leases and other sources; has applied the income approach
to value timberland according to sustained yield and land expectation value methodology; and has
produced a table of per acre timberland values by ecoregion and soil productivity. This income
approach table of values will include considerations of buyers and sellers as to the production of
timber in perpetuity.
Assuming that property qualified to enter the QTP program will be tracts of land where growing timber is the
highest and best use of such property for the current year and several years in the future, the Department
has weighted the market approach at 50% and the income approach at 50%. The Department thereby gives
equal weight to the ‘meeting of the minds’ in the buyer/seller transactions and the unique income patterns
and investment structure of commercial timberland – both factors being required by the O.C.G.A. 48-5-2
definition of ‘fair market value’.
Table of Values weighted at market 50% and income 50%
SOIL PRODUCTIVITY RATING
1 2 3 4 5 6 7 8 9
1,300 1,157 1,040 975 910 878 813 780 715 Market
1 813 668 542 458 395 324 198 150 134 Income
E 1,057 913 791 717 653 601 506 465 425 wgt avg
C 1,000 890 800 750 700 650 600 550 540 Market
O 2 780 633 502 410 338 300 200 155 138 Income
R
890 762 651 580 519 475 400 353 339 wgt avg
E
G 1,150 1,024 920 863 805 776 748 719 661 Market
I 3 590 506 424 348 285 265 187 153 138 Income
O 870 765 672 606 545 521 468 436 400 wgt avg
N 1,425 1,268 1,140 1,069 998 962 926 891 819 Market
4 524 475 436 392 333 274 187 164 153 Income
975 872 788 731 666 618 557 528 486 wgt avg
29You can also read