QUARTERLY PROPERTY MARKET & ECONOMIC UPDATE - NEW ZEALAND QUARTER 4, 2020 - CORELOGIC
←
→
Page content transcription
If your browser does not render page correctly, please read the page content below

Quarterly Property Market
& Economic Update
New Zealand
Quarter 4, 2020

Table of Contents
    About CoreLogic.  .  .  .  .  .  .  .  .  .  .  .  .  .  .  .  .  .  .  .  .  .  .  .  .  .  .  .  .  .  .  .  .  .  .  .  .  .  .  .  .  .  .  .  .  .  .  .  .  .  .  .  .  .  .  .  .  .  .  .  .  .  .  .  .  .  .  .  .  . 3
    Executive Summary.  .  .  .  .  .  .  .  .  .  .  .  .  .  .  .  .  .  .  .  .  .  .  .  .  .  .  .  .  .  .  .  .  .  .  .  .  .  .  .  .  .  .  .  .  .  .  .  .  .  .  .  .  .  .  .  .  .  .  .  .  .  .  .  .  .  . 4
    Macro Economic and Demographic Indicators.  .  .  .  .  .  .  .  .  .  .  .  .  .  .  .  .  .  .  .  .  .  .  .  .  .  .  .  .  .  .  .  .  .  .  .  .  .  .  .  .  .  .  . 5
             New Zealand Asset Classes .  .  .  .  .  .  .  .  .  .  .  .  .  .  .  .  .  .  .  .  .  .  .  .  .  .  .  .  .  .  .  .  .  .  .  .  .  .  .  .  .  .  .  .  .  .  .  .  .  .  .  .  .  .  .  .  .  .  .  .  . 6
             New Zealand and Australia GDP Growth. .  .  .  .  .  .  .  .  .  .  .  .  .  .  .  .  .  .  .  .  .  .  .  .  .  .  .  .  .  .  .  .  .  .  .  .  .  .  .  .  .  .  .  .  .  .  .  .  . 7
             New Zealand Population.  .  .  .  .  .  .  .  .  .  .  .  .  .  .  .  .  .  .  .  .  .  .  .  .  .  .  .  .  .  .  .  .  .  .  .  .  .  .  .  .  .  .  .  .  .  .  .  .  .  .  .  .  .  .  .  .  .  .  .  .  .  .  . 8
             Migration .  .  .  .  .  .  .  .  .  .  .  .  .  .  .  .  .  .  .  .  .  .  .  .  .  .  .  .  .  .  .  .  .  .  .  .  .  .  .  .  .  .  .  .  .  .  .  .  .  .  .  .  .  .  .  .  .  .  .  .  .  .  .  .  .  .  .  .  .  .  .  .  .  .  .  .  . 9
             Regional Building Consents .  .  .  .  .  .  .  .  .  .  .  .  .  .  .  .  .  .  .  .  .  .  .  .  .  .  .  .  .  .  .  .  .  .  .  .  .  .  .  .  .  .  .  .  .  .  .  .  .  .  .  .  .  .  .  .  .  .  .  . 10
             Consumer Confidence.  .  .  .  .  .  .  .  .  .  .  .  .  .  .  .  .  .  .  .  .  .  .  .  .  .  .  .  .  .  .  .  .  .  .  .  .  .  .  .  .  .  .  .  .  .  .  .  .  .  .  .  .  .  .  .  .  .  .  .  .  .  .  .  . 10
             Employment .  .  .  .  .  .  .  .  .  .  .  .  .  .  .  .  .  .  .  .  .  .  .  .  .  .  .  .  .  .  .  .  .  .  .  .  .  .  .  .  .  .  .  .  .  .  .  .  .  .  .  .  .  .  .  .  .  .  .  .  .  .  .  .  .  .  .  .  .  .  .  .  . 11
            Interest Rates .  .  .  .  .  .  .  .  .  .  .  .  .  .  .  .  .  .  .  .  .  .  .  .  .  .  .  .  .  .  .  .  .  .  .  .  .  .  .  .  .  .  .  .  .  .  .  .  .  .  .  .  .  .  .  .  .  .  .  .  .  .  .  .  .  .  .  .  .  .  .  . 12
    Housing Overview .  .  .  .  .  .  .  .  .  .  .  .  .  .  .  .  .  .  .  .  .  .  .  .  .  .  .  .  .  .  .  .  .  .  .  .  .  .  .  .  .  .  .  .  .  .  .  .  .  .  .  .  .  .  .  .  .  .  .  .  .  .  .  .  .  .  . 14
            Early Property Market Indicators .  .  .  .  .  .  .  .  .  .  .  .  .  .  .  .  .  .  .  .  .  .  .  .  .  .  .  .  .  .  .  .  .  .  .  .  .  .  .  .  .  .  .  .  .  .  .  .  .  .  .  .  .  .  . 15
            Listings.  .  .  .  .  .  .  .  .  .  .  .  .  .  .  .  .  .  .  .  .  .  .  .  .  .  .  .  .  .  .  .  .  .  .  .  .  .  .  .  .  .  .  .  .  .  .  .  .  .  .  .  .  .  .  .  .  .  .  .  .  .  .  .  .  .  .  .  .  .  .  .  .  .  .  .  .  . 15
            Lending Conditions .  .  .  .  .  .  .  .  .  .  .  .  .  .  .  .  .  .  .  .  .  .  .  .  .  .  .  .  .  .  .  .  .  .  .  .  .  .  .  .  .  .  .  .  .  .  .  .  .  .  .  .  .  .  .  .  .  .  .  .  .  .  .  .  .  .  . 16
            Sales Volumes.  .  .  .  .  .  .  .  .  .  .  .  .  .  .  .  .  .  .  .  .  .  .  .  .  .  .  .  .  .  .  .  .  .  .  .  .  .  .  .  .  .  .  .  .  .  .  .  .  .  .  .  .  .  .  .  .  .  .  .  .  .  .  .  .  .  .  .  .  .  .  . 18
             Values.  .  .  .  .  .  .  .  .  .  .  .  .  .  .  .  .  .  .  .  .  .  .  .  .  .  .  .  .  .  .  .  .  .  .  .  .  .  .  .  .  .  .  .  .  .  .  .  .  .  .  .  .  .  .  .  .  .  .  .  .  .  .  .  .  .  .  .  .  .  .  .  .  .  .  .  .  .  . 19
             Rent.  .  .  .  .  .  .  .  .  .  .  .  .  .  .  .  .  .  .  .  .  .  .  .  .  .  .  .  .  .  .  .  .  .  .  .  .  .  .  .  .  .  .  .  .  .  .  .  .  .  .  .  .  .  .  .  .  .  .  .  .  .  .  .  .  .  .  .  .  .  .  .  .  .  .  .  .  .  .  .  . 20
            House Price Index .  .  .  .  .  .  .  .  .  .  .  .  .  .  .  .  .  .  .  .  .  .  .  .  .  .  .  .  .  .  .  .  .  .  .  .  .  .  .  .  .  .  .  .  .  .  .  .  .  .  .  .  .  .  .  .  .  .  .  .  .  .  .  .  .  .  .  . 23
            Buyer Classification .  .  .  .  .  .  .  .  .  .  .  .  .  .  .  .  .  .  .  .  .  .  .  .  .  .  .  .  .  .  .  .  .  .  .  .  .  .  .  .  .  .  .  .  .  .  .  .  .  .  .  .  .  .  .  .  .  .  .  .  .  .  .  .  .  .  . 24
    Main Cities Housing Market Indicators. .  .  .  .  .  .  .  .  .  .  .  .  .  .  .  .  .  .  .  .  .  .  .  .  .  .  .  .  .  .  .  .  .  .  .  .  .  .  .  .  .  .  .  .  .  .  .  .  . 25
             Auckland Market Activity. .  .  .  .  .  .  .  .  .  .  .  .  .  .  .  .  .  .  .  .  .  .  .  .  .  .  .  .  .  .  .  .  .  .  .  .  .  .  .  .  .  .  .  .  .  .  .  .  .  .  .  .  .  .  .  .  .  .  .  .  .  . 26
             Auckland Values .  .  .  .  .  .  .  .  .  .  .  .  .  .  .  .  .  .  .  .  .  .  .  .  .  .  .  .  .  .  .  .  .  .  .  .  .  .  .  .  .  .  .  .  .  .  .  .  .  .  .  .  .  .  .  .  .  .  .  .  .  .  .  .  .  .  .  .  .  . 27
            Current Auckland Suburb Values .  .  .  .  .  .  .  .  .  .  .  .  .  .  .  .  .  .  .  .  .  .  .  .  .  .  .  .  .  .  .  .  .  .  .  .  .  .  .  .  .  .  .  .  .  .  .  .  .  .  .  .  .  .  . 28
             Hamilton Market Activity. .  .  .  .  .  .  .  .  .  .  .  .  .  .  .  .  .  .  .  .  .  .  .  .  .  .  .  .  .  .  .  .  .  .  .  .  .  .  .  .  .  .  .  .  .  .  .  .  .  .  .  .  .  .  .  .  .  .  .  .  .  . 30
             Hamilton Values .  .  .  .  .  .  .  .  .  .  .  .  .  .  .  .  .  .  .  .  .  .  .  .  .  .  .  .  .  .  .  .  .  .  .  .  .  .  .  .  .  .  .  .  .  .  .  .  .  .  .  .  .  .  .  .  .  .  .  .  .  .  .  .  .  .  .  .  .  . 31
             Tauranga Market Activity. . . . . . . . . . . . . . . . . . . . . . . . . . . . . . . . . . . . . . . . . . . . . . . . . . . . . . . . . . . . . . 32
            Tauranga Values .  .  .  .  .  .  .  .  .  .  .  .  .  .  .  .  .  .  .  .  .  .  .  .  .  .  .  .  .  .  .  .  .  .  .  .  .  .  .  .  .  .  .  .  .  .  .  .  .  .  .  .  .  .  .  .  .  .  .  .  .  .  .  .  .  .  .  .  .  . 33
            Wellington Market Activity .  .  .  .  .  .  .  .  .  .  .  .  .  .  .  .  .  .  .  .  .  .  .  .  .  .  .  .  .  .  .  .  .  .  .  .  .  .  .  .  .  .  .  .  .  .  .  .  .  .  .  .  .  .  .  .  .  .  .  .  . 34
             Wellington Values.  .  .  .  .  .  .  .  .  .  .  .  .  .  .  .  .  .  .  .  .  .  .  .  .  .  .  .  .  .  .  .  .  .  .  .  .  .  .  .  .  .  .  .  .  .  .  .  .  .  .  .  .  .  .  .  .  .  .  .  .  .  .  .  .  .  .  .  . 35
            Christchurch Market Activity.  .  .  .  .  .  .  .  .  .  .  .  .  .  .  .  .  .  .  .  .  .  .  .  .  .  .  .  .  .  .  .  .  .  .  .  .  .  .  .  .  .  .  .  .  .  .  .  .  .  .  .  .  .  .  .  .  .  . 36
             Christchurch Values.  .  .  .  .  .  .  .  .  .  .  .  .  .  .  .  .  .  .  .  .  .  .  .  .  .  .  .  .  .  .  .  .  .  .  .  .  .  .  .  .  .  .  .  .  .  .  .  .  .  .  .  .  .  .  .  .  .  .  .  .  .  .  .  .  .  . 37
            Dunedin Market Activity.  .  .  .  .  .  .  .  .  .  .  .  .  .  .  .  .  .  .  .  .  .  .  .  .  .  .  .  .  .  .  .  .  .  .  .  .  .  .  .  .  .  .  .  .  .  .  .  .  .  .  .  .  .  .  .  .  .  .  .  .  .  . 38
             Dunedin Values. .  .  .  .  .  .  .  .  .  .  .  .  .  .  .  .  .  .  .  .  .  .  .  .  .  .  .  .  .  .  .  .  .  .  .  .  .  .  .  .  .  .  .  .  .  .  .  .  .  .  .  .  .  .  .  .  .  .  .  .  .  .  .  .  .  .  .  .  .  . 39
    CoreLogic Data and Analytics .  .  .  .  .  .  .  .  .  .  .  .  .  .  .  .  .  .  .  .  .  .  .  .  .  .  .  .  .  .  .  .  .  .  .  .  .  .  .  .  .  .  .  .  .  .  .  .  .  .  .  .  .  .  .  .  . 40
             Legal Disclaimer .  .  .  .  .  .  .  .  .  .  .  .  .  .  .  .  .  .  .  .  .  .  .  .  .  .  .  .  .  .  .  .  .  .  .  .  .  .  .  .  .  .  .  .  .  .  .  .  .  .  .  .  .  .  .  .  .  .  .  .  .  .  .  .  .  .  .  .  .  . 41
2
About CoreLogic

CoreLogic is a leading property information, analytics and               Contact
services provider in the United States, Australia and New Zealand.
                                                                         Call us 0800 355 355
CoreLogic helps clients identify and manage growth opportunities,
improve performance and mitigate risk, by providing clients with         Wellington office
innovative, technology-based services and access to rich data            Level 2, 275 Cuba Street
and analytics.                                                           PO Box 4072
                                                                         Wellington 6140
Whilst all reasonable effort is made to ensure the information in this
publication is current, CoreLogic does not warrant the accuracy,         Auckland office
currency or completeness of the data and commentary contained in         Level 5
this publication and to the full extent not prohibited by law excludes   41 Shortland Street
all loss or damage arising in connection with the data and               Auckland 1010
commentary contained in this publication.                                Email: reports@corelogic.co.nz

                                                                         corelogic.co.nz                  3
Executive Summary
    The upturn for the property market that started in Q3         Classification series shows that the key buyer groups
    last year gathered considerable momentum in Q4,               of interest are still first home buyers (23% of
    with buyer demand (especially from investors),                purchases in Q4) and mortgaged investors, who
    mortgage lending activity, property sales volumes,            surged up to a 27% market share in the final three
    and property values all showing strength in the final         months of 2020. Given that FHBs don’t have anything
    three months of 2020. However, the (un-)affordability         to list/sell before they buy and that very few investors
    problem has come to the fore again, and both the              are selling much at present either, their continued
    Government and Reserve Bank have the property                 buying presence will keep the pressure on the supply/
    market firmly in their sights.                                demand balance in the market.

    A key support for the recent strength in the property         Looking at movers, their share of purchases dipped to
    market has been the decent performance of the                 just 26% in Q4, an historically low level. In some cases,
    economy, especially with unemployment not rising as           existing owner-occupiers are choosing to stay where
    far as had been anticipated. Indeed, from its current         they are due to already high debt levels and the extra
    level of 5.3% (up from the recent low of 4.0%), the           costs of moving house (such as legal, estate agent etc).
    unemployment rate may only rise by another 1% or              But in other cases, people aren’t moving because they
    so. Meanwhile, timely indicators such as the NZ               simply can’t find the ideal next property, given the
    Activity Index show that the wider economy continues          tight supply of available listings. In turn, that is feeding
    to recover, and sectors such as construction are still        back into an even tighter listings picture.
    growing steadily (despite previous fears of a collapse).
                                                                  With the property politics having heated up and
    In the property market itself, mortgage credit has            affordability pressures re-emerging, it looks likely that
    continued to flow in the past few months. Indeed,             regulation will be a key feature of the market in 2021.
    after the slump in activity in April and May, new             We’ve already seen the Reserve Bank move to
    lending flows quickly recovered. Indeed, the rise in          reinstate the LVR speed limits from 1st March, and
    activity over the second half of 2020 was so strong           there is surely a growing chance that a 40% deposit
    that it far outweighed the lockdown-related hiatus,           requirement for investors could be officially mandated
    and left the value of mortgage lending by the banks           later in the year (ANZ has already done so). Indeed,
    up by almost 10% for the calendar year.                       the last time that mortgaged investors had a market
                                                                  share as high as they do now – which was back in Q3
    Consistent with that, property sales volumes also             2016 – was also when the RBNZ previously imposed a
    picked up strongly in the final few months of 2020 and        40% deposit requirement. Meanwhile, an extension to
    in fact could have been even higher still were it not for     the current five-year hold period for the Brightline
    the lack of listings on the market – you can’t buy            Test could be on the cards too, while the Reserve
    what’s not for sale. Combined with low mortgage               Bank has also requested the ability to use debt to
    rates, that lack of choice for buyers has been a key          income ratio caps if and when they deem it necessary.
    contributor to the sharp growth in property values
    lately.                                                       So overall, there are many moving parts and a COVID
                                                                  relapse could of course change everything. But for
    Indeed, the CoreLogic House Price index showed that           now, it would seem that property sales volumes will
    average property values across NZ as whole rose by            be solid again in 2021, and that property values will
    6.1% in Q4 – a figure not seen since 6.6% in the three        continue to rise. However, after an 11% gain in values
    months to February 2004. Tauranga (10.2%),                    in 2020, growth in 2021 could be a little slower, as
    Wellington (8.1%), and Dunedin (6.4%) were all above          those potential regulatory changes in the property
    that national average, with smaller areas such as             market start to take effect.
    Masterton and Whanganui also recording strong
    growth. Hamilton (4.1%) and Christchurch (3.4%) were          As always, we keep a running monitor on the property
    slightly more subdued in Q4, but those growth figures         market every week via our NZ Property Market Pulse
    were still fairly solid, especially for Christchurch (which   articles, so be sure to check these out on our website
    has seen little change at all in property values for a        http://www.corelogic.co.nz/news-research/
    number of years now).                                         all-news/. Our podcast is also a great source of data
                                                                  and commentary: https://
    What’s more, it may be that listings remain fairly low        corelogicnzpropertymarket.buzzsprout.com/.
4   for a while yet. After all, the CoreLogic Buyer                                                                       4
Macro Economic and
Demographic Indicators

                         5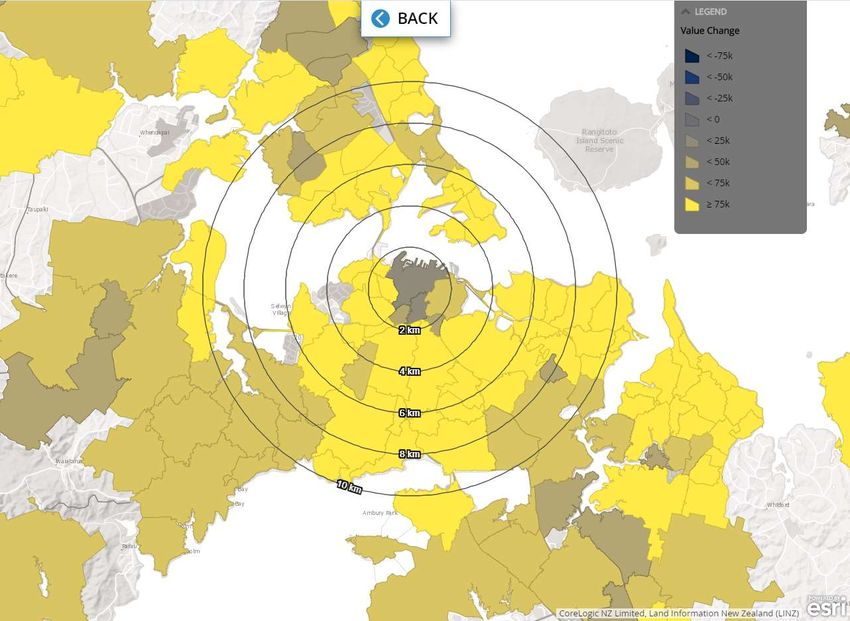
New Zealand Asset Classes

                          RESIDENTIAL REAL ESTATE

                          $1.35 trillion
                          $298 billion in home loans

                          COMMERCIAL/INDUSTRIAL REAL ESTATE

                          $229 billion
                          NZ LISTED STOCKS

                          $197 billion
                          NZ SUPER & KIWISAVER

                          $126 billion

    The value of residential property across the country as at Q4 2020 was $1.35T. Mortgages are secured against
    22% of this value, or in other words, 78% of the value of the property market is household equity. However,
    it’s also important to note that household debt is high relative to income, and to some extent the debt has
    only been sustainable in recent years because of low mortgage rates.

    Ever since lockdown the NZX has been on a reasonably steady upwards trend, and indeed after reaching a
    trough of less than 8,500 in late March, it has since rebounded to sit at around 13,400 in early January (a rise
    of more than 55%). The rise in the sharemarket has been replicated for pooled investment funds, with the
    values of KiwiSaver pots and the NZ Super Fund also continuing to improve.

6   Sources: CoreLogic NZ, Reserve Bank of NZ, NZX, NZ Super Fund                                                 6
New Zealand and Australia GDP growth
After dropping by 11% during                Annual Average GDP Growth (%)
April-June (obviously with a
large COVID effect from                     8
lockdown and subsequent
social restrictions), NZ’s GDP              7

surged back by 14% over                     6
July-September. The net
result is that the economy is               5
estimated to actually be a bit
                                            4
bigger now than it was a year
ago, even though we haven’t                 3
had any international tourists
                                            2
for the past 6-9 months.
Clearly, this is an impressive              1
result, although it does reflect
the influence of social                     0
support packages such as the
                                           -1
wage subsidy, which have
now ended.                                 -2

Even so, the timelier                      -3
indications from the NZ                      1990            1994      1998      2002     2006   2010          2014   2018

Activity Index show that
activity continued to expand                          Australia         NZ
in October and November, so
that bodes well for the official
Q4 GDP release (18th March).                Annual Change in New Zealand Activity Index and GDP (%)
Over the coming months and
quarters, economic data has                 10%
the potential to remain a little
‘jumpy’, although the overall                   5%
prospects for GDP growth
look brighter this year,
especially if the COVID                         0%

vaccine can be rolled out
successfully and we can                         -5%
regain some of the lost
international tourism.
                                           -10%

                                           -15%

                                           -20%

                                           -25%
                                               2004                    2008             2012            2016             2020

                                                      GDP           NZ Activity Index

Source: Reserve Bank of New Zealand, Stats NZ                                                                                   7
New Zealand Population and Migration
    Quarterly Change in National                                             Population Change Composition
    Population (persons per quarter)                                         (persons per quarter)
                                                                             40000
    50000

                                                                             35000
    45000

                                                                             30000
    40000

                                                                             25000
    35000

    30000                                                                    20000

    25000                                                                    15000

    20000                                                                    10000

    15000                                                                     5000

    10000                                                                        0

     5000                                                                     -5000

       0                                                                     -10000
            1992   1996   2000     2004   2008   2012   2016   2020                   1996   2000    2004   2008   2012   2016   2020

              4 quarter moving average                                                 Natural increase
              Quarterly population change                                              Net migration

     Annual Change in Population (persons)
              105000

                                 37000

                                                 4200                 5100                                  7000
                                                                                             3100                         1800

    There’s been a dramatic slowdown in the rate of population growth in the past two quarters, from an annual
    pace of 2.4% in Q1 to 1.9% in Q3. Natural growth (i.e. births minus deaths) has of course been pretty steady,
    so the overall slowdown reflects the migration component – which is no surprise, given the closed border.
    Indeed, after averaging about 18,500 per quarter throughout 2019, the net migration figure was just 900
    people in Q2 2020 and 1,600 in Q3. These are the weakest migration figures for 6-7 years.

    Both arrivals and departures of migrants have fallen in recent months, with the (low) arrivals mostly made up
    of returning NZ citizens, and the departures mostly being non-citizens. Although the so-called ‘flood’ of
    returning kiwis post-COVID has probably been exaggerated a bit, it’s still true that the net balance for kiwi
    migration is much stronger than it was in the 2000s and early 2010s, when the so-called brain drain was in full
    swing. Indeed, in 2011-12, we lost more than 40,000 NZ citizens in net terms, whereas over the past 12
    months we’ve gained more than 20,000.

8   Source: Statistics New Zealand
Long term migration (12-month rolling totals)
250,000 Net
Arrivals
Departures
200,000
150,000
100,000
50,000
0
-50,000
2002 2006 2010 2014 2018
Migration flows for NZ citizens (12-month rolling totals)
80,000 Departures
Arrivals
Net
60,000
40,000
20,000
0
-20,000
-40,000
-60,000
2002 2006 2010 2014 2018
Source: Statistics New Zealand 9Building Consents
New dwelling consents trend (consents per month)
1,800 Auckland region
Waikato region
1,600
Wellington region
Canterbury region
1,400
Rest of NI
Rest of SI
1,200
1,000
800
600
400
200
0
1995 1999 2003 2007 2011 2015 2019
Residential construction activity continues to hold up better than many would have thought, with the
shortage of available property on the market probably pushing some buyers towards a self-build or off-the-
plans purchase. Indeed, the number of new dwelling consents was more than 38,000 in the 12 months to
November 2020, higher than the pre-COVID peak back in February, and again the strongest levels since the
mid-1970s.
Much of the strength in nationwide construction activity reflects the growing role for smaller dwellings such
as townhouses, while regionally the key market remains Auckland. This all seems pretty logical, as we face the
need to accommodate an ever-growing population in a more intensified dwelling stock. Of course, at the same
time, consents issued for alterations to existing properties are also running at high levels, with more people
choosing to renovate rather than relocate. This is also a useful trend in terms of improving the quality of
housing.
However, although dwelling consents are running at high levels in their own right, they’re not quite as
impressive when you look relative to our population. Indeed, we’ve recently been consenting about 7.5 new
dwellings per year for every 1,000 people in the country, which is the highest for about 15 years, but still well
below the figures of 13 in 1973 and 12 in 1974. In other words, we need to keep dwelling consents going at
current levels for a number of years yet, or perhaps even raise them further.
Unfortunately though there are already signs emerging of cost pressures in the construction industry,
reflecting rising land prices and also labour shortages. This could restrain our ability to keep dwelling
consents high over a series of years. In addition, restrictions on development finance are always a lingering
risk.
Overall, the high number of dwellings already consented suggests that builders will be busy well into 2021.
The hope thereafter is that consents will stay high and help to alleviate the supply pressures that we face, and
in turn help to improve housing affordability. Encouragingly, the Government has indicated that they will
continue with a strong state house construction programme.
10 Source: Statistics New ZealandConsumer Confidence
ANZ-Roy Morgan Consumer Confidence (index, monthly)
160
140
120
Average
100
80
60
40
20
0
2004 2006 2008 2010 2012 2014 2016 2018 2020
The recent trend for the ANZ Roy Morgan consumer confidence measure has been positive, with the index rising from
100 in September to 112 in December – the highest reading since February. December’s figure was still below the long
term average of around 119, but even so the recent rises have still been encouraging.
In other words, confidence amongst households has rebounded from the worst point of alert level four lockdown, and
although there were fears that the end of the wage subsidy may reverse the stronger trend, confidence has proved to
be pretty resilient in the past few months. No doubt low mortgage rates and steadily rising house prices are playing a
role in supporting consumer confidence, while the smaller-than-expected rise in unemployment (so far) is also likely to
have been a factor.
Meanwhile, a similar message applies for business confidence – it has been rising in recent months and suggests that
the economy should start off fairly well in 2021.
Sources: ANZ, Roy Morgan 11Employment
Annual change in employment, Labour force
full time and part time participation rate (%)
10% 72
8%
70
6%
68
4%
66
2%
0% 64
-2%
62
-4%
Full time 60
-6%
Part time
-8% 58
1987 1998 2009 2020 1987 1999 2011
Number of Jobseeker
Unemployment rate (%) Support claimants
12
240,000
10
220,000
8
200,000
6 180,000
160,000
4
140,000
2
120,000
0 100,000
1986 1998 2010 Jan-20 Mar-20 May-20 Jul-20 Sep-20 Nov-20
The latest labour market figures were clearly weaker than the recent past, with overall employment growth
slowing to 0.4% year on year in Q3, the lowest since 0.2% in Q1 2013. Part-time employment growth
accelerated to 3.4% in Q3, but this probably isn’t as encouraging as it looks – given that it may reflect a shift of
workers from full-time jobs into a reduced hours situation. Indeed, the full-time employment figure actually
dropped by 0.3% in Q3 2020, the first fall since 2012.
Meanwhile, after a drop in Q2 from 70.7% to 69.9%, the labour force participation rate (people employed or
looking for work as a percentage of the working age population) rose back slightly in Q3 to 70.1%. This
explains part of the sharp rise in the unemployment rate in Q3, from 4.0% to 5.3%, but the most significant
factor there was simply people losing their jobs – especially in tourism related sectors of the economy.
Looking ahead, the unemployment rate is unfortunately expected to rise further in the coming months.
However, the end of the wage subsidy doesn’t appear to have triggered the sharp job cuts that some were
fearing, and unemployment rate projections are being slowly improved. Indeed, whereas a few months ago
the Reserve Bank was predicting a peak unemployment rate of more than 9%, that forecast has now been
reduced to around 6.5%.
All else equal, higher unemployment will tend to be a restraint for the housing market, although to the extent
that it’s younger/lower-paid workers who feel more of the brunt, it may be the tenant/rental sector that gets
more affected than owner-occupation.
12 Source: Stats NZ, Ministry of Social DevelopmentInterest Rates
The outlook for interest rates looks a little more mixed Mortgage Interest Rates (%)
than it done for a while now. On one hand, the Reserve 25
Bank’s (RBNZ) asset purchase programme is still in action, 2 year fixed rate
and their cap remains at $100bn of purchases out to June Floating mortgage interest rates
20
2022. Meanwhile, the Funding for Lending Programme is
also underway, which means banks can access cheap loans
directly from the RBNZ, which in turn allows them to 15
continue lending to business and households at low
interest rates. In short, these measures point to further
10
low rates for borrowers.
On the other hand, however, the bounce-back in the 5
economy in Q3 (and the continued strength of other
economic indicators for October through to December) as
0
well as the resilience of the property market suggest that 1965 1971 1977 1983 1989 1995 2001 2007 2013 2019
the chances of a negative official cash rate have receded –
which in turn would indicate that mortgage rates might
have already reached a floor. Official Cash Rate and Mortgage Rates (%)
12
Overall, a typical new mortgage (with a 20% deposit) on a OCR history
OCR projection
one year fixed term currently carries a rate of around 2.5%,
10 2-yr fixed mortgage
and while further falls in interest rates couldn’t be ruled
out (especially if the banks enter a new ‘rate war’), previous
8
expectations that they could fall below 2% are now looking
less likely. Of course, significant rises in interest rates aren’t
6
especially likely for the next year or two either.
4
2
0
2000 2009 2018
Average Two Year Fixed Mortgage Rates (%)
5 .2%
4 .7%
4 .2%
3 .7%
3 .2%
2018 2019 2020
Source: Reserve Bank of NZ, interest.co.nz 13Housing Overview 14
Early Property Market Indicators
During alert level four lockdown, measures relating to the early stages of a sale process – i.e. pre-listing (such as appraisals
generated by real estate agents) and pre-mortgage (valuations ordered by banks) – fell away sharply, which was no surprise.
However, as our Early Market Indicators Report shows, they then bounced back steadily, and have recently been running at
around normal levels: https://www.corelogic.co.nz/early-market-indicators

In other words, the early stages of both the supply (appraisals, which lead to listings) and demand (borrowers requesting a
mortgage, hence the bank ordering a valuation) pipelines are holding up well, which points to further resilience for property
sales volumes in the coming months. If anything, demand has been running ahead of supply, which suggests continued
upwards pressure on property values too.

Listings
Weekly flow of new for-sale listings                                Weekly flow of new for-rent listings
3,500
                                                  2020              4,000
                                                                                                                         2020
                                                  2019              3,500
                                                                                                                         2019
3,000

                                                                    3,000
2,500

                                                                    2,500
2,000

                                                                    2,000
1,500
                                                                    1,500

1,000
                                                                    1,000

 500
                                                                     500

   0                                                                   0
   Jan-20    Feb-20   Apr-20   Jun-20   Aug-20    Oct-20   Dec-20      Jan-20   Feb-20    Apr-20   Jun-20    Aug-20   Oct-20    Dec-20

A key and ongoing feature of the NZ property market in recent times has been the low supply of listings available on the
market, which has been bolstering property values as buyers continue to face limited choice. There has been no material
change in the tight listings situation in the past three months either, with the total stock of existing properties available for
sale running at multi-year lows.

In turn, that has reflected both a continued stream of achieved sales (which removes listings at the end of pipeline) but also
only a ‘normal’ flow of new listings coming onto the market at the start of the pipeline. Indeed, after the listings lull of April/
May, it was possible that we’d subsequently see new listings running above previous levels – but this hasn’t happened.

In some ways, there is a vicious circle going on for listings, with some existing owner-occupiers not moving house because
they don’t have much choice about their next property. And of course, those owners are then not listing their own house,
which feeds back into even tighter supply conditions. Similarly, other active buyer groups at present – namely first home
buyers (FHBs) and mortgaged investors – aren’t generally selling any property before they purchase either (certainly FHBs
are not selling anything, by definition).

A similar message applies for new rental listings. In recent weeks, they’ve only been running at ‘normal’ levels, despite the
lack of activity in April/May.

Source: CoreLogic                                                                                                                15
Lending conditions
Annual Change in Gross New Lending Flows ($m per month)
3,000
2,000
1,000
0
-1,000
-2,000
-3,000
2016 2017 2018 2019 2020
Investor Owner-occupier
In the past three months, mortgage lending activity has continued to surge higher and the new flows hit
$9.3bn in November, having topped $7bn in each of September and October. In each case, this equated to an
annual increase of at least $1.7bn. Indeed, after April’s lockdown disrupted the market, the bounce-back has
been so strong that total lending flows for 2020 so far have returned to being much higher than for 2019.
First home buyers have been active borrowers this year, but perhaps the most important driver has been
demand from mortgaged investors. The reduction in term deposit rates has diverted some of their money
into the property market, while of course low mortgage rates have been a factor as well. But on top of that,
the temporary removal of the loan to value ratio rules (LVRs) has been another important driver – many
investors who may previously have struggled to raise the 30% deposit have been able to purchase property
with a 20% deposit instead.
That said, this doesn’t mean that general credit standards have dropped. In fact, banks are still scrutinising a
borrower’s income and expenses very closely, and also applying their serviceability tests at (hypothetical)
interest rates of more than 6%. Generally speaking, all borrowers are still requiring at least a 20% deposit too.
However, the surge in activity amongst higher LVR investors has prompted the age-old debate about what’s
‘good’ for the property market, and the RBNZ of course is consulting on the reinstatement of the previous LVR
regime – i.e. 20% deposit for owner occupiers with a 20% allowance outside the threshold (speed limit), and a
30% deposit requirement for investors with a 5% speed limit. This looks likely to become the official
requirement again from 1st March, while of course the ANZ bank has gone even further, requiring investors to
put in 40%.
16 Sources: Reserve Bank of New ZealandWith all this in mind, then, it’s High LVR Lending to Owners and Investors (% of new lending)
likely that securing a mortgage
may be a little tougher this year 25%
than it was for most of the
second half of 2020. In turn,
this could take a little heat out 20%
of sales activity and property
prices as we move through the
next few months – especially if
15%
the Government also gives the
RBNZ the ability to impose debt
to income ratios (DTIs) on
lending at some stage. 10%
Finally, it needs to be noted that
the mortgage payment deferral 5%
scheme will end on 31st March.
However, about 90% of these
deferrals have already ended
0%
without too much trouble, so it
2014 2015 2016 2017 2018 2019 2020
seems unlikely that the passing
of the late March deadline will
have too much impact on the
general lending environment or Refinancing Profile for Mortgages (% of stock)
the wider property market.
50%
44.57%
45%
40%
35%
30%
25%
20% 18.09% 17.71%
15%
10.48%
10%
5.62%
5% 3.52%
0%
Floating Fixed < 1 year Fixed > 1 year
Investor Owner-occupier
Sources: Reserve Bank of New Zealand 17Sales Volumes
The first few months of strengthening property Nationwide Sales Volumes
sales activity post-lockdown could be mostly (monthly total)
explained by ‘catch up’ demand after the pause
during April/May, but that’s no longer the case – we 14,000
now have genuine new and extra demand in the 13,000
12,000
market. Indeed, the monthly sales total (across 11,000
private and agent sales) for October topped 10,000, 10,000
9,000
then climbed even higher to 11,112 in November, and
8,000
stayed above 10,000 in December too. 7,000
6,000
The rebound in activity has been seen in almost all 5,000
4,000
parts of the country – and it’s worth noting that 3,000
sales activity may have been even higher still, were it 2,000
not for the low supply of property listed and actually 1,000
available to buy. Indeed, areas that perhaps haven’t 1996 1999 2002 2005 2008 2011 2014 2017 2020
seen such a strong rebound in sales are more likely
to have restrained by lack of supply rather than
sluggish demand. Nationwide Annual Change
The rise in demand has reflected continued interest in Sales Volumes (%)
from first home buyers, who in many cases are
tapping their KiwiSaver funds for the deposit (or at 40%
least part of it), but also mortgaged investors – in
20%
particular, those who were previously struggling to
find the 30% deposit, but thanks to the temporary 0%
removal of the LVR speed limits have recently been -20%
able to purchase with 20%.
-40%
Looking ahead, the environment is favourable for
-60%
more solid levels of property market activity in the
coming months, especially given continued low -80%
mortgage rates and the fact that unemployment 1996 1999 2002 2005 2008 2011 2014 2017 2020
isn’t expected to peak as high as was previously
thought. We’d anticipate sales activity in 2021 being
around the 90,000 mark, similar to the past few
years, and in line with long term averages (albeit
Regional Sales Volumes
below past peaks in 2015-16 and the mid-2000s). (year-on-year % change)
55%
50%
45%
40%
35%
30%
25%
20%
15%
10%
5%
30.5% 54.4% 36.5% 32.4% 7.4% 32.4% 10.8%
NZ AUK HAM TAU WEL CHC DUN
18 Source: CoreLogicValues
Reflecting the tight supply/ Average Value of Housing Stock - New Zealand ($)
demand balance and low
mortgage rates, property
$788,967
$800,000
values have well and truly
spiked higher in the past few
$700,000
months. In addition, the upturn
has been broad-based across
the country, including $600,000
previously more subdued areas
such as Christchurch and $500,000
Selwyn.
In December, national average $400,000
property values rose by 2.6%,
taking the three month change $300,000
to 6.1%, and the annual growth $788,967
rate to 11.1%. That equates to a
$200,000
value of $788,967, up by almost
$79,000 from a year ago. This is
obviously a drastically different $100,000
level for house prices than
would have prevailed if those $0
pessimistic forecasts during 2005 2008 2011 2014 2017 2020
lockdown of a 15-20% fall in
prices had become reality. Annual and Quarterly Change in Value (%)
In addition, the momentum 20.0% Quarterly Change $45,289 6.1%
looks to be upwards for at least Annual Change $78,838 11.1%
the first few months of 2021 5 Year Change $229,919 41%
too. The end of the mortgage 15.0%
deferral scheme on 31st March
shouldn’t be too much of an
10.0%
issue, but the reinstatement of
LVRs on 1st March (especially if
investors were to eventually
5.0%
require a 40% deposit) and
ever-increasing affordability
pressures could start to bite 0.0%
thereafter and mean a slower
end to 2021 for property
values. -5.0% Quarterly Change $45,289 6.1%
Annual Change $78,828 11.1%
Annual Change %
5 Year Change $229,919
Quarterly Change % 41%
-10.0%
2005 2008 2011 2014 2017 2020
Quarterly Change % Annual Change %
19House Price Index
The upswing in property values has been seen Average Dwelling Value ($)
right across the country, and although the
‘provincial’ markets are still seeing the largest $1,200,000
New Zealand
gains, the main centres have accelerated too. Auckland
Hamilton
$1,000,000 Tauranga
Wellington
Areas such as Gisborne (30.4%), Masterton Christchurch
Dunedin
(29.6%), and Rangitikei (27.6%) have all seen $800,000
average property values rise by more than 25%
$600,000
over the past 12 months. But larger areas such as
Palmerston North and New Plymouth have also $400,000
seen pretty strong gains in values, at 20.3% and
11.8% respectively. $200,000
In Auckland, average values have risen 6.0% over $0
2008 2011 2014 2017 2020
the past three months (to December), and by 9.1%
over the past year. Manukau and Waitakere have
seen the fastest upturns within Auckland, while the more expensive North Shore and Auckland City (old
territorial authority) markets have lagged behind slightly.
Tauranga’s average values have surged by 10.2% in the past three months and by 14.8% over the past year, to
now stand at $876,122. Hamilton has seen an increase of close to 12% since December last year, while
Dunedin’s average values are up by 13.1%, and the wider Wellington area (City, Porirua, Upper Hutt, Lower
Hutt) by 15.4%.
Meanwhile, even the previously lagging markets around Canterbury have shown signs of life. Selwyn and
Christchurch have both seen average values rise by about 3.5% in the past three months (and by roughly 6%
over the past 12 months), while Waimakariri’s figures have been 5.4% and 8.5% respectively.
December 2020
Current value 1 month 3 months 12 months 5 years
New Zealand $788,967 2.6% 6.1% 11.1% 41%
Auckland $1,142,700 2.4% 6.0% 9.1% 23%
Hamilton $674,562 2.3% 4.1% 11.7% 52%
Tauranga $876,122 6.8% 10.2% 14.8% 62%
Wellington $861,794 3.2% 8.1% 15.4% 81%
Christchurch $539,561 1.6% 3.4% 6.2% 12%
Dunedin $582,269 1.9% 6.4% 13.1% 88%
20Annual Value Change (%)
-4% 36%
© 2021 Mapbox © OpenStreetMap
Over a 12 month horizon, average property values have risen in almost all parts of the country, with the most
strength evident in the central and lower North Island. Queenstown’s values have ‘only’ been flat over the
past 12 months, but this is actually a pretty good result, given the sharp falls seen in the first few months
after lockdown.
21Three Month Value Change (%)
-1% 9%
© 2021 Mapbox © OpenStreetMap
Over the shorter three-month period since September, the acceleration in the property market is clear
to see pretty much right across the country – including almost all of the North Island, and large parts of
Canterbury and Otago. Parts of Southland, by contrast, have looked a little softer.
22Rent
National Annual Change Gross Rental Yield – National (%)
in Value and Rent (%)
20% Annual change in rent
4 .5%
Annual change in value
15% 4 .0%
3 .5%
10%
3 .0%
5%
2 .5%
0% 2 .0%
1 .5%
-5%
1 .0%
-10%
0 .5%
-15% 0 .0%
2005 2008 2011 2014 2017 2020 2005 2008 2011 2014 2017 2020
National rents averaged $480 in the three months to December, up by 8.0% from the same period a year earlier. Rental
growth has accelerated quite strongly since it dipped to about 3% in July/August, and there are certainly few signs of much
rental weakness, which might have been anticipated given the unemployment problems being experienced by younger
workers at present (who are more likely to be renting than in owner-occupation).
Auckland’s rents in the three months to November averaged $566 per week, up by 6.8% from a year earlier, while
Wellington’s market has been a little softer lately, with rents ‘only’ up by 4.7% annually. By contrast, Dunedin has seen
average rents rise by 10.5% over the past year, Tauranga by 10.6%, and Hamilton and Christchurch both at 8-9%.
Meanwhile, outside the main centres, areas such as Gisborne, Whanganui, and Invercargill have all seen average weekly
rents rise by about 15% or more over the past year. It’s only really Queenstown that continues to see much downwards
rental pressure, with a drop of almost 17% over the past year.
Rental yields around the main centres range from 2.6% in Auckland up to 3.8% in Christchurch. With term deposit rates
falling (and borrowing getting cheaper too), the rising presence of investors in the market shows that those property yields
are starting to look increasingly attractive.
Med Weekly Rent Ann chg rent Gross yield
Auckland $566 6.8% 2.6%
Hamilton $433 7.5% 3.3%
Tauranga $523 10.6% 3.1%
Wellington $566 4.7% 3.0%
Christchurch $399 9.4% 3.8%
Dunedin $393 10.5% 3.5%
23Buyer Classification
Buyer Classification – NZ Property Transfers by Non-Citizens
New Zealand (% of sales) or no Resident Visa (% of total transfers)
3 .5%
Mover
30% 30% First Home Buyer
27% Multiple Property Owner Mortgage
3 .0%
Multiple Property Owner Cash
30% 30% 26% New to Market
26%
ReEntry
26% Other
26% 23% 2 .5%
21% 25%
20% 21% 25%
2 .0%
20%
1 .5%
12%
10% 10% 12% 1 .0%
10% 10%
5%
5%
4%
5%5%
5%
0 .5%
4% 5%
4%
4% 2%1%
0%
0% 0 .0%
2005
2005 2008
2008 2011
2011 2014
2014 2017
2017 2020
2020 2017 2018 2019 2020
Mover Multiple property owner mortgage Buying Selling
First home buyer Multiple property owner cash
New to market ReEntry Other
The past few months have seen a continuation of recent buyer trends, with first home buyers (FHBs)
managing to sustain a market share in the mid-20%’s, while mortgaged investors have continued to rise, with
movers (i.e. existing owner-occupiers) tending to be relatively quiet.
The key trend in recent months has really been the continued growth in market share for mortgaged
investors. Indeed, after troughing at just 22% in Q4 2017, their share of purchases has steadily risen and in Q3
2020 was 26%. It has pushed even higher in Q4, reaching 27% – that is the highest figure seen since 28% in Q3
2016, which was just prior to the Reserve Bank (RBNZ) imposing the 40% deposit requirement on investors
nationwide.
The low interest rate environment is having a two-way effect on investors – it’s cheap to borrow, so they’re
actively seeking property because of that. But at the same time, low rates on term deposits are also creating
an incentive to take money out of the bank and look for alternative asset choices, such as property. Indeed,
the stock of money held in bank term deposits has actually fallen in recent months. Meanwhile, investor
demand for property has also been stimulated by the temporary removal of the LVR speed limits, which has
allowed more buyers to get in with a 20% deposit rather than the previous 30%.
Of course, the Reserve Bank has consulted on reinstating a 30% deposit for investors, which looks likely to
commence from 1st March. Meanwhile, ANZ for example has already gone further, requiring a 40% deposit
from investors. These restrictions are likely to take some heat out of investor demand, but not remove it
altogether – there’ll still be buyers who can find the required 30-40% deposit.
Meanwhile, the share of property purchases in Q4 made by FHBs was 23%, down from Q3’s figure of 25%, but
still a very strong share by historical standards. FHBs are still using their KiwiSaver funds for the deposit (or at
least part of it), while a compromise on location and/or property type is also helping them into the market.
Looking at movers, their share of purchases dipped to just 26% in Q4, an historically low level (indeed the
lowest since Q4 2010). In some cases, existing owner occupiers aren’t moving because they simply can’t find
the ideal next property, given the tight supply of available listings. In turn, that is feeding back into an even
tighter listings picture – i.e. it’s a vicious circle.
24 Source: Statistics New ZealandMain Cities Housing
Market Indicators
25Auckland Market Activity
Buyer Classification – Auckland Buyer Classification – Northland
(% of purchases) region (% of purchases)
40%
Mover First Home Buyer
Multiple Property
30% Multiple Property Owner Mortgage
Multiple Property
Multiple Property34%
Owner Cash
New to Market
30% 30% First Home Buyer 32%
Mover
28%
28% 29% New to Market32%
30% ReEntry
27%
27% 28% Other
30%
ReEntry
Other
27% 26%
27% 23% 27%
20%
20% 20% 22% 21%
20%
21% 21%
20% 20%
19% 18%
15%
15%
12% 15% 15%
10%
10% 11% 12%
10%
10%
7%
7% 8% 7%
6%
5% 7% 7%
7%
4%
4% 5%
4% 4% 5%
4%
0% 1%
1% 4%
4% 2%
2%
0% 2005 2008 2011 2014 2017 2020 0%
0%
2005 2008 2011 2014 2017 2020 2004
2003 2006
2006 20082009 2010 2012
2012 2014
2015 2016 2018
2018 2020
2021
Mover Multiple property owner mortgage Mover Multiple property owner mortgage
First home buyer Multiple property owner cash First home buyer Multiple property owner cash
New to market ReEntry Other New to market ReEntry Other
The national Buyer Classification trends over recent months have also been seen in Auckland, but perhaps to
an even stronger extent.
Indeed, the share of purchases going to mortgaged investors has spiked up to 30% in Q4, up from 26% back
in the middle of 2020 and also above the national share (27%). Gross rental yields are relatively low in
Auckland, so it’s possible that some of these investors have found what they perceive to be ‘bargains’,
potentially timing the market right at the start of another upswing phase.
The rise in market share for mortgaged investors has come alongside a continued low presence for movers,
with their share at just 23% in Q4 2020, roughly the lowest levels since 2009. Again, in some cases this is likely
to reflect the shortage of listings and their inability to find the ideal next property.
Meanwhile, the market share for first home buyers in Auckland has dipped in the past few months, now
standing at 26%, down from 29% in Q3. Given the renewed upswing in property values (from an already high
level of >$1m) in our biggest city, this could be the first signs of ‘fatigue’ from FHBs.
Around Auckland’s neighbouring areas, the mix of buyers is quite different in Northland, with movers
accounting for the highest share of activity, at 30% in Q4 2020. First home buyers have a much lower
presence in this market, at just 16% in Q4, while mortgaged investors have also been quieter, at 19%.
26Auckland Values
Average value of housing stock Annual and quarterly value change
Auckland ($) Auckland (%)
$1,142,700
$1,200,000 $64,374 6.0%
25.0% Quarterly Change
$1,100,000 Annual Change $95,590 9.1%
5 Year Change $210,000 23%
$1,000,000 20.0%
$900,000
15.0%
$800,000
$700,000 10.0%
$600,000
5.0%
$500,000
$400,000
$1,142,700 0.0%
$300,000
-5.0%
$200,000 Annual Change %
-10.0% Quarterly Change %
$100,000
$0 2005 2008 2011 2014 2017 2020
2005 2008 2011 2014 2017 2020
Quarterly Change % Annual Change %
The upturn in average property values for Auckland as a whole in the past few months has reflected rising markets across
each sub-area. Indeed, over the past three months, the changes in average values have ranged from around 4% to 6%
everywhere, with Franklin at the bottom of the range (4.1%) and the Auckland and Manukau City areas equal top (6.3%).
On an annual basis, the wider Auckland market has seen average values rise by 9.1%, to now stand at $1,142,700. In the
sub-markets, those annual growth rates have ranged from 7.8% in Papakura and Auckland City (old council area), up to
11.5% in Manukau.
In broad terms, first home buyers and mortgaged investors tend to be more active in cheaper areas, while movers are
more important in more expensive areas (where a higher amount of equity is required). This pattern for buyer types – with
FHBs and investors generally busy at present; but movers quieter – would help to explain continued rapid value gains in
cheaper parts of Auckland, but a (slightly) more subdued picture elsewhere.
DECEMBER 2020
Current value 1 month 3 month 12 months 5 years
Rodney $1,040,323 2.1% 5.6% 10.2% 28%
North Shore $1,311,259 2.7% 6.1% 9.1% 20%
Waitakere $912,136 2.2% 5.6% 11.1% 22%
Auckland City $1,342,162 2.3% 6.3% 7.8% 22%
Manukau $1,005,432 2.8% 6.3% 11.5% 26%
Papakura $771,697 1.3% 4.3% 7.8% 28%
Franklin $740,042 1.9% 4.1% 9.3% 28%
27Current Suburb Values:
‘Mapping the Market’
Auckland suburb value change 2020 ($)
Generally speaking, property values around the country have bounced back strongly since lockdown, and
even Queenstown (where there were initially sharp falls) now seems to be past the worst too. CoreLogic’s
interactive ‘Mapping the Market’ product shows the changes over the past 12 months (covering a pre- and
post-COVID phase), it’s freely available and updated quarterly. The heatmaps in ‘Mapping the Market’ are
point-in-time snapshots of median values from 2019 and 2020, and show the % and $ change over that period
too. See www.corelogic.co.nz/mapping-market
Auckland is illustrated in the heatmap here. Herne Bay remains the highest priced suburb in Auckland (and
the entire country), with a median property value of $2.68m. Auckland Central has the lowest median value
(reflecting its concentration of apartments), at about $548,000. Only three suburbs have a median value29
Hamilton Market Activity
Buyer Classification – Hamilton Buyer Classification – Waikato region
(% of purchases) (% of purchases)
40% First Home Buye
40% Mover Multiple Property
40% First Home Buyer Multiple Property
37% Multiple Property Owner Cash New to Market
Multiple Property Owner Mortgage 32% Mover
35% Market 31%
New to30% 32% ReEntry
ReEntry Other
30% 31% Other
30% 31%
30%31% 28% 25%
27%
27% 26%
24%
25%
25% 25%
20%
22%
20% 20%
20% 20% 19%
19% 17%
17% 18%
14%
14% 15%
14%
12%
10%
10% 10%
10%
7%7% 6%
8%
4% 4%
6% 5%5%
4%4% 5%5%
3%3% 3%
4% 3%
4%
2%
1% 3% 2%
0%0% 1% 0%
0%
2%
2004 2006
2006 2008
2008 2010
2010 2012
2012 2014
2014 2016
2016 2018
2018 2020
2020 2004 2006 200820092010 2012 2014 2015
2016 2018 2020 2021
2003 2006 2012 2018
Mover Multiple property owner mortgage Mover Multiple property owner mortgage
First home buyer Multiple property owner cash First home buyer Multiple property owner cash
New to market ReEntry Other New to market ReEntry Other
Hamilton’s Buyer Classification trends have also mirrored the national picture lately, but with the upswing in
market share for mortgaged investors even more pronounced.
Indeed, in the fourth quarter of 2020, mortgaged investors accounted for 37% of property purchases in
Hamilton, well above the national figure of 27% (which itself was pretty high). Again, low term deposit rates are
likely to be diverting funds towards property in Hamilton, alongside cheap mortgage rates that are
encouraging borrowing.
Meanwhile, first home buyers had a 28% share of purchases in Hamilton in Q4 2020, more or less the highest
on record. Cheaper property than in surrounding main centres (such as Auckland and Tauranga) could be
attracting some FHBs into the Hamilton market. Finally, the share in Hamilton going to movers remains low, at
just 20% in the fourth quarter of 2020.
Around the wider Waikato region (excluding Hamilton), buyer classification patterns in Q4 saw movers’ share
hold relatively steady (at about 32%), and FHBs also hold their ground at around 18%. However, mortgaged
investors’ market share continued to rise, reaching 24% in Q4.
30Hamilton Values
Average value of housing stock Annual and quarterly value change
Hamilton ($) Hamilton (%)
$700,000 $674,562 Quarterly Change $26,785 4.1%
30.0% Annual Change $70,528 11.7%
5 Year Change $230,351 52%
$600,000
25.0%
20.0%
$500,000
15.0%
$400,000
10.0%
$300,000 5.0%
$200,000
$674,562 0.0%
-5.0%
Annual Change %
$100,000 Quarterly Change %
-10.0%
$0 2005 2008 2011 2014 2017 2020
2005 2008 2011 2014 2017 2020
Quarterly Change % Annual Change %
Hamilton’s average property values have also been strong in the past few months, up by 2.3% in December alone and by
4.1% since September. The level is now just short of $675,000.
The growth in December was pretty broad-based across Hamilton, ranging from about 2% in Central & North West and
South East, up to almost 3% in North East. On a three-month change, Central & North West has lagged a little, but North
East (6.2%) and South West (5.6%) have risen sharply. Across the board for Hamilton’s sub-areas, annual changes in average
property values are now in the double-digits.
DECEMBER 2020
Current value 1 month 3 month 12 months 5 years
Hamilton Central &
$617,999 1.8% 1.5% 10.4% 48%
North West
Hamilton North East $835,599 2.8% 6.2% 11.7% 49%
Hamilton South East $622,686 1.8% 3.6% 11.2% 53%
Hamilton South West $613,105 2.4% 5.6% 13.8% 56%
31Tauranga Market Activity
Buyer Classification – Tauranga Buyer Classification – Bay of Plenty
(% of purchases) region (% of purchases)
40% 40%
40%
40% First Home Buye
First Home Buyer Multiple Property
Multiple Property Owner Mortgage Multiple Property
Multiple Property Owner Cash
New to Market
Mover
New to Market Mover
33%
33% 31% ReEntry ReEntry
30% 30% Other
31% 30% 30%
Other 30%
30%
30%
28%
27% 27% 27%
27%
25% 25%
23%
23%
22%
20% 20%
20%
19% 20%
16% 18%
18%
16% 17%
15% 16% 13%
14%
15% 15% 13%
13%
13%
10%
10% 10%
10%
6%
6%
4% 5% 5% 6%
6% 6%
5%
3%
4% 5% 4% 4%
4% 5%
5%
3% 2% 3%
3% 1%
0%0% 2% 0%
2%
0%
2004 2006
2006 2008
2008 2010
2010 2012
2012 2014
2014 2016
2016 2018
2018 2020
2020 2003 2006 2009 2012 2015 2018 2021
2003 2006 2009 2012 2015 2018 2021
Mover Multiple property owner mortgage Mover Multiple property owner mortgage
First home buyer Multiple property owner cash First home buyer Multiple property owner cash
New to market ReEntry Other New to market ReEntry Other
From October to December, movers remained the key buyer group in Tauranga, accounting for 31% of
purchases. The high market share for movers contrasts with all of the other main centres, and potentially
illustrates how a solid base of equity/wealth (which movers have, either from having lived locally or bringing in
equity from other parts of the country) is important in Tauranga, rather than necessarily local wages being a
key driver for a property purchase.
Meanwhile, first home buyers’ market share dipped in Tauranga in Q4, from 19% in Q3 to 16% - still broadly in
line with past norms. By contrast, mortgaged investors’ market share continued to creep higher, from 24% in
Q3 2020 to 27%. That was the highest share for investors in Tauranga since Q1 2018, and is a consistent trend
with many other parts of the country. Around the wider Bay of Plenty region (excluding Tauranga), mortgaged
investors are also seeing a solid market share at present, with movers a little quieter than normal.
32Tauranga Values
Average value of housing stock Annual and quarterly value change
Tauranga ($) Tauranga (%)
$900,000
$876,122
30.0% Quarterly Change $80,940 10.2%
Annual Change $112,700 14.8%
$800,000
25.0% 5 Year Change $334,241 62%
$700,000
20.0%
$600,000
15.0%
$500,000
10.0%
$400,000
5.0%
$300,000 $876,122 0.0%
$200,000
-5.0%
$100,000 Annual Change %
-10.0% Quarterly Change %
$0
2005 2008 2011 2014 2017 2020 2005 2008 2011 2014 2017 2020
Quarterly Change % Annual Change %
Tauranga’s average property values have soared in the past few months, rising 10.2% from September to December.
They’re also up by 14.8% over the past 12 months, which equates to almost $113,000. The level of values in Tauranga now
stands at more than $876,000. In surrounding areas such as Rotorua and Whakatane, the picture is a little mixed.
Whakatane’s values have been flat since September, and up by ‘only’ 6.4% in the past 12 months. However, in Rotorua,
momentum is much stronger, with the three-month gain at 8.8% and annual gain at 19.2%.
33Wellington Market Activity
Buyer Classification – Wellington Buyer Classification – Lower Hutt
(% of purchases) region (% of purchases)
40% First Home Buyer
40%
Mover
Multiple Property Owner Cash
First Home Buye
30% 30% Multiple Property Owner Mortgage
40% Multiple Propert
29% New to Market
27% Multiple Propert
ReEntry
27% New to Market
33% Other 33% ReEntry
30%
31% 30% 30%
30% 32% Mover
Other
30% 30%
27%
27%
20% 21%
25% 25%
23% 25%
22%
20%
19% 20%
20%
16% 18%
15% 17%
14%
10% 9% 15% 13%
10% 8% 10%
10%
6%
4%
4%
5%
4% 5% 6%
5% 6%
7%
5%
3%
3% 4% 4%
4%
4%
5%
2%
3%
2% 2% 0% 3%
0%0% 2004 2008 2012 2016
1%
2020
2005 2008 0%
2006 2008 201020112012 2014
2014 2017 2018 2020
2016 2020
2003 2006 2009 2012 2015 2018 2021
Mover Multiple property owner mortgage Mover Multiple property owner mortgage
First home buyer Multiple property owner cash First home buyer Multiple property owner cash
New to market ReEntry Other New to market ReEntry Other
Across the four main territorial authorities in Wellington (City, Lower Hutt, Upper Hutt, Porirua), first home
buyers remained the largest buyer group in Q4, accounting for 30% of property purchases. That was down a
touch from the figure of 31% in Q3, but still a very high level. Porirua remains a hotspot for first home buyers,
where they accounted for 32% of property purchases in Q4, with Lower Hutt seeing a figure of 33%.
Tucked just in behind first home buyers were mortgaged investors, with their rising market share a similar
trend to many other parts of the country. Lower Hutt has seen a surge of investor activity lately, with their
share rising from 22% in the second quarter of 2020 to 32% in Q4. Wellington City also has a relatively high
presence for mortgaged investors, at 29% (on a par with first home buyers).
Meanwhile, existing owner occupiers are very quiet around Wellington at present, accounting for just 21% of
purchases in Q4, basically a record low for the 15 year history of this series. As with other parts of the country,
the tight supply of available listings is meaning that many would-be movers are instead just staying where
they are, and potentially renovating (rather than run the risk of selling and not being able to find their ideal
next home).
Elsewhere around the Wellington region, mortgaged investors have also been a rising presence on the Kapiti
Coast in particular, with their share of property purchases rising from less than 20% a couple of years ago to
27% in the final quarter of 2020.
34Wellington Values
Average value of housing stock Annual and quarterly value change
Wellington ($) Wellington (%)
$900,000 $861,794
Quarterly Change $64,598 8.1%
$800,000
Annual Change $114,839 15.4%
20.0% 5 Year Change $385,173 81%
$700,000
15.0%
$600,000
10.0%
$500,000
5.0%
$400,000
0.0%
$300,000
$861,794
-5.0%
$200,000 Annual Change %
Quarterly Change %
-10.0%
$100,000 2005 2008 2011 2014 2017 2020
$0
2005 2008 2011 2014 2017 2020 Quarterly Change % Annual Change %
The wider Wellington property market has been part of the boom in the past few months, with growth in average values
since September ranging from 7-8% in Upper Hutt, Carterton, Lower Hutt, Wellington City, and Kapiti Coast, up to a
rampant 14.2% in South Wairarapa and 17.4% in Masterton.
On an annual basis, growth has been at least 20% in Masterton, South Wairarapa, and Porirua, but also in double digits in
every other area of the region too. Wellington City has the highest level for property values, with the higher starting point
potentially contributing to slightly lower growth (but still strong at 13.4% annually).
DECEMBER 2020
Current value 1 month 3 month 12 months 5 years
Porirua $788,104 4.6% 10.9% 20.8% 98%
Upper Hutt $707,138 2.3% 6.9% 17.2% 104%
Lower Hutt $750,542 3.8% 7.7% 17.2% 93%
Wellington City $970,669 2.8% 7.9% 13.4% 70%
Carterton $533,796 3.2% 7.4% 18.0% 101%
Masterton $519,437 6.8% 17.4% 29.6% 113%
South Wairarapa $694,312 4.3% 14.2% 26.7% 119%
Kapiti Coast $746,081 4.7% 8.4% 18.3% 91%
35Christchurch Market Activity
Buyer Classification – Christchurch Buyer Classification – Canterbury
(% of purchases) region (% of purchases)
40%40% First Home Buyer
New40%to Market First Home Buye
Multiple Property Owner Cash Multiple Property
Multiple Property Owner Mortgage Multiple Property
New to Market
33% Mover 40%
Mover
33% ReEntry 37% ReEntry
30%30% Other
28% 31% 30% 30%
Other
35%
27% 27%
24% 30% 27%
25% 25%
23%
23%
22%
22%
20%20%
19% 20% 22% 22%
16% 20% 18% 19%
15% 14%
13% 15% 13%
16%
10% 13%
10% 10%
6%
8% 10% 10%
4% 5% 6% 6%
4%
3%
5% 4% 6%
4%
5%
5%
5%
5% 5%
4% 2% 3% 1%
0% 0% 1% 3% 1%
0%
0%
2005
2006 2008
2008
20102011 2012 2014
2014
2016
2017
2018 20202020 2003 2006 2009 2012 2015 2018 2021
2003 2006 2009 2012 2015 2018 2021
Mover Multiple property owner mortgage Mover Multiple property owner mortgage
First home buyer Multiple property owner cash First home buyer Multiple property owner cash
New to market ReEntry Other New to market ReEntry Other
Christchurch is seeing very similar Buyer Classification trends to the other main centres, with first home
buyers and mortgaged investors active (and rising), but movers quiet.
Indeed, the market share for FHBs was pretty steady at 28% in Q4 2020, in line with past highs. Meanwhile,
the share of purchases going to mortgaged investors continued to rise in Q4, and now stands at 27% – up
from 21% a couple of years ago and the highest figure since Q3 2016. Movers’ market share in Christchurch
was just 22% in Q4, a low only matched once before (in Q4 2013).
Around the wider Canterbury region, movers play a bigger role than in Christchurch itself, such as in
Ashburton where movers were 34% of activity in 2020 (albeit down from 38% in 2019). In Waimakariri, movers’
share was even higher last year, at 44% (up from 41% in 2019), while Selwyn’s figure was 40% (up from 35% in
2019). To some degree, the high share for movers in Selwyn will reflect existing owners (either from Selwyn or
other parts of Canterbury) seeking out a new-build.
36You can also read