QUARTERLY PROPERTY MARKET & ECONOMIC UPDATE - NEW ZEALAND QUARTER 3, 2019 - CORELOGIC
←
→
Page content transcription
If your browser does not render page correctly, please read the page content below

Quarterly Property Market
& Economic Update
New Zealand
Quarter 3, 2019

Table of Contents
    About CoreLogic.  .  .  .  .  .  .  .  .  .  .  .  .  .  .  .  .  .  .  .  .  .  .  .  .  .  .  .  .  .  .  .  .  .  .  .  .  .  .  .  .  .  .  .  .  .  .  .  .  .  .  .  .  .  .  .  .  .  .  .  .  .  .  .  .  .  .  .  .  . 3
    Executive Summary.  .  .  .  .  .  .  .  .  .  .  .  .  .  .  .  .  .  .  .  .  .  .  .  .  .  .  .  .  .  .  .  .  .  .  .  .  .  .  .  .  .  .  .  .  .  .  .  .  .  .  .  .  .  .  .  .  .  .  .  .  .  .  .  .  .  . 4
    Macro Economic and Demographic Indicators.  .  .  .  .  .  .  .  .  .  .  .  .  .  .  .  .  .  .  .  .  .  .  .  .  .  .  .  .  .  .  .  .  .  .  .  .  .  .  .  .  .  .  . 5
            New Zealand Asset Classes .  .  .  .  .  .  .  .  .  .  .  .  .  .  .  .  .  .  .  .  .  .  .  .  .  .  .  .  .  .  .  .  .  .  .  .  .  .  .  .  .  .  .  .  .  .  .  .  .  .  .  .  .  .  .  .  .  .  .  .  . 6
            New Zealand and Australia GDP Growth. .  .  .  .  .  .  .  .  .  .  .  .  .  .  .  .  .  .  .  .  .  .  .  .  .  .  .  .  .  .  .  .  .  .  .  .  .  .  .  .  .  .  .  .  .  .  .  .  . 7
            New Zealand Population.  .  .  .  .  .  .  .  .  .  .  .  .  .  .  .  .  .  .  .  .  .  .  .  .  .  .  .  .  .  .  .  .  .  .  .  .  .  .  .  .  .  .  .  .  .  .  .  .  .  .  .  .  .  .  .  .  .  .  .  .  .  .  . 8
             Migration .  .  .  .  .  .  .  .  .  .  .  .  .  .  .  .  .  .  .  .  .  .  .  .  .  .  .  .  .  .  .  .  .  .  .  .  .  .  .  .  .  .  .  .  .  .  .  .  .  .  .  .  .  .  .  .  .  .  .  .  .  .  .  .  .  .  .  .  .  .  .  .  .  .  .  .  . 9
             Regional Building Consents .  .  .  .  .  .  .  .  .  .  .  .  .  .  .  .  .  .  .  .  .  .  .  .  .  .  .  .  .  .  .  .  .  .  .  .  .  .  .  .  .  .  .  .  .  .  .  .  .  .  .  .  .  .  .  .  .  .  .  . 10
             Consumer Confidence.  .  .  .  .  .  .  .  .  .  .  .  .  .  .  .  .  .  .  .  .  .  .  .  .  .  .  .  .  .  .  .  .  .  .  .  .  .  .  .  .  .  .  .  .  .  .  .  .  .  .  .  .  .  .  .  .  .  .  .  .  .  .  .  . 10
             Employment .  .  .  .  .  .  .  .  .  .  .  .  .  .  .  .  .  .  .  .  .  .  .  .  .  .  .  .  .  .  .  .  .  .  .  .  .  .  .  .  .  .  .  .  .  .  .  .  .  .  .  .  .  .  .  .  .  .  .  .  .  .  .  .  .  .  .  .  .  .  .  .  . 11
             Interest Rates .  .  .  .  .  .  .  .  .  .  .  .  .  .  .  .  .  .  .  .  .  .  .  .  .  .  .  .  .  .  .  .  .  .  .  .  .  .  .  .  .  .  .  .  .  .  .  .  .  .  .  .  .  .  .  .  .  .  .  .  .  .  .  .  .  .  .  .  .  .  .  . 12
    Housing Overview .  .  .  .  .  .  .  .  .  .  .  .  .  .  .  .  .  .  .  .  .  .  .  .  .  .  .  .  .  .  .  .  .  .  .  .  .  .  .  .  .  .  .  .  .  .  .  .  .  .  .  .  .  .  .  .  .  .  .  .  .  .  .  .  .  .  . 13
            Lending Conditions .  .  .  .  .  .  .  .  .  .  .  .  .  .  .  .  .  .  .  .  .  .  .  .  .  .  .  .  .  .  .  .  .  .  .  .  .  .  .  .  .  .  .  .  .  .  .  .  .  .  .  .  .  .  .  .  .  .  .  .  .  .  .  .  .  .  . 14
            Sales Volumes.  .  .  .  .  .  .  .  .  .  .  .  .  .  .  .  .  .  .  .  .  .  .  .  .  .  .  .  .  .  .  .  .  .  .  .  .  .  .  .  .  .  .  .  .  .  .  .  .  .  .  .  .  .  .  .  .  .  .  .  .  .  .  .  .  .  .  .  .  .  .  . 15
            Listings.  .  .  .  .  .  .  .  .  .  .  .  .  .  .  .  .  .  .  .  .  .  .  .  .  .  .  .  .  .  .  .  .  .  .  .  .  .  .  .  .  .  .  .  .  .  .  .  .  .  .  .  .  .  .  .  .  .  .  .  .  .  .  .  .  .  .  .  .  .  .  .  .  .  .  .  .  . 16
            Nationwide Values .  .  .  .  .  .  .  .  .  .  .  .  .  .  .  .  .  .  .  .  .  .  .  .  .  .  .  .  .  .  .  .  .  .  .  .  .  .  .  .  .  .  .  .  .  .  .  .  .  .  .  .  .  .  .  .  .  .  .  .  .  .  .  .  .  .  .  . 18
            House Price Index .  .  .  .  .  .  .  .  .  .  .  .  .  .  .  .  .  .  .  .  .  .  .  .  .  .  .  .  .  .  .  .  .  .  .  .  .  .  .  .  .  .  .  .  .  .  .  .  .  .  .  .  .  .  .  .  .  .  .  .  .  .  .  .  .  .  .  . 19
            Rent.  .  .  .  .  .  .  .  .  .  .  .  .  .  .  .  .  .  .  .  .  .  .  .  .  .  .  .  .  .  .  .  .  .  .  .  .  .  .  .  .  .  .  .  .  .  .  .  .  .  .  .  .  .  .  .  .  .  .  .  .  .  .  .  .  .  .  .  .  .  .  .  .  .  .  .  .  .  .  .  . 22
            Buyer Classification .  .  .  .  .  .  .  .  .  .  .  .  .  .  .  .  .  .  .  .  .  .  .  .  .  .  .  .  .  .  .  .  .  .  .  .  .  .  .  .  .  .  .  .  .  .  .  .  .  .  .  .  .  .  .  .  .  .  .  .  .  .  .  .  .  .  . 23
    Main Cities Housing Market Indicators. .  .  .  .  .  .  .  .  .  .  .  .  .  .  .  .  .  .  .  .  .  .  .  .  .  .  .  .  .  .  .  .  .  .  .  .  .  .  .  .  .  .  .  .  .  .  .  .  . 24
            Auckland Market Activity. .  .  .  .  .  .  .  .  .  .  .  .  .  .  .  .  .  .  .  .  .  .  .  .  .  .  .  .  .  .  .  .  .  .  .  .  .  .  .  .  .  .  .  .  .  .  .  .  .  .  .  .  .  .  .  .  .  .  .  .  .  . 26
            Auckland Values .  .  .  .  .  .  .  .  .  .  .  .  .  .  .  .  .  .  .  .  .  .  .  .  .  .  .  .  .  .  .  .  .  .  .  .  .  .  .  .  .  .  .  .  .  .  .  .  .  .  .  .  .  .  .  .  .  .  .  .  .  .  .  .  .  .  .  .  .  . 27
            Auckland Suburb Value Change .  .  .  .  .  .  .  .  .  .  .  .  .  .  .  .  .  .  .  .  .  .  .  .  .  .  .  .  .  .  .  .  .  .  .  .  .  .  .  .  .  .  .  .  .  .  .  .  .  .  .  .  .  .  .  . 28
             Current Auckland Suburb Values .  .  .  .  .  .  .  .  .  .  .  .  .  .  .  .  .  .  .  .  .  .  .  .  .  .  .  .  .  .  .  .  .  .  .  .  .  .  .  .  .  .  .  .  .  .  .  .  .  .  .  .  .  .  . 30
             Hamilton Market Activity. .  .  .  .  .  .  .  .  .  .  .  .  .  .  .  .  .  .  .  .  .  .  .  .  .  .  .  .  .  .  .  .  .  .  .  .  .  .  .  .  .  .  .  .  .  .  .  .  .  .  .  .  .  .  .  .  .  .  .  .  .  . 32
             Hamilton Values .  .  .  .  .  .  .  .  .  .  .  .  .  .  .  .  .  .  .  .  .  .  .  .  .  .  .  .  .  .  .  .  .  .  .  .  .  .  .  .  .  .  .  .  .  .  .  .  .  .  .  .  .  .  .  .  .  .  .  .  .  .  .  .  .  .  .  .  .  . 33
             Tauranga Market Activity. . . . . . . . . . . . . . . . . . . . . . . . . . . . . . . . . . . . . . . . . . . . . . . . . . . . . . . . . . . . . . 34
             Tauranga Values.  .  .  .  .  .  .  .  .  .  .  .  .  .  .  .  .  .  .  .  .  .  .  .  .  .  .  .  .  .  .  .  .  .  .  .  .  .  .  .  .  .  .  .  .  .  .  .  .  .  .  .  .  .  .  .  .  .  .  .  .  .  .  .  .  .  .  .  .  . 35
             Wellington Market Activity .  .  .  .  .  .  .  .  .  .  .  .  .  .  .  .  .  .  .  .  .  .  .  .  .  .  .  .  .  .  .  .  .  .  .  .  .  .  .  .  .  .  .  .  .  .  .  .  .  .  .  .  .  .  .  .  .  .  .  .  . 36
             Wellington Values.  .  .  .  .  .  .  .  .  .  .  .  .  .  .  .  .  .  .  .  .  .  .  .  .  .  .  .  .  .  .  .  .  .  .  .  .  .  .  .  .  .  .  .  .  .  .  .  .  .  .  .  .  .  .  .  .  .  .  .  .  .  .  .  .  .  .  .  . 37
             Christchurch Market Activity.  .  .  .  .  .  .  .  .  .  .  .  .  .  .  .  .  .  .  .  .  .  .  .  .  .  .  .  .  .  .  .  .  .  .  .  .  .  .  .  .  .  .  .  .  .  .  .  .  .  .  .  .  .  .  .  .  .  . 38
             Christchurch Values.  .  .  .  .  .  .  .  .  .  .  .  .  .  .  .  .  .  .  .  .  .  .  .  .  .  .  .  .  .  .  .  .  .  .  .  .  .  .  .  .  .  .  .  .  .  .  .  .  .  .  .  .  .  .  .  .  .  .  .  .  .  .  .  .  .  . 39
             Dunedin Market Activity.  .  .  .  .  .  .  .  .  .  .  .  .  .  .  .  .  .  .  .  .  .  .  .  .  .  .  .  .  .  .  .  .  .  .  .  .  .  .  .  .  .  .  .  .  .  .  .  .  .  .  .  .  .  .  .  .  .  .  .  .  .  . 40
             Dunedin Values. .  .  .  .  .  .  .  .  .  .  .  .  .  .  .  .  .  .  .  .  .  .  .  .  .  .  .  .  .  .  .  .  .  .  .  .  .  .  .  .  .  .  .  .  .  .  .  .  .  .  .  .  .  .  .  .  .  .  .  .  .  .  .  .  .  .  .  .  .  . 41
    CoreLogic Data and Analytics .  .  .  .  .  .  .  .  .  .  .  .  .  .  .  .  .  .  .  .  .  .  .  .  .  .  .  .  .  .  .  .  .  .  .  .  .  .  .  .  .  .  .  .  .  .  .  .  .  .  .  .  .  .  .  .  . 42
2            Legal Disclaimer .  .  .  .  .  .  .  .  .  .  .  .  .  .  .  .  .  .  .  .  .  .  .  .  .  .  .  .  .  .  .  .  .  .  .  .  .  .  .  .  .  .  .  .  .  .  .  .  .  .  .  .  .  .  .  .  .  .  .  .  .  .  .  .  .  .  .  .  .  . 43
About CoreLogic

CoreLogic is a leading property information, analytics and               Contact
services provider in the United States, Australia and New Zealand.
                                                                         Call us 0800 355 355
CoreLogic helps clients identify and manage growth opportunities,
improve performance and mitigate risk, by providing clients with         Wellington office
innovative, technology-based services and access to rich data            Level 2, 275 Cuba Street
and analytics.                                                           PO Box 4072
                                                                         Wellington 6140
Whilst all reasonable effort is made to ensure the information in this
publication is current, CoreLogic does not warrant the accuracy,         Auckland office
currency or completeness of the data and commentary contained in         Level 5
this publication and to the full extent not prohibited by law excludes   41 Shortland Street
all loss or damage arising in connection with the data and               Auckland 1010
commentary contained in this publication.                                Email: reports@corelogic.co.nz

                                                                         corelogic.co.nz                  3
Executive Summary
    The property market has just been ticking over            In terms of property values, the national average
    since June, with sales volumes relatively stable          now stands at more than $691,000, up by 2.4%
    and average values across the country continuing          from the same time a year ago. Amongst the main
    to rise by 2-3% annually. There doesn’t seem to           centres, Dunedin is still recording strong increases
    be anything too major in the pipeline that would          (12.8% in the year to September), but Auckland and
    throw this steadiness off course, but there are           Christchurch are softer, and Wellington City has also
    some important milestones to watch out for in the         cooled off in the past few months. Values in regional
    final few months of the year – including another          markets are generally still rising steadily, although
    potential cut to the official cash rate (OCR), a          the pace of growth has peaked.
    possible loosening of the loan to value ratio
    (LVR) speed limits, and the final decision on             Since the June quarter, the Government has
    bank capital requirements.                                also reset the KiwiBuild programme and, although
                                                              they’re still looking to build more houses, arguably
    Starting off with the macroeconomic environment,          the policy shift has been more towards helping
    the news remains supportive for the property              people into houses. This could well boost demand
    market. GDP growth is set to stay above 2%                more than supply. At least the private sector
    annually, full-time employment is still rising, and the   is ramping up supply activity, and new dwelling
    unemployment rate is very low. Net migration is still     consents continue to rise – importantly, smaller
    high too, which is another support for property           dwellings (apartments, flats) are comprising a
    demand. Consumer and business confidence remain           larger share of activity, which will be vital to
    a bit patchier, but don’t seem to be hampering the        house a growing population.
    property market.
                                                              Overall, it appears that market activity levels have
    Lending conditions have, if anything, eased a bit         found a floor and sales volumes should start to
    in the past few months – most importantly, the            improve over the coming months and into 2020.
    banks have become less strict on their internal           The strength of the upturn, however, may be held
    serviceability testing, while the cuts to the OCR have    back a little by a lack of listings around many parts
    also had a downward influence on mortgage rates.          of the country. Against that backdrop, property
    At the Financial Stability Report announcement on         value growth across NZ as a whole is likely to
    27th November there’s still a fair chance that the        stay slow and steady.
    Reserve Bank (RBNZ) will loosen the LVR speed
    limits, potentially raising the owner-occupier limit      One key ‘unknown’ for 2020 and the following years
    from 20% to 25%, and lifting the investor limit from      is the RBNZ’s decision around banks needing to hold
    5% to 10%. However, that is not set in stone yet, and     extra capital on their balance sheets. A final decision
    hints that sales activity and investor interest may be    is due by early December, and it appears that the
    rising again could give the RBNZ reasons to pause.        process to raise capital buffers would begin in
                                                              April next year, phased over a number of years.
    Indeed, the CoreLogic Buyer Classification series         The effect on mortgage availability and/or interest
    shows that mortgaged multiple property owners             rates, however, is hard to predict. Some estimates
    (MPOs or investors) have bounced back in terms of         are that mortgage rates could be pushed up by as
    their share of purchases over the past 2-3 months –       much as 1%, which may not seem much, but many
    in turn, smaller players (‘mums and dads’) have           borrowers have only known falling rates – so a rise
    played a key role in this rebound. In terms of the        could take a bit to get used to, and may be a
    causes, the scrapping of the capital gains tax            challenge for some households’ finances.
    proposals seems to have bolstered investors’
    confidence, while the low and falling returns on          As always, we keep a running monitor on the
    other assets (e.g. term deposits) will have also          property market every week via our NZ Property
    played a role. At the same time, property rents and       Market Pulse articles, so be sure to check these out
    yields have begun to rise (albeit from a low base).       on our website http://www.corelogic.co.nz/
    Investors don’t have it all their own way, though –       news-research/all-news/
    first home buyers still have a strong presence in
    many parts of the country.
4                                                                                                                 4
Macro Economic and
Demographic Indicators

                         5
New Zealand Asset Classes

                          RESIDENTIAL REAL ESTATE

                          $1.1 trillion
                          $273 Billion in home loans

                          COMMERCIAL/INDUSTRIAL REAL ESTATE

                          $217 billion
                          NZ LISTED STOCKS

                          $160 billion
                          NZ SUPER & KIWISAVER

                          $103 billion

    The value of residential property remains above one trillion dollars, with mortgages secured against 24%
    of this value. In other words, 76% of the value of the property market is household equity. However, it’s also
    important to note that household debt is high relative to income, and rising lending flows per month are being
    driven by larger average loan sizes. This is being sustained at present by low mortgage rates, but the prospect
    of tighter bank capital requirements, and potentially some sort of rise in mortgage rates, could be a test for
    some borrowers.

6   Sources: CoreLogic NZ, Reserve Bank of NZ, NZX, NZ Super Fund                                               6
New Zealand and Australia GDP growth
Annual Average GDP Growth (%)

 8
                                                                               NZ
 7
                                                                               Australia
 6
 5
 4
 3
 2
 1
 0
-1
-2
                                                           Capital Economics forecasts
-3
 1990             1994            1998           2002       2006            2010           2014           2018
New Zealand’s economy expanded by 0.5% from March to June, with growth of 2.1% from a year earlier (production
measure). Non-residential construction and manufacturing were sluggish in Q2, but agriculture and the services sector
were healthier.

More generally, the economy has continued to gradually slow and growth looks set to stay at about these rates (circa 2%
annually) for the rest of 2019 and in 2020, before improving again in 2021. That said, growth of 2% is still relatively solid
and won’t raise any serious concerns about the resilience of household finances or the residential property market.

Source: Reserve Bank of New Zealand, Capital Economics                                                                          7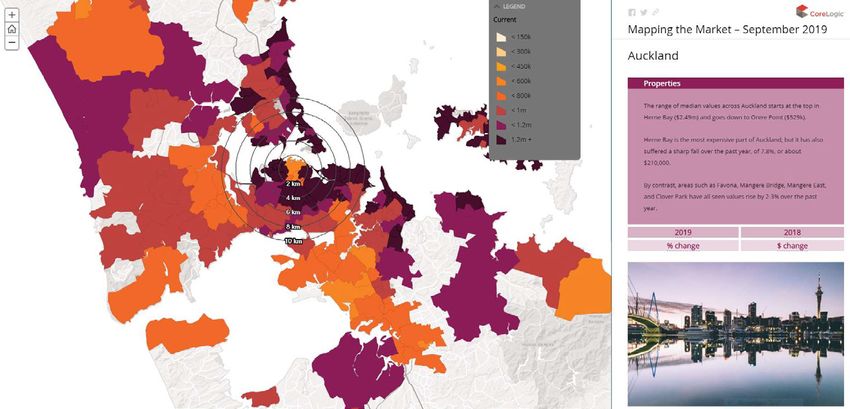
New Zealand Population
    Quarterly Change in National                                        Population Change
    Population (persons per quarter)                                    Composition (persons per quarter)
    30000                                                               25000

                         Quarterly population change
                                                                                        Natural increase
    25000                4 quarter moving average                       20000
                                                                                        Net migration

    20000                                                               15000

                                                                        10000
    15000

                                                                         5000
    10000

                                                                             0
     5000

                                                                         -5000
        0
            1991                2000                   2009   2018      -10000
                                                                                 1996                2005   2014

    Annual Change in Population
    (persons)

        New Zealand                                             91600

              Auckland                        38700

       Hamilton City      3900

       Tauranga City      3500

      Wellington City     3600

    Christchurch City       7000

        Dunedin City     1900

    Population growth held steady at 1.6% annually in the second quarter of 2019, with the total now standing
    at more than 4.9m. Going back three years, population growth was running faster, at more than 2% annually.

    The natural rate of increase (births minus deaths) has edged down a little over the past few years, but the
    most important driver of the slowdown in population growth has been a drop in net migration. That said,
    at about 50,000 per year, net migration is still high by past standards, and is boosting demand for property.

8   Sources: Statistics New Zealand
Migration
Long term migration                                                                                     Comparison of old and new net migration
(12-month rolling totals)                                                                               series (12-month rolling totals)
                                                                                                         80,000

                                                                                                         70,000                           Ol d
                                                                                                         60,000                           New

                                                                                                         50,000

                                                                                                         40,000

                                                                                                         30,000

                                                                                                         20,000

                                                                                                         10,000

                                                                                                                0

                                                                                                       -10,000

                                                                                                       -20,000

                                                                                                       -30,000
                                                                                                              2002                 2006          2010        2014   2018

Care is required when interpreting the net migration figures from Statistics NZ, given that the new methodology
(a switch from migration ‘intentions’ to migration ‘outcomes’) is still getting established. The issue is that the modelling
and assumptions required (given that outcomes aren’t known for sure until at least a year after the person arrived or
departed) have the potential to create large revisions from month to month – and the new methodology has produced
a very different path for migration than was shown by the previous figures.

That said, the methodology will settle down over time and, for now, we just have to use the data that we have. In the year
to August, Stats NZ reported that there was a net inflow of migrants of 53,812 – about 10,000 lower than the peak annual
inflow in July 2016 (63,948), but about 5,000 more than July 2018’s trough. Over the past year or so, both arrivals and
departures have risen, but arrivals have risen more quickly.

The key point for the property market is that this is still a strong inflow of people and a significant boost to overall
population growth, supporting property demand and values.

                                                                                       Net Gain Last Year                                               % Change

  TOTAL ALL AREAS                                                                                62,733                                                  -11.6%
  Auckland Region                                                                                 31,417                                                 -13.7%

  Hamilton City                                                                                    1,887                                                 -2.0%

  Tauranga City                                                                                     735                                                  -24.1%

  Wellington                                                                                       2,917                                                 -16.7%

  Christchurch City                                                                                4,722                                                 -13.5%

  Dunedin City                                                                                      899                                                  -15.2%

  Main Urban Area (Other)                                                                          4,719                                                 -14.3%

  Rural Centres                                                                                    3,713                                                 -23.0%

  Not applicable/Not stated                                                                       11,724                                                  3.4%

Source: Statistics New Zealand
*Note that these figures relate to Q3 2018. The next publication date for these figures from Statistics NZ is yet to be advised.                                           9
Regional Building Consents
New dwelling consents trend The boom in new residential dwelling
(consents per month) consents has rolled on in the past three
months, with the total for the year to
1,600
Auckland Region August coming in at 35,658. That’s the
1,400 Waikato Region highest 12-month figure since October
Wellington Region
Canterbury Region 1974 (36,805), although of course there
1,200
Rest of NI were fewer people in the country back
Rest of SI
1,000 then and a smaller housing stock
(meaning that the 1970s upswing was
800
even more significant in relative terms).
600 Even so, we’re clearly still in the midst of
one of the largest residential construction
400
upswings that NZ’s ever had. Indeed,
200 renovations work is also pretty high, with
consented alterations & additions totalling
0
1995 1999 2003 2007 2011 2015 2019 $1.79bn in the year to August.
Sources: Statistics New Zealand
The shift towards a more intensified housing stock has continued, with nearly 39% of the national dwelling
consents in the year to August being flats, townhouses, or apartments (as opposed to standalone houses).
That’s the highest share for at least 30 years, and is very welcome given the growing population and
pressures on the infrastructure in the areas where people want to live. In Auckland, more than 53% of
consents over the past year have been for smaller dwellings, also the highest level for more than 30 years.
It remains to be seen how long this boom in residential construction can continue, given reports of capacity
constraints and labour shortages. But even if consents flatten out from here, there’d still be a large pipeline
of work to get through, and shortages of builders may just mean that completion times stretch out a bit
(rather than the house not actually being built at all).
Consumer Confidence Consumer confidence edged higher in the
last few months of 2018 and into the first
few months of 2019, but since a high point
ANZ-Roy Morgan Consumer Confidence in April the news hasn’t been so good –
(index, monthly) from an above average reading of 123.2 on
160 the ANZ-Roy Morgan measure, confidence
has now dropped to just 113.9, the lowest
140
level in four years.
120
Given that mortgage rates are still low,
100 as is the unemployment rate, confidence
in reality probably hasn’t been hit as hard
80
as this latest reading would imply. This
60 suggests that a bounce-back is entirely
possible in the next few months. That
40
said, the drop can’t be ignored either and
20 will need to be watched as we move into
2020 – reduced consumer spending, for
0
2004 2007 2010 2013 2016 2019 example, would significantly undermine
economic growth.
10 Sources: ANZ, Roy MorganEmployment
Annual change in employment, Labour force participation rate (%)
full time and part time
10% 72
8%
70
6%
68
4%
2% 66
0% 64
-2 %
62
-4 %
Full time 60
-6 %
Part time
-8 % 58
1987 1998 2009 1986 1997 2008 2019
Unemployment Rate (%)
12
10
8
6
4
2
0
1986 1997 2008 2019
Employment continues to rise, up by 1.4% in the year to June 2019. Even so, from a peak of 6.0% growth in the
year to December 2016, the latest figure represents a pretty chunky slowdown. However, this shouldn’t be of too much
concern. For a start, full-time employment is still rising more strongly (2.7% annually), with the overall weakness entirely
reflecting a 3.6% fall in part-time employment. That’s not a bad thing, as it typically involves people switching into
full-time roles, rather than becoming jobless.
Indeed, the unemployment rate fell further in the June quarter, dropping to 3.9% – the first time below 4.0% since
mid-2008. Participation in the labour force is also very high, at more than 70% (participation is the share of working age
people who are either employed or unemployed/looking for work). Taking a step back, it’s also important to note that,
with employment already high, the pace of growth was bound to slow at some point.
So the bottom line is that the labour market remains healthy and, hence, supportive for the property market. On a
list of key risks to any housing market, mortgage repayment problems and forced/mortgagee sales always ranks high.
But the strength of our labour market at present means this no concern.
Source: CoreLogic 11Interest Rates
Mortgage Interest Rates (%) The hints dropped by the Reserve Bank
25 at the late June official cash rate (OCR)
review that they were looking to cut at
the August meeting duly came to fruition.
20
But expectations for a 0.25% cut were too
cautious – in the event, the OCR was cut
15 from 1.5% to 1.0%, the first change (in
either direction) of more than 0.25%
since a 0.5% cut in March 2011 (driven
10
by the need to bolster confidence in the
wake of the Christchurch earthquakes).
5
The most recent decision in late September
was then for no change to the OCR, but
0
1965 1971 1977 1983 1989 1995 2001 2007 2013 2019
most commentary is focussed on a further
cut to 0.75% on 13th November. The
statement alongside the September
Official Cash Rate and Mortgage Rates (%) decision also hinted that the RBNZ
12 believes the Government also needs to
come to the party and boost spending.
10
Clearly, in this environment, mortgage
rates are set to stay lower for longer –
8
especially given that competition in the
banking sector remains strong. However,
6 from April next year it looks likely that
banks will need to start increasing the
4 capital buffers on their balance sheets,
which could manifest in some sort of
2 increases in mortgage rates – maybe 0.5%
to 1.0%. That’s not a huge rise, from an
0 already low base, but would still be a test
2000 2009 2018 for some borrowers, who have only ever
known falling rates.
Average Two Year Fixed Rates (%)
All up, however, we expect mortgage rates
5.2% to stay pretty favourable for borrowers and
5.0% this will underpin decent levels of sales
activity and gradual rises in national
4.8%
average prices.
4.6%
4.4%
4.2%
4.0%
3.8%
12 Sources: Reserve Bank of New Zealand and interest.co.nzHousing Overview
13Lending conditions
Annual Change in Gross New The strong upswing in mortgage lending
Lending Flows ($m per month) activity that was seen from early 2018
1,500
through to early 2019 has just shown
a few signs of running out of steam since
1,000
February. Indeed, in three of the past six
500 months, lending activity has been lower
than a year earlier, including in August
0
when it was down by $16m. To be fair, this
-500 shouldn’t be of too much concern just yet
-1,000 – after all, July’s result was up a by a robust
Investor $387m annually, so August’s result
-1,500
Owner-occupier was probably a bit of ‘payback’
-2,000 for prior strength.
-2,500
By borrower type, owner-occupiers remain
2016 2017 2018 2019
keen (first home buyers in particular),
High LVR Lending to Owners and Investors having now increased activity year-on-year
(% of new lending) for 17 consecutive months. That’s been
driven mostly by larger average loan sizes
25%
than more loans. By contrast, investors
have decreased their borrowing on an
20% annual basis for each of the past 12
Owner occupier speed limit (20% ) months. It’s always hard to be sure if
weaker activity has been driven by
15%
investors not actually wanting to borrow
more (demand factors), or the banks
10% getting tougher (supply factors) –
and often, it’s a bit of both.
5%
Investor speed limit (5%) In this case, however, we suspect the tight
speed limit for high loan-to-value lending
0% for investors is playing the key role in the
Oct 16 Feb 17 Jun 17 Oct 17 Feb 18 Jun 18 Oct 18 Feb 19 Jun 19 slowdown (remember that only 5% of
investor lending can be to borrowers with
Refinancing Profile for Mortgages
less than a 30% deposit). By contrast, 20%
(% of stock) of owner-occupier loans can be at less than
40% a 20% deposit. There may be light at the
end of the tunnel for investors, however,
35%
should the RBNZ decide to loosen the LVR
30% speed limits as part of the Financial Stability
Report on 27th November – potentially
25%
raising the 5% cap to 10%.
20%
Our hunch is that mortgage market activity
15% will slowly edge higher in 2020, as those
10% potential LVR changes filter through, and a
boost comes from the recent loosening of
5%
the banks’ internal serviceability testing
0% (i.e. rather than testing affordability at a
theoretical interest rate of 7-8%, now
it’s below 7%).
14 Sources: Reserve Bank of New ZealandSales Volumes
Nationwide Sales Volumes Nationwide Annual Change
(monthly total) in Sales Volumes (%)
14,000
13,000
12,000 40%
11,000
10,000 20%
9,000
8,000
7,000 0%
6,000
5,000 -20%
4,000
3,000
2,000 -40%
1,000
1997 2000 2003 2006 2009 2012 2015 2018 1997 2000 2003 2006 2009 2012 2015 2018
Regional Sales Volumes
(year-on-year % change)
10%
8%
6%
4%
2%
2.7% 10.8% 7.2% 0.5%
0%
-0.4% -5.7% -1.2%
-2%
-4%
-6%
NZ AUK HAM TAU WEL CHC DUN
There were 6,737 property sales across NZ in September, down by 2.2% from the same month a year ago. However,
taking a three-month total (which smooths a bit of the monthly variability), sales were unchanged from a year earlier.
Put another way, there’s certainly been evidence in the past 1-2 months that the falls in market activity levels have come
to an end.
Over the three months to September, activity in Christchurch and Dunedin was broadly flat on an annual basis, but
Hamilton and Tauranga showed solid increases. Auckland also recorded growth in activity. Wellington’s figure was a bit
weaker, down by 6% annually. This may just be a temporary blip in Wellington, but could also indicate that the concerns
about apartment insurance are starting to bite a little.
As we move further through Spring and into Summer sales volumes will improve in line with their normal seasonal
pattern, but it’ll be interesting to see how large the rise will be – after all, listings are still restricted in many parts of
the country, so that lack of stock actually available to buy could be a hindrance for sales. Of course, a lack of stock
will support values.
Source: CoreLogic 15Listings
New listings (Three-week rolling total)
Rest of NZ
1,800 Auckland
1,500
1,200
900
600
300
0 Year Ago
May 15 May 16 May 17 May 18 May 19
The seasonal lull for listings over winter has now passed and we’re well into the spring increase. Even so, in
a number of areas of the country, new listings are running lower than a year ago, including Auckland, Waikato,
and Wellington. Anecdotally, one reason for this is that some potential sellers are not confident of finding their
next purchase, so are choosing to stay where they are – creating a vicious circle. However, this can change
quite quickly, as we’ve seen in Otago, where new listings are running comfortably higher than a year ago.
Average last 1 month 1 year
New Listings
3 weeks change change
New Zealand 2,036 12% -9%
Auckland 541 8% -22%
Waikato 213 3% -13%
Bay of Plenty 171 13% 7%
Wellington 141 11% -30%
Canterbury 361 20% 0%
Otago 137 11% 23%
16Listings
Total Listings
Auckland (RHS)
35,000 Rest of NZ
10,000
30,000
25,000 8,000
20,000 6,000
15,000
4,000
10,000
2,000
5,000
0 Year Ago 0
Sep 14 Sep 15 Sep 16 Sep 17 Sep 18 Sep 19
The relative lack of new listings (combined with a regular flow of sales volumes) is meaning that total listings are also sliding
– lower than a year ago nationally, and in Auckland (admittedly from a high base), Bay of Plenty, Wellington, and Canterbury.
Waikato’s total listings have edged higher over the past year.
But again, Otago is the area of interest when it comes to listings, and the total available stock on the market is higher than
a year ago. Of course, here are no surprises here – given strong price growth, you’d naturally expect a supply response at
some stage, as more sellers come forward to test the market.
1 month 1 year
New Listings Latest week
change change
New Zealand 24,584 0% -9%
Auckland 8,000 -4% -15%
Waikato 2,779 1% 2%
Bay of Plenty 1,813 0% -5%
Wellington 975 0% -25%
Canterbury 4,154 7% -3%
Otago 1,106 0% 18%
17Nationwide Values
Average Value of Housing Stock - New Zealand ($)
$700,000
$600,000
$500,000
$400,000
$300,000
$200,000
$691,460
$100,000
$0
2004 2007 2010 2013 2016 2019
Annual and Quarterly Change in Value (%)
20% Quarterly Change $4,439 0.6%
Annual Change $16,362 2.4%
Since Peak Change $277,866 67%
15%
10%
5%
0%
-5%
Annual Change %
-10% Quarterly Change %
2005 2007 2009 2011 2013 2015 2017 2019
National average property values rose by 2.4% in the year to September 2019, representing a small
improvement from the low point of 2.0% in June. Even so, growth hasn’t been below 3% for such an
extended period of time as it is now since 2011.
Of course, even though the pace of growth has slowed, average property values are still rising. The average
is now $691,460, up by more than $16,000 from a year ago and more than $215,000 from five years ago.
18House Price Index
Average Dwelling Value ($) Dunedin remains the most buoyant of the main
centres, with average property values rising by
New Zealand 12.8% in the year to September, equivalent to
$1,000,000 Auckland $53,575. Demand in Dunedin remains strong,
Hamilton
Tauranga and listings are still low (albeit gradually rising),
$800,000 Wellington so anything that comes on to the market is snapped
Christchurch up pretty quickly, and at an elevated price. A similar
Dunedin
pattern applies in Wellington, where values are up
$600,000
by 7.4% over the past year – although note that
Wellington City is showing signs of flattening, with
$400,000 overall growth driven by Porirua and the Hutt Valley.
$200,000
$0
2007 2009 2011 2013 2015 2017 2019
Elsewhere, Tauranga and Hamilton have also eased in the past few months, although growth in average property values is
still above the national average in both cities. The stragglers amongst the main centres are still Christchurch and Auckland.
Indeed, due to plenty of choice for buyers, Christchurch values have actually dipped by 0.5% since June and are only up by
0.7% annually. Auckland has been stable since June, but the demand/supply balance there is also favourable for buyers, and
values are down by 1.9% annually.
SEPTEMBER 2019
Current Value 3 months 12 months Since peak
New Zealand $691,460 0.6% 2.4% 67%
Auckland $1,027,392 0.0% -1.9% 89%
Hamilton $590,500 0.9% 3.2% 63%
Tauranga $747,493 0.5% 5.4% 55%
Wellington $715,740 0.8% 7.4% 57%
Christchurch $497,290 -0.5% 0.7% 31%
Dunedin $473,702 2.9% 12.8% 66%
Source: CoreLogic NZ QV Monthly House Price Index
19House Price Index
Annual Value Change (%)
-9% 21%
© 2019 Mapbox © OpenStreetMap
The recent falls (or at best stability) in average property values in and around
Auckland can be clearly seen on a map view of the market, as well as the
sluggishness of Canterbury. By contrast, pockets of strength can be seen around
the central and lower North Island, as well as in Otago (Dunedin) and Southland.
20 *Size of bubble represents the number of properties in the Territorial AuthorityThree Month Value Change (%) -2% 5% © 2019 Mapbox © OpenStreetMap Focusing in a shorter three-month period, trends in average property values across NZ look broadly similar to the 12-month map, however there have recently been some pockets of weakness (blue shading) emerge around Waikato and the Bay of Plenty. *Size of bubble represents the number of properties in the Territorial Authority 21
Rent
     National Annual Change                                        Gross Rental Yield –
     in Value and Rent (%)                                         National (%)
     25%                                                           6%

     20%
                                                                   5%

     15%
                                                                   4%
     10%

      5%                                                           3%

      0%
                                                                   2%
      -5 %
                                                                   1%
     -10%

     -15%                                                          0%
         1998   2001   2004   2007    2010   2013   2016    2019     1998   2001     2004   2007    2010   2013     2016   2019

     National rents averaged $431 per week in the three months to September 2019, up by 5.1% compared
     with the same quarter a year ago ($410). Having climbed to an annual increase of 6.3% in April, the pace
     of rental growth has cooled over the past 4-5 months.

     Many of the areas that have had strong rises in property values are also seeing pretty rapid rental growth
     – indicating a high underlying level of demand for property (regardless of tenure). This includes several parts
     of the central and lower North Island (e.g. Wanganui, Masterton, Tararua, South Wairarapa), as well as pockets
     of the South Island (e.g. Nelson, Invercargill).

     In the main centres, rental growth has generally been a bit more subdued (e.g. 2.8% annually in Auckland
     and 3.5% in Christchurch), although Wellington City is still buoyant, with rents up by a rapid 11.5% from a year
     ago. That said, property value growth has also generally cooled, so gross yields have edged higher in most of
     the main centres. The only exception is Dunedin, where yields have dropped from 4.2% this time last year
     to 4.0%.

     Looking ahead, rental growth is likely to continue to tick along at about 5% annually (across NZ as a whole).
     On one hand, landlords are facing higher costs from new regulations such as increased insulation standards
     and tax ring-fencing for losses – and they’ll obviously be looking to recoup this in higher rents where possible.
     But in the long-run it’s been shown that rents are anchored by what tenants can afford to pay, itself a function
     of wage growth – which is set to stay relatively subdued.

                                                            Median                    Annual
                                                                                                           Gross Yield
                                                           Weekly Rent             Change in Rent
     Auckland                                                  $525                    2.8%                       2.7%

     Hamilton                                                  $389                    5.3%                       3.4%

     Tauranga                                                  $478                    5.4%                       3.3%

     Wellington                                                $495                    11.5%                      3.1%

     Christchurch                                              $349                    3.5%                       3.6%

     Dunedin                                                   $368                    8.0%                       4.0%

22   Sources: CoreLogic NZ and MBIE
Buyer Classification
Buyer Classification – NZ Property Transfers by Non-Citizens
New Zealand (% of sales) or no Resident Visa (% of total transfers)
3.5%
30%
30% 26%
3.0%
26%
25%
21% 24% 2.5%
20% Mover
First Home Buyer 2.0%
Multiple Property Owner Mortgage
Multiple Property Owner Cash
New to Market
ReEntry 12% 1.5%
Other
10% 10% 1.0%
5% 5%
4% 0.5%
2%
4%
0%
0.0%
2005 2007 2009 2011 2013 2015 2017 2019 2016 Q4 2017 Q2 2017 Q4 2018 Q2 2018 Q4 2019 Q2
Source: Statistics New Zealand
The Buyer Classification series has shown a changing market over the past few months, with first home buyers (FHBs)
holding their ground in terms of market share, but investors (multiple property owners/MPOs) really now starting to
emerge again from their lull. Movers (i.e. existing owner-occupiers who are relocating) are less active in terms of their
% share of property purchases than has typically been the case in the past.
Across NZ as a whole, movers accounted for 26% of property purchases in the third quarter of the year, the lowest level
for about a decade. As noted in the ‘Listings’ section above, some would-be movers are not confident of finding the next
house that they like, so are choosing to stay put – and perhaps renovate instead. Meanwhile, others will have been forced
to stay where they are due to already-high debt levels.
FHB’s accounted for 24% of purchases in Q3, a market share they’ve held for more than a year now. KiwiSaver withdrawals
are helping to give some FHBs an advantage over other buyer groups in terms of raising the deposit, as well as
compromising on the location and/or property type.
The key point of interest in the past three months, however, has been the bounce-back of mortgaged investors. Their
market share was 25% in Q3, the highest figure since late 2016, when the third round of LVR changes required them to
raise a 40% deposit. Moreover, this isn’t just about mortgaged investors ‘hanging on’ better than other buyer groups in
a subdued market – the number of purchases they’ve made has also risen. One explanation for the strong performance
on this measure, but weak lending flows reported by the RBNZ, is that investors are still using mortgage finance (and still
making a good number of property purchases) but also choosing to put up more of their own capital – perhaps to reduce
the required mortgage payment and keep the sums stacking up in light of the extra costs that the government has imposed
(such as insulation standards).
That also makes sense when you consider the reduced incentive to have money invested in other assets, e.g. term deposits
that have seen their interest rates cut sharply in recent months.
In terms of foreign buyers, the latest Stats NZ figures show that last October’s ban is doing what the government wanted,
with property purchases in NZ by people without citizenship/residency running at low levels. The purchases that are being
made will be via the exemptions for Australians and Singaporeans (as well as other nationalities buying apartments in
large developments).
23Main Cities Housing
Market Indicators
2425
Auckland Market Activity
     Buyer Classification –                                                 Market activity levels in Auckland are
     Auckland (% of purchases)                                              relatively quiet at present, with listings still
                                                                            above normal (albeit at their lowest level
                                                                            for a couple of years) and buyers in a
     30%
           28%                                                        28%   cautious mood.
           27%                                                        27%
           27%                                                              The careful mood of buyers is no better
     20%
                                                                      22%   illustrated than by the movers category.
            Mover
            Multiple Property Owner Mortgage                                Over the September quarter, they
            Multiple Property Owner Cash
            First Home Buyer                                                accounted for just 22% of purchases in
            New to Market
            Other                                                     12%
                                                                            Auckland, the lowest since the first quarter
     10%    ReEntry                                                         of 2009 (i.e. more than a decade ago). In
           7%                                                          5%   some cases, already-high debt levels will be
           4%                                                          4%
                                                                            forcing existing owners to stay where they
      0%                                                               2%
                                                                            are, and perhaps renovate rather than
           2005    2007      2009     2011     2013   2015   2017   2019
                                                                            relocate. In other cases, we’re also hearing
                                                                            that owner-occupiers are choosing to stay
                                                                            where they are, due to a lack of confidence
     Buyer Classification – MPO purchases                                   about the quality of properties on the
     by size (% of purchases by no. of                                      market and doubts that they’ll secure
     properties now owned)                                                  the next house that they really want.

     16%    MPO 2             MPO 10+                                       However, first home buyers (FHBs) have
     14%
            MPO 3-4           New to Area                                   kept a stronger presence in the market,
            MPO 5-9           New MPO
                                                                      12%   raising their market share of purchases
     12% 12%                                                                from 26% in Q2 to 27% in Q3, up from 25%
                                                                      10%   a year ago and actually the highest figure
     10%
           9%                                                               for any quarter since Q3 2007. A willingness
     8%                                                                     to move further afield (and access property
                                                                      7%
                                                                      6%    with lower prices) has been a key factor for
     6% 6%
                                                                            FHBs staying in the market over the past
     4% 4%                                                                  few years – e.g. in Ranui, FHBs accounted
                                               2%                           for 51% of all purchases in Q3, having paid
     2% 2%                                     2%
        2%                                                                  an average price of about $703,000 (versus
     0%
                                                                            Auckland average value of $1.03m).
         2005 2007 2009 2011 2013 2015 2017 2019

     The point of most interest in Q3 was the rise in market share for mortgaged investors from 25% in Q2 to 28%
     - the highest level in two years. Given falling values in many parts of Auckland, it looks pretty clear that some
     investors are sensing their opportunity to bag a bargain. Indeed, when you add the cash purchases to
     mortgaged, the key group across all investors has been the smaller players – i.e. MPO 2’s, who have
     raised their market share to 12%.

26
Auckland Values
Average value of housing stock – Annual and quarterly value change –
Auckland ($) Auckland (%)
$1,100,000
25% Quarterly Change $279 0.0%
$1,000,000
Annual Change -$20,143 -1.9%
$900,000 20% Since Peak Change $482,674 89%
$800,000
15%
$700,000
$600,000 10%
$500,000 5%
$400,000
$300,000
$1,027,392 0%
$200,000 -5%
$100,000 Annual Change %
-10% Quarterly Change %
$0
2004 2007 2010 2013 2016 2019 2005 2007 2009 2011 2013 2015 2017 2019
Overall Auckland property values have fallen by 1.9% over the year to September, although they have been flat since June
and actually edged up by 0.2% from August to September. The overall stability over the past three months has been the
balance of different trends by area – e.g. Papakura is down by 1.8% since June, but Manukau, Rodney, North Shore, Franklin,
and Waitakere have been more stable, while Auckland City has bounced by 0.6% in the past three months.
On an annual basis, North Shore has been the weakest part of Auckland (-3.5%), with Auckland City, Waitakere, Manukau,
and Rodney all seeing falls of around 1-2%. Papakura has been pretty much flat year-on-year (despite the weakness of the
most recent three months), as has Franklin. The latter two areas are still the cheapest, so with affordability better, it’s no
surprise that they they’ve held up the best.
SEPTEMBER 2019
Current Value 3 months 12 months Since peak
Rodney $941,180 -0.3% -0.9% 60%
North Shore $1,173,529 -0.3% -3.5% 82%
Waitakere $813,055 -0.1% -1.4% 92%
Auckland City $1,215,401 0.6% -1.5% 95%
Manukau $886,133 -0.4% -1.3% 94%
Papakura $696,914 -1.8% -0.4% 94%
Franklin $671,280 -0.2% 0.2% 70%
27Auckland Suburb Value Change
Annual value change (%)
Riverhead
Huapai
Waimauku
Muriwai
Kumeu
Whenuapai
Chatswood
Waitakere
Swanson
Henderson Valley
Mount Welli
Oratia Hillsborough
Waiatarua
Titirangi
Piha
Laingholm
Mangere
Huia
Wi
Manukau Heads
© 2019 Mapbox © OpenStreetMap
28-5.0% 5.0%
Surfdale Waiheke Island
Omiha
Maraetai
Beachlands
ington
Kawakawa Bay
The suburb map for Auckland doesn’t make
great reading for home-owners at present, with
Flat Bush the vast majority of suburbs having seen some
Clevedon sort of fall in median property values over the
Orere Point
past year. The only suburbs with stable values
iri are to the south (and a few out west), while there
are only a small handful that have seen values
increase over the past year – including Favona,
Mangere Bridge, Mangere East, and Otahuhu.
Wattle Downs *Size of bubble represents the
number of properties in the suburb.
Rosehill Red Hill Based on CoreLogic Median E-valuer.
29Current Auckland Suburb Values
Auckland suburb values 2019 ($)
Property value trends across the country have become a bit patchier over the past year or so, with many
areas still rising, but some flattening off, and some falling. CoreLogic’s interactive ‘Mapping the Market’
product (www.corelogic.co.nz/mapping-market) shows these changes across the country, it’s freely
available and updated quarterly. The heatmaps in ‘Mapping the Market’ are point-in-time snapshots of
median values from 2018 and 2019, and now show the % and $ change over that period too.
Auckland is illustrated in the heatmap here. The range of median values across Auckland starts at the top in
Herne Bay ($2.49m) and goes down to Orere Point ($529k). Herne Bay might well be the most expensive part
of Auckland, but it has also suffered a sharp fall over the past year, of 7.8%, or about $210,000. By contrast,
areas such as Favona, Mangere Bridge, Mangere East, and Clover Park have all seen values rise by 2-3%.
30 *Based on CoreLogic Median E-valuer31
Hamilton Market Activity
     Buyer Classification –                                             The breakdown of buyer activity in
     Hamilton (% of purchases)                                          Hamilton is looking pretty similar to
                                                                        Auckland at present. First, movers are
     40%                                                                cautious, only accounting for 21% of
                                                                33%     purchases in Q3 – that’s pretty much the
           31%                                                          lowest on record, only sitting above Q1
     30%
           27%                                                          2009’s figure of 20%. Meanwhile, first
           25%                                                   27%    home buyers (FHBs) are keeping a strong
            Mover
     20%    First Home Buyer
                                                                        presence in the market, accounting for 27%
                                                                 21%
            Multiple Property Owner Cash                                of purchases in Q3. That’s basically as high
            Multiple Property Owner Mortgage
            New to Market                                               as ever before. Nawton has been a key
     10%    ReEntry                                                     suburb for FHBs in 2019 – they’ve had a
            Other                                               11%
        7%                                                        4%
                                                                        market share there of 45%, with an average
        4%                                                        3%    price paid of $483,529.
     0% 3%                                                        2%
           2005   2007    2009    2011    2013   2015   2017   2019
                                                                        For mortgaged investors in Hamilton, the
                                                                        market share spiked up to 33% in Q3 – well
     Buyer Classification – MPO purchases                               above Q2’s figure of 27%, and the highest
                                                                        since the final quarter of 2016. As has been
     by size (% of purchases by no. of
                                                                        the case in many other parts of the country,
     properties already owned)                                          the rebound in interest from investors has
                                                                        mostly come from the smaller players, MPO
     16%     MPO 2          New to Area
             MPO 3-4        New MPO                                     2’s and MPO 3-4, i.e. those with their own
     14%     MPO 5-9                                                    house and 1-3 rentals. The confidence
             MPO 10+
     12%                                                                boost from the scrapping of the capital
           11%                                                    11%
                                                                  11%   gains tax proposals has probably been a
     10% 10%
                                                                        factor here, as well as low returns on other
     8%                                                           8%    assets (e.g. term deposits), as well as rising
                                                                  8%
                                                                        rents and yields on rental property.
     6% 6%

     4% 4%                                                        4%
        3%
                                                                  3%
     2%
     0% 1%
         2005 2007 2009 2011 2013 2015 2017 2019

32
Hamilton Values
Average value of housing stock – Annual and quarterly value change –
Hamilton ($) Hamilton (%)
$600,000 Quarterly Change $5,236 0.9%
30% Annual Change $18,331 3.2%
Since Peak Change $228,994 63%
$500,000 25%
20%
$400,000
15%
$300,000 10%
5%
$200,000 $590,500 0%
$100,000 -5%
Annual Change %
-10% Quarterly Change %
$0
2004 2007 2010 2013 2016 2019 2005 2007 2009 2011 2013 2015 2017 2019
Hamilton’s average property value rose by 0.9% in the three months to September 2019, with the increase over 12 months
coming in at 3.2%.
Hamilton South East and South West have been the strongest parts of the city since June, with Central & North West, and
North East a bit softer. These broad patterns hold over the past 12 months too, with South East the strongest (rise of 6.0%),
and North East the most sluggish (1.0%). North East has the highest prices, suggesting the least affordability, so that would
be a reason for more subdued growth lately.
SEPTEMBER 2019
Current Value 3 months 12 months Since peak
Hamilton Central
$541,968 0.4% 3.0% 51%
& North West
Hamilton North East $736,354 0.6% 1.0% 64%
Hamilton South East $546,079 1.3% 6.0% 56%
Hamilton South West $528,032 1.4% 4.0% 54%
33Tauranga Market Activity
Buyer Classification – Tauranga’s buyer composition remains
Tauranga (% of purchases) quite a bit different to many other parts
of the country. For example, mortgaged
First Home Buyer
Multiple Property Owner Mortgage multiple property owners have yet to show
40% Multiple Property Owner Cash
Mover the same rebound that has been seen in
New to Market
33% ReEntry other areas in the past 3-6 months – in
Other
30% 32% Tauranga, their share was only 24% in Q3.
Meanwhile, low affordability (compared to
24%
other areas) makes it harder for first home
23%
20% buyers too, and they only accounted for
20%
16%
20% of purchases in Q3.
15% 14%
10% The flipside is that the share of purchases
6%
4% 5% going to movers in Tauranga is higher than
4%
3% 2% elsewhere. They accounted for 32% of
0%
2005 2007 2009 2011 2013 2015 2017 2019 activity in Q3, versus 26% nationally. This
highlights how having a strong amount of
wealth/equity already in place matters quite
Buyer Classification – MPO purchases
a bit in Tauranga, rather than necessarily
by size (% of purchases by no. of being able to base a property choice on
properties already owned) local wages.
MPO 2 MPO 10+
14% MPO 3-4 New to Area
MPO 5-9 New MPO
12% 12% 12%
11%
10%
9%
9%
8%
6%
6% 6%
4% 4%
3%
2% 3%
1%
0% 1%
2005 2007 2009 2011 2013 2015 2017 2019
34Tauranga Values
Average value of housing stock – Annual and quarterly value change –
Tauranga ($) Tauranga (%)
30% Quarterly Change $3,515 0.5%
$700,000 Annual Change $38,154 5.4%
25% Since Peak Change $266,012 55%
$600,000 20%
$500,000 15%
$400,000 10%
5%
$300,000
$200,000
$747,493 0%
-5%
$100,000 Annual Change %
-10%
Quarterly Change %
$0
2004 2007 2010 2013 2016 2019 2005 2007 2009 2011 2013 2015 2017 2019
Average property values in Tauranga rose by 0.6% in September, taking the three month change to 0.5% (offsetting some
weakness in July and August), with the annual change coming in at 5.4%. Three years ago, property values were rising at an
annual pace of almost 30%, so there’s clearly been a big slowdown since then, but the latest figure (5.4%) was still up from
the lull of around 1% this time last year.
Average property values in Tauranga are now $747,493, up by $103,196 from three years ago and $295,268 from five
years ago.
35Wellington Market Activity
Buyer Classification – First home buyers remain a key driver of
Wellington (% of purchases) activity across the wider Wellington market,
accounting for 31% of purchases in Q3 –
Lower Hutt exceeded that average (34%), as
31%
30% did Porirua (32%), but Wellington City (28%)
28% 27%
27% was more subdued for FHBs. Movers are
27% also generally pretty quiet.
First Home Buyer 23%
20% Mover As with other parts of the country,
Multiple Property Owner Cash mortgaged multiple property owners
Multiple Property Owner Mortgage
New to Market (investors) were of key interest around
ReEntry the Wellington area in Q3, with their share
10% Other 8%
8% of purchases rising to 27%, up from 25%
5% earlier in the year. Wellington City itself
4%
3% 4% has been a key factor here, with mortgaged
3% 2%
0%
investors accounting for 31% of purchases
2005 2007 2009 2011 2013 2015 2017 2019
in Q3, the highest figure since Q3 2016.
Continued rental growth in the capital may
Buyer Classification – MPO purchases well be enticing a few investors to increase
by size (% of purchases by no. of their portfolios.
properties already owned)
Across all investors combined (mortgage
MPO 2 MPO 10+ and cash), the rebound lately across wider
14%
MPO 3-4 New to Area Wellington has reflected growth from
MPO 5-9 New MPO 12%
12% smaller players, especially MPO 2’s, who
11% had a market share of 12% in Q3, the
10% 10% 9% highest for about seven years.
8%
6% 5%
5%
4% 4% 4%
3% 4%
3%
2% 2%
0%
2005 2007 2009 2011 2013 2015 2017 2019
36Wellington Values
Average value of housing stock – Annual and quarterly value change –
Wellington ($) Wellington (%)
$700,000
Quarterly Change $5,937 0.8%
Annual Change $49,269 7.4%
$600,000 20% Since Peak Change $260,212 57%
$500,000 15%
$400,000 10%
$300,000 5%
$200,000
$715,740 0%
$100,000 -5%
Annual Change %
$0 -10% Quarterly Change %
2004 2007 2010 2013 2016 2019 2005 2007 2009 2011 2013 2015 2017 2019
Across wider Wellington (City, Porirua, Upper Hutt, Lower Hutt), average property values have risen by 0.8% over the past
three months, and by 7.4% annually. That continues a pretty consistent year so far – annual growth has hovered around
7-8% for much of 2019 (and a good chunk of 2018 too). By sub-area, Wellington City has cooled a bit recently, Porirua is still
rising consistently, but it’s the Hutt Valley that is outperforming – Upper Hutt values are up by 15% annually, and Lower Hutt
by 13%.
Elsewhere around the Wellington Region, Carterton, Masterton, and South Wairarapa are still recording double-digit annual
growth in property values, and although Kapiti Coast is a bit further back, the property market there is still pretty solid too
(8.5% annual rise in average values in year to September).
SEPTEMBER 2019
Current Value 3 months 12 months Since peak
Porirua $611,562 2.2% 8.9% 60%
Upper Hutt $574,557 2.1% 15.3% 63%
Lower Hutt $607,896 1.9% 13.2% 55%
Wellington City $827,436 0.0% 4.1% 55%
Carterton $440,187 1.5% 15.8% 58%
Masterton $397,141 3.1% 11.5% 39%
South Wairarapa $537,873 6.6% 11.3% 59%
Kapiti Coast $612,870 1.9% 8.5% 60%
37Christchurch Market Activity
Buyer Classification – Christchurch has also experienced the
Christchurch (% of purchases) bounce-back in activity from mortgaged
multiple property owners (MPOs/investors)
40% in the past few months, which has come at
the expense of movers and, to a lesser
33% extent, first home buyers.
30%
26% After troughing at 21% in the first three
24% 25% months of the year, mortgaged investors
23% 24%
First Home Buyer accounted for 25% of purchases in
20% New to Market
Multiple Property Owner Cash Christchurch in the three months to
Multiple Property Owner Mortgage
Mover September – the highest for more than
ReEntry
Other 13% two years. When you also add the cash
10%
8% 6% investors to the mix, we again see that the
4% 5% rise in activity has been driven by smaller
4%
0% 2% players, with between one and three rental
2005 2007 2009 2011 2013 2015 2017 2019 properties (after their latest purchase) –
i.e. MPO 2’s and MPO 3-4.
Buyer Classification – MPO purchases
Meanwhile, movers’ share of purchases
by size (% of purchases by no. of
has eased back down from 27% in the first
properties already owned) three months of the year to 24% now. And
the market share for FHBs in Christchurch
16% MPO 2 New to Area
MPO 3-4 New MPO is currently 26%, still an impressive figure
MPO 5-9
14% by past standards, but nevertheless still
MPO 10+
down from 29% a year ago. Flat house
12% 12%
11% prices in the city for a number of years
10%
10% now have given time for FHBs to raise
9% larger deposits and keep their market
8%
7% share elevated.
6% 6%
By contrast to Christchurch, the Selwyn
4% 4%
3% 4% district is dominated by movers, who raised
2% 2% their share of purchases from 35% in Q2 to
1% 1%
0% 42% in Q3 (versus 20% for FHBs and 18%
2005 2007 2009 2011 2013 2015 2017 2019 for mortgaged MPOs). Waimakariri also has
a high share for movers (43%), and less
presence for FHBs (21%) and mortgaged
MPOs (16%).
38Greater Christchurch Values
Average value of housing stock – Annual and quarterly value change –
Christchurch ($) Christchurch (%)
$500,000 Quarterly Change -$2,644 -0.5%
35% Annual Change $3,368 0.7%
30% Since Peak Change $117,886 31%
$400,000
25%
20%
$300,000
15%
10%
$200,000
$497,290 5%
0%
$100,000
-5% Annual Change %
$0 -10% Quarterly Change %
2004 2007 2010 2013 2016 2019 2005 2007 2009 2011 2013 2015 2017 2019
The Christchurch market continues to creep along, with average property values actually falling by 0.5% since June, but
they’re still up a little on an annual basis (0.7%). Only Christchurch East has avoided a dip in values since June, and it’s also
the strongest sub-market over the past year, with a gain of 1.3%. The lower level of prices in that area is probably helping it
to stay a bit more buoyant.
Selwyn and Waimakariri remain pretty flat too, with values basically unchanged in both areas since June. Waimakariri has
recorded a gain on an annual basis, but 1.2% is hardly an overwhelming increase.
SEPTEMBER 2019
Current Value 3 months 12 months Since peak
Banks Peninsula $518,563 -0.7% 0.4% 8%
Christchurch Central & North $581,984 -1.3% 0.2% 31%
Christchurch East $378,332 0.1% 1.3% 22%
Christchurch Hills $676,698 -0.3% 0.6% 22%
Christchurch Southwest $473,674 -0.2% 0.6% 40%
Selwyn $556,189 -0.1% 0.2% 49%
Waimakariri $451,150 0.1% 1.2% 41%
39Dunedin Market Activity
Buyer Classification – Movers are still a key buyer group in
Dunedin (% of purchases) Dunedin, accounting for 27% of purchases
in Q3 2019, albeit down from 28% in the
previous three months. First home buyers
30% 29%
27% have also lost market share in recent
29%
24% months, falling from 25% of purchases
in Q2 to 22% in Q3.
20% 22%
20%
Mover
Multiple Property Owner Cash
By contrast, mortgaged multiple property
Multiple Property Owner Mortgage
First Home Buyer 13% owners (investors) had a 24% market share
New to Market
ReEntry in Q3, up from 22% earlier in the year. Cash
10% Other
investors have also come back strongly in
8%
6% 6% Dunedin, up from a market share of 9% in
5%
4% early 2019 to 13% now. Continued growth
0% 2% in property values will no doubt be enticing
2005 2007 2009 2011 2013 2015 2017 2019 some investors, as will higher gross rental
yields (about 4.0%) than the other main
Buyer Classification – MPO purchases centres. The key segment has been MPO
2’s, or investors with their own property
by size (% of purchases by no. of
and one rental.
properties already owned)
14% MPO 2 MPO 10+
MPO 3-4 New to Area
13%
MPO 5-9 New MPO
12% 12%
10%
9%
8%
8%
6%
6% 6%
4% 5%
4% 4%
3%
3%
2% 2%
0%
2005 2007 2009 2011 2013 2015 2017 2019
40Dunedin Values
Average value of housing stock – Annual and quarterly value change –
Dunedin ($) Dunedin (%)
35% Quarterly Change $13,254 2.9%
30% Annual Change $53,575 12.8%
Since Peak Change $187,486 66%
$400,000 25%
20%
$300,000 15%
10%
$200,000
$473,702
5%
0%
$100,000
-5%
Annual Change %
-10% Quarterly Change %
$0
2004 2007 2010 2013 2016 2019 2005 2007 2009 2011 2013 2015 2017 2019
Average property values across Dunedin have risen by another 2.9% since June and are up by 12.8% annually. Growth is
broad-based across the city, with even the slowest sub-area (Dunedin Central & North) still recording a double-digit gain
in average property values in the year to September.
SEPTEMBER 2019
Current Value 3 months 12 months Since peak
Dunedin Central & North $487,675 2.4% 10.0% 62%
Dunedin South $458,864 3.8% 15.0% 61%
Peninsula and Coastal $433,217 4.4% 15.0% 60%
Taieri $490,069 2.2% 12.0% 67%
41CoreLogic Data and Analytics
Suburb Scorecard Buyer Classification
Detailed housing market indicators down A unique and flagship product to CoreLogic,
to the suburb level, with data in time series Buyer Classification classifies all purchases into
or snapshot and segmented in most cases types of buyer based on their current ownership of
across houses, flats and apartments. The Suburb NZ property. Used at a record level by Government
Scorecard data includes key housing market metrics organisations to assist policy decisions.
such as median prices, median values, transaction
volumes, rental statistics and vendor metrics such To view the latest report online and subscribe to
as median selling time. receive it in your inbox on a monthly basis, visit:
www.corelogic.co.nz/property-market-and-
economic-update-report
Market Share Reports
CoreLogic is in a unique position to monitor If you would like to know more or obtain tailored
mortgage related housing market activity. data, analytics and insights for your business,
Transaction volumes, dwelling values and mortgage please email us at reports@corelogic.co.nz.
related valuation events all comprise our Mortgage
market report which provides an invaluable tool for
mortgage industry benchmarking and strategy.
CoreLogic Indices
The suite of CoreLogic Indices range from simple
market measurements such as median prices
through to our flagship house price indices –
both quarterly for completeness and monthly for
reactiveness. The Quarterly CoreLogic House Price
Index has been specifically designed to track the
value of a portfolio of properties over time and is
relied upon by New Zealand regulators and industry
as the most accurate measurement of housing
market performance.
Sales Volumes
CoreLogic tracks sales from a number of different
sources to provide up to date insights on recent
sale. Where applicable CoreLogic also applies
estimation for expected final sales in recent
months where not all sales have been collected.
.
42Legal Disclaimer
Copyright Data & Research publications
This publication reproduces materials and content Whilst all reasonable effort is made to ensure
owned or licenced by RP Data Pty Ltd trading as CoreLogic the information in this publication is current, CoreLogic
Asia Pacific (CoreLogic) and may include data, statistics, does not warrant the accuracy, currency or completeness
estimates, indices, photographs, maps, tools, calculators of the Data and commentary contained in this publication
(including their outputs), commentary, reports and other and to the full extent not prohibited by law excludes all loss
information (CoreLogic Data). or damage arising in connection with the Data and
commentary contained in this publication.
© Copyright 2019. CoreLogic and its licensors are
the sole and exclusive owners of all rights, title and interest You acknowledge and agree that CoreLogic does not
(including intellectual property rights) the CoreLogic Data provide any investment, legal, financial or taxation advice
contained in this publication. All rights reserved. as to the suitability of any property and this publication
should not be relied upon in lieu of appropriate
professional advice.
Published date: Quarter 3, 2019
43You can also read