SURREY HOUSING PROFILE - UPDATED DECEMBER 2018 - City of Surrey
←
→
Page content transcription
If your browser does not render page correctly, please read the page content below
SURREY
HOUSING
PROFILE
UPDATED DECEMBER 2018
                        the future lives here.
2 Surrey Housing Profile
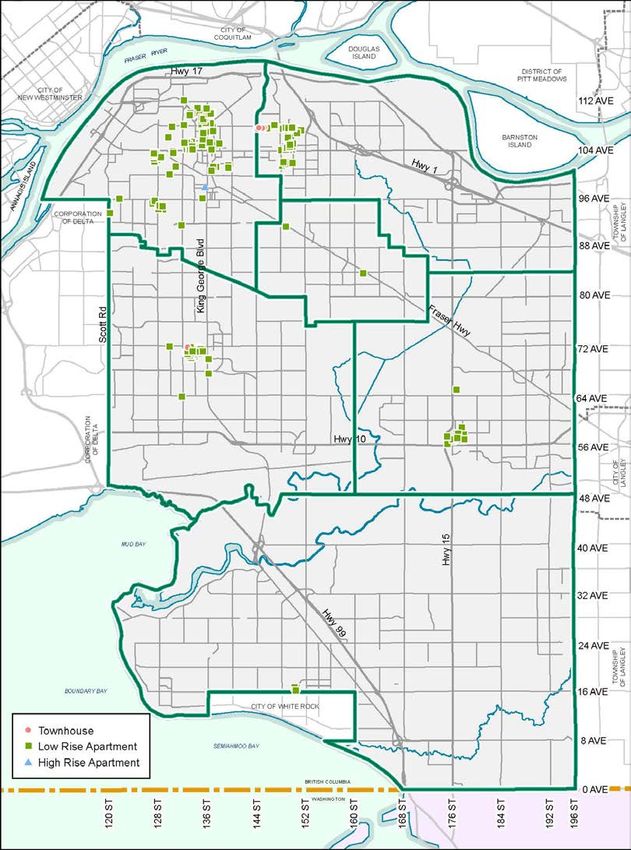
Table of Contents

Executive Summary....................................................................................................5
PART I: BACKGROUND................................................................................................8
          A. Housing in the Regional Context ....................................................................... 8
          B. The Housing Continuum.................................................................................... 8
          C. Defining Affordable Housing ............................................................................. 9
PART II: HOUSING STOCK ......................................................................................... 11
          Data Sources ........................................................................................................ 11
          A. Housing Inventory ........................................................................................... 12
               Housing Stock by Structure Type ............................................................... 12
               Housing Stock by Structure Type & Neighbourhood ................................. 13
               Housing Stock by Tenure ............................................................................ 13
               Non-resident Ownership ............................................................................ 16
               Age of Housing Stock.................................................................................. 18
          B. New Housing Units .......................................................................................... 19
          C. Loss of Housing Stock ...................................................................................... 20
          D. Estimates of Future Housing Demand ............................................................ 20
          E. Manufactured Homes ..................................................................................... 21
PART III: RENTAL STOCK ........................................................................................... 23
          A. Market Rental Stock ........................................................................................ 23
               Market Rental by Structure Type ............................................................... 23
               Purpose-built Rental Stock ......................................................................... 24
               Secondary Suites ........................................................................................ 27
               Condominium Apartment Rentals ............................................................. 29
          B. Non-market Social Housing ............................................................................. 30
               Inventory of Social Housing........................................................................ 30
               Rental Supplements ................................................................................... 30
               Construction Period of Social Housing Units.............................................. 31
          C. Rents and Vacancy Rates ................................................................................ 33
          D. Rental Health: Canadian Rental Housing Index .............................................. 35
PART IV: AFFORDABILITY – RENTERS ........................................................................ 36
          A. Income in Surrey ............................................................................................. 36
                Income Distribution for All Households ..................................................... 36
                Income and Tenure .................................................................................... 36
                Income and Household Type...................................................................... 38
                Low Income Households ............................................................................ 38

                                                                                 Surrey Housing Profile (Updated 2018)               1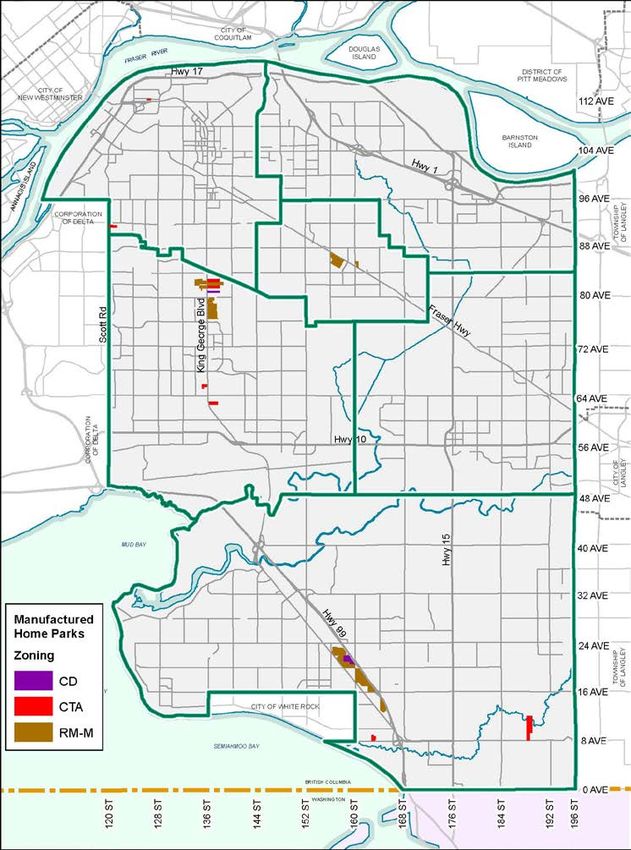
Income by Community ............................................................................... 38
                                 Low income Neighbourhoods .................................................................... 39
                        B. Renter Characteristics ..................................................................................... 41
                             Renter Households in Surrey...................................................................... 41
                             Overcrowding ............................................................................................. 41
                        C. Housing Need .................................................................................................. 42
                             Core Housing Need..................................................................................... 42
                             Social Housing Waitlists ............................................................................. 43
                             Expiring Social Housing Agreements .......................................................... 44
                             Homelessness ............................................................................................. 45
                             Ability of Renters to Afford Rents .............................................................. 45
              PART V: AFFORDABILITY – HOME OWNERSHIP.......................................................... 47
                          Housing Price Index .................................................................................... 47
              PART VI: RELATED PLANS, POLICIES, and REGULATIONS ........................................... 48
                        A. Plans ................................................................................................................ 48
                              Master Plan for Housing the Homeless in Surrey (2013) ........................... 48
                              Surrey Affordable Housing Strategy: A Focus On Rental Housing (2018) .. 48
                              Other City Plans .......................................................................................... 48
                        B. Policies ............................................................................................................ 49
                        C. Regulations...................................................................................................... 51
                        APPENDIX 1: Surrey’s Population......................................................................... 52
                             Population Structure by Age ...................................................................... 52
                             Household Size Characteristics .................................................................. 53
                             Vulnerable Populations .............................................................................. 53

2   Surrey Housing Profile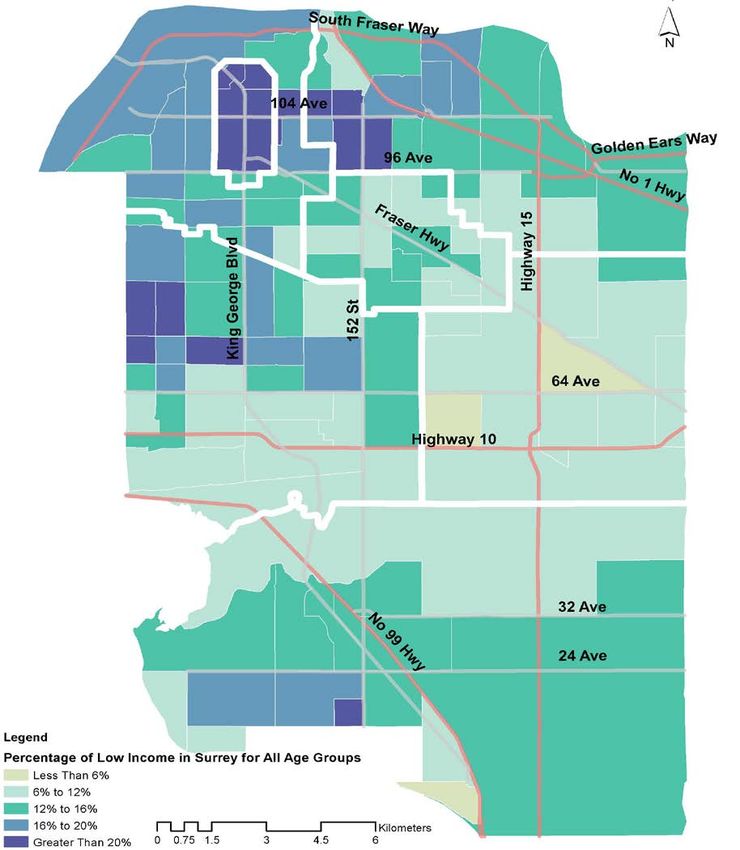
List of Tables
Table 1 - Number of Dwelling Units by Structural Type & Neighbourhood (2017) .............. 13
Table 2 – Average Age of Residential Buildings by Community (2017) ................................ 18
Table 3 - Estimates of Future Housing Demand in Surrey (2016 – 2026) ............................. 20
Table 4 - Estimated Market Rental Units in Surrey by Structural Type (2018) ..................... 23
Table 5 - Purpose-built Market Rental Units in Surrey (2018) .............................................. 24
Table 6 - Purpose-built Market Rental Units in Surrey by Community (2018) ..................... 24
Table 7 – Purpose-built Rental by Bedroom Type, Metro Vancouver and Surrey (2018) .... 24
Table 8 - Known Suites by Building Permit Status (2018) ..................................................... 27
Table 9 - Number of Social Housing Units in Surrey (2018) .................................................. 30
Table 10 – Number of Rent Supplements in Surrey, 2018.................................................... 30
Table 11 - Average Market Rents and Vacancy Rates, Primary Rental Market (2018) ......... 33
Table 12 - BC Municipalities, Top 10 Most Critical Scores (2016)......................................... 35
Table 13 - Median Household Income in Surrey by Tenure (2015) ...................................... 36
Table 14 - Median Income in Surrey by Household Type (2015) .......................................... 38
Table 15 - Median Income by Surrey Community (2016) ..................................................... 38
Table 16 – Low Income by Surrey Community (2016) .......................................................... 39
Table 17 - Renter Households in Surrey (2016) .................................................................... 41
Table 18 – Renter Households in Core Housing Need (2016) ............................................... 42
Table 19 – Core Housing Need by Household Type (2016)................................................... 42
Table 20 - Homeless Count by Municipality (2017) .............................................................. 45
Table 21 - Income and Rent Payments for Very Low and Low Income Households............. 45
Table 22 - City Policies Affecting Affordable Housing ........................................................... 49
Table 23 - City Regulations Affecting Affordable Housing .................................................... 51

                                                       List of Figures
Figure 1 - Model of the Housing Continuum........................................................................... 8
Figure 2 - Number of Units by Housing Type for Surrey (2012-2022) .................................. 12
Figure 3 - Housing Tenure in Metro Vancouver (2016) ......................................................... 14
Figure 4 - Housing Tenure in Surrey by Neighbourhood (2016) ........................................... 15
Figure 5 - Non-Resident Ownership by Property Type, Surrey (2017).................................. 16
Figure 6 – Proportion of Residential Properties Owned by Non-Residents by Period of
Construction (1960 or earlier – 2017) ................................................................................... 17
Figure 7 - Period of Construction of Surrey Residential Units (1900s – 2017) ..................... 18
Figure 8 – Estimated and Projected Units Added, by Housing Type (2012 - 2022) .............. 19
Figure 9 - Locations of Manufactured Homes in Surrey (2018) ............................................ 22
Figure 10 - Construction of Purpose-Built Market Rentals (1900s – 2018) .......................... 25
Figure 11 - Locations of Purpose-built Market Rental Stock in Surrey (2018) ...................... 26
Figure 12 - Locations of Known Secondary Suites in Surrey (2018) ...................................... 28
Figure 13 - Number of Rented Condo Apartments in Surrey by Community (2016)............ 29
Figure 14 - Number of Rented Condo Apartments in Surrey by Period of Construction
(2016) .................................................................................................................................... 29
Figure 15 - Construction of Social Housing Units in Surrey by Type (Pre-1960 – 2018) ....... 31

                                                                                       Surrey Housing Profile (Updated 2018)                     3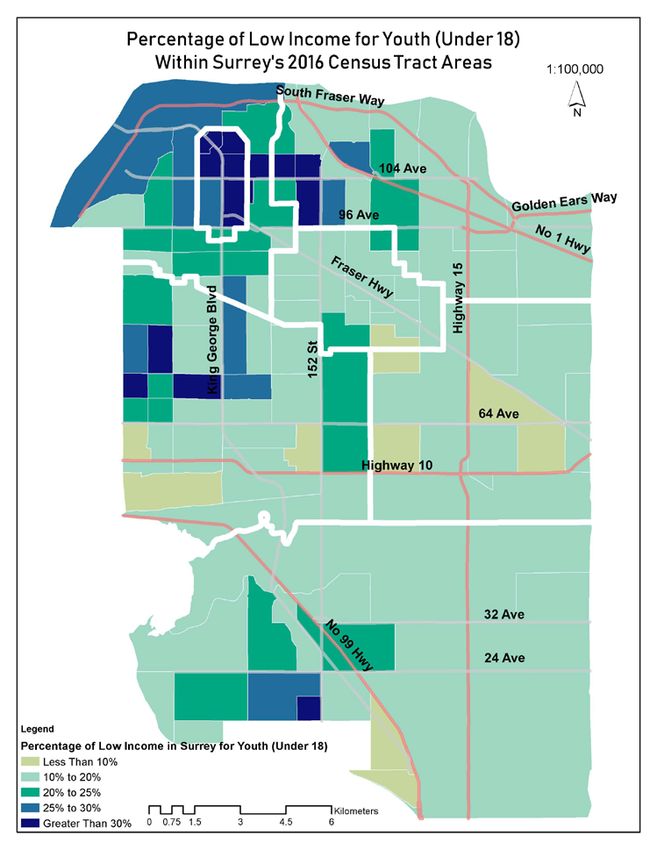
Figure 16 - Locations of Social Housing in Surrey (2018) ...................................................... 32
              Figure 17 - Average Purpose-Built Apartment Rents, Surrey & Metro Vancouver (2009 –
              2018) ..................................................................................................................................... 33
              Figure 18 - Regional Comparison of Vacancy Rates for Private Apartments (2009 – 2018). 34
              Figure 19 – Share of Total Households by Income Groups for Surrey (2015)....................... 36
              Figure 20 - Median Household Income for Renter Households, Metro Vancouver
              Subregions (2015) ................................................................................................................. 37
              Figure 21 – Percentage of People Living in Low Income (All Ages) (2016) ........................... 40
              Figure 22 - Households on BC Housing Waitlist by Household Type, Surrey (2010 – 2018) 43
              Figure 23 – Housing Prices in Surrey (June 2009- June 2018)............................................... 47
              Figure 24 - Share of Population by Age (1996 to 2016) ........................................................ 52
              Figure 25 - Household Size by Surrey Community (2016)..................................................... 53
              Figure 26 - Vulnerable Populations and Low Income Status By Percentage (2016) ............. 54
              Figure 27 – Number of Children and Youth 17 Years and Younger in Low Income (2016) .. 55
              Figure 28 – Average Annual Growth Rate (2011 - 2016) ...................................................... 56
              Figure 29 - Home Ownership Rates, Indigenous and Non-Indigenous Households (2016) .. 57
              Figure 30 - Immigrants as Percentage of Surrey’s Population (2001 – 2011)....................... 58

4   Surrey Housing Profile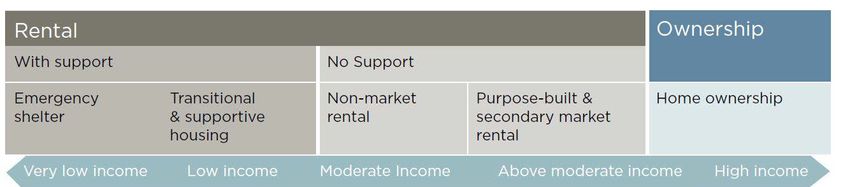
EXECUTIVE SUMMARY
The Surrey Housing Profile compiles available data related to housing stock, housing need
and City polices and practices. The Housing Profile was developed to inform the Surrey
Affordable Housing Strategy in 2018, released in April 2018. Some of the data has been
updated in this 2019 version.

Key findings:

   •   Ownership is the predominant form of tenure
       In 2016, 71% of Surrey households were owners compared to 29% renters. This is
       higher than the Metro Vancouver region, where 64% of households were owners.

   •   Single family dwellings dominate but the proportion of multi-family units is
       increasing
       Approximately 45% of residential units in the City are one and two family
       dwellings, while approximately 40% are multi-family dwellings (townhouses and
       apartments). Secondary suites and coach houses make up approximately 15% of
       the total stock (2018).
       In 2017, approximately 76% of new units added were multi-family units, while 13%
       were single family. It is projected that multi-family dwelling units will increase from
       40% in 2017 to 43% by 2022.

   •   Entry-level homeownership has become unaffordable for many in Surrey
       Housing prices have risen dramatically in Surrey and across the region since 2015.
       The benchmark price for single family dwellings was $1,121,500 in 2018. Semi-
       detached houses and apartment prices have also increased, rising to $606,400 and
       $473,900 respectively in 2018.

   •   Many Surrey renters are living in unaffordable and crowded housing
       Renter household median incomes are considerably lower than owner household
       incomes ($47,965 compared to $92,614 in 2016). Despite relatively lower rents in
       Surrey compared to the rest of Metro Vancouver, 34% of renters in Surrey were in
       core housing need in 2016. Surrey’s overcrowding rate for renter households, at
       18%, is higher than the regional average of 12% (2016).

   •   Pressures on renter households are increasing
       As in the rest of the region, rents in Surrey are increasing and vacancy rates
       decreasing. Average rents for purpose-built apartments increased from $804 in
       2009 to $1079 in 2018. The vacancy rate in Surrey is 0.4% (2017). Surrey’s vacancy
       rate has been dropping rapidly since 2012 and is now lower than the regional
       average of 1.0%.

                                                         Surrey Housing Profile (Updated 2018)   5
• Secondary suites are an important part of Surrey’s rental stock
The majority of Surrey’s rental stock is secondary suites (at least 66%). Secondary
suites generally provide lower rents than other rental stock, and are an important
source of rental units in Surrey. However, security of tenure can be a challenge for
secondary suites as house owners may choose to discontinue renting. As well,
secondary suites may also be less appropriate for some populations.
• The City’s stock of purpose-built market rental is small
There are approximately 5,700 units of purpose-built rental in Surrey, apartments
and townhouses. The majority of these are low rise apartments built in the 1970’s.
This represents 14% of Surrey’s rental stock, much lower than in Metro Vancouver
where purpose-built market rental represents approximately 1/3 of the total rental
stock. Most of the City’s purpose-built units can be found in Whalley and Guilford.
Prior to 2016, the city had not seen any new purpose-built market rental
development since the 1990s. Two new purpose-built market rental buildings have
opened since 2016; at the end of 2018 there were approximately 1100 market
rental units under construction or in development.
• Condo rentals are an important, but more expensive, source of rental housing
Condominiums rented out by the owner comprise approximately 18% of the City’s
rental units. Rented condos generally have higher rents and provide less security of
tenure.
• Social housing is an important source of housing for low income residents
Surrey currently has approximately 5,190 non-market social housing units. The
majority of these units are in co-ops and low income non-profit housing facilities
and are intended for those who are able to live independently.
• Many rental households are families with children
Households with children comprise at least 38% of renter households in Surrey
(2016). These households require family-sized units.
• More rental housing is needed
Metro Vancouver estimates demand for a total of 11,500 new rental units in
Surrey over the next ten years:
o Very low income rental demand: 4,290 units
o Low income rental demand: 2,600 units
o Moderate income rental demand: 2,200 units
o Above moderate rental demand: 1,200 units
o High income rental demand: 1,100 units
6 Surrey Housing Profile• Non-market social housing is a critical component of projected rental need
Indicators such as core housing need, long waits for social housing, homelessness
and overcrowding demonstrate that the market is unaffordable for many renter
households. An estimated 6,890 rental units are needed for very low and low
income households over the next ten years. Particular populations will likely have
higher needs with respect to non-market rental housing.
Surrey Housing Profile (Updated 2018) 7PART I: BACKGROUND
The Surrey Housing Profile serves as a background document that informed the
development of the Surrey Affordable Housing Strategy (2018), as well as the ongoing
implementation of the Strategy. Some of the data in the profile was updated in this revised
2019 version.
A. HOUSING IN THE REGIONAL CONTEXT
Metro Vancouver is a federation comprised of 21 municipalities, 1 treaty First Nation, and
1 Electoral District. The region shares an economy and a housing market. Housing costs are
rising across the region. Housing affordability is particularly a challenge for low and
moderate income renters.
Metro Vancouver adopted a new Regional Affordable Housing Strategy (RAHS) in May
2016, to provide leadership on regional housing needs and advance the complete
community goals of Metro 2040, the regional growth strategy. The Regional Affordable
Housing Strategy provides a vision, as well as shared goals, strategies and actions for
tackling housing affordability. The RAHS establishes affordable housing targets for the
region and for individual municipalities.
B. THE HOUSING CONTINUUM
The Housing Continuum documents housing types, tenures, and presence of support
services. It also reflects affordability levels for a range of incomes.
Figure 1 - Model of the Housing Continuum
Source: Metro Vancouver Regional Affordable Housing Strategy 2016
8 Surrey Housing ProfileC. DEFINING AFFORDABLE HOUSING
Housing affordability relates the cost of housing to income. Affordability challenges are
most often related to low to moderate income households who may not be able to find
affordable rental housing in the market. Some example definitions of affordable housing
are included below.
Canada’s National Housing Strategy
• Affordable housing requirements for the National Housing Co-Investment Fund:
30% of units must have rents at less than 80% of median market rents, for a
minimum of 20 years.
Canadian Mortgage and Housing Corporation
• Affordable housing costs less than 30% of before-tax household income. Shelter
costs include the following:
o For renters: rent and any payments for electricity, fuel, water and other
municipal services;
o For owners: mortgage payments (principal and interest), property taxes,
and any condominium fees, along with payments for electricity, fuel, water
and other municipal services.
• Source: cmhc.beyond2020.com/HiCODefinitions_EN.html#_Housing_Standards
Government of BC
• Many organizations, programs and even mortgage lenders consider housing
affordable if it costs no more than 30% of household income before taxes. This
measure is a useful tool that can be used when choosing a place to live, but
housing affordability is often based on a combination of factors, and every
situation is different. Here are some examples:
o The type, age and condition of a home influences costs like heating,
electricity, water, sewage, insurance, maintenance, property taxes, and
strata fees.
o The location of a home determines transportation expenses like riding the
bus or driving a car.
o A person's financial status and stage of life controls how much is
affordable for them. Everyone’s monthly budget is different and personal
preferences, priorities, and family needs much be considered.
• Source: www2.gov.bc.ca/gov/content/housing-tenancy/local-
governments/defining-affordable-housing
Metro Vancouver
• Housing is considered affordable when monthly housing costs (rent or mortgage
payments including property taxes, strata fees, and heating costs) consume less
than 30% of before tax (gross) household income. Housing affordability concerns
are invariably associated with households with low and moderate incomes as they
cannot afford market rates.
Surrey Housing Profile (Updated 2018) 9• Source: Metro Vancouver, Regional Affordable Housing Strategy (2016)
City of New Westminster
• Affordable housing is homeownership and rental housing for low and moderate
income households that does not cost a household more than 30 percent of its
gross income (before-tax).
• Source: City of New Westminster, Affordable Housing Strategy (2010)
City of North Vancouver
• Affordable is defined as housing costs which do not exceed 30% of gross income
for residents whose incomes are below Housing Income Limits set by BC Housing in
conjunction with CMHC for specific unit sizes.
• Affordable Housing means housing which is affordable to households of low and
moderate incomes, targeted to those whose incomes and family sizes meet the
income thresholds set by BC Housing / CMHC for Lower Mainland
• Affordability Gap is the different between what people on low or fixed incomes
receive and the maximum income limits established by BCH.
• Source: City of North Vancouver, Definition of Affordability (2012)
City of Vancouver
• Housing is considered to be affordable when it comprises 30% or less of a
household’s total income before taxes. This is particularly relevant for low- and
moderate-income household whose household expenses take a higher overall
share of their monthly budgets, whereas higher-income households may be able to
absorb higher housing costs.
• Source: Housing Vancouver Strategy (2017)
10 Surrey Housing ProfileDATA SOURCES
This document compiles housing-related data from a variety of sources, including Statistics Canada,
Canada Mortgage and Housing Corporation (CMHC), Metro Vancouver and the City of Surrey’s Planning
and Development Department. In general, information on Surrey’s housing stock uses City of Surrey
and Metro Vancouver housing data. Demographic information is based on 2016 Census data.
Exceptions to this are noted.
Surrey maintains a GIS building inventory that is built on a combination of data sources including: BC
Assessment Authority data; Surrey Building Permit information; Surrey secondary suite data; GIS
Orthophoto imagery; and Surrey GIS Cadastre (lot and address) information. A key component of this
inventory is up-to-date information on Surrey’s existing housing stock.
Surrey’s estimate of residential units includes attribute information that allow staff to estimate and
map the number of units by type (including market and non-market rental units) and year of
construction as well as residential unit counts for any geography within the city at the lot level.
Comparative analysis yields differences between Surrey’s building inventory and census housing
information.
At the time of the 2016 Census, Statistics Canada accounted for 181,159 occupied/unoccupied private
dwellings in Surrey compared to the City of Surrey’s 2015 end-of-year estimate of 184,208 units. Based
on the latest Census information, derived estimates from both the City and Statistics Canada are
similar. This adds a level of confidence to the City’s estimates. While both estimates aim to account for
all residential units, Surrey’s estimate is slightly higher than the Statistics Canada figure which suggests
that it is likely that the census missed a small percent of multifamily and single family structures.
Surrey’s estimate takes into consideration all existing residential structures (updated monthly with new
construction and demolitions) that provide a more accurate estimate of residential structures and their
units.
Some data may be updated in the report on an ongoing basis, as new data is released from government
and other sources.
Surrey Housing Profile (Updated 2018) 11PART II: HOUSING STOCK
A. HOUSING INVENTORY
Housing Stock by Structure Type
As of September 2018, there were approximately 191,791 residential units, including legal
and known secondary suites, in Surrey. Of these, approximately 45% are one and two
family dwellings. Multi-family dwellings comprise approximately 40% of the stock, while
coach houses and secondary suites represent 15% 1.
It is estimated that approximately 20,683 units will be added in the next five years, for a
total of approximately 212,474 dwelling units projected for 2022.
It is projected that by 2022, the proportion of one and two family dwellings will decline
slightly from 45% to 42% while multi-family dwellings will increase from 40% to 43%.
Figure 2 - Number of Units by Housing Type for Surrey (2012-2022)
Source: City of Surrey Planning and Development Department, September 2018
1 Percentages of one and two family dwellings include mobile homes and duplexes. Multiple family dwellings
include townhouse or row house, and apartments.
12 Surrey Housing ProfileHousing Stock by Structure Type & Neighbourhood
Table 1 - Number of Dwelling Units by Structural Type & Neighbourhood (2017)
Cloverdale Fleetwood Guildford Newton South Surrey Whalley Surrey Total
Residential Type # of % of # of % of # of % of # of % of # of % of # of % of # of % of
Units Total Units Total Units Total Units Total Units Total Units Total Units Total
Total 26,502 100% 20,439 100% 21,672 100% 46,212 100% 36,985 100% 38,301 100% 191,791 100%
Dwelling Units Within
Single Family
Structures (including 15,837 60% 14,708 72% 11,956 55% 30,131 65% 18,807 51% 20,908 55% 112,347 59%
Secondary Suites and
Coach Houses)
Manufactured Home 0 0% 261 1% 3 0% 901 2% 1,188 3% 100 0% 2,453 1%
Two Family
531 2% 128 1% 321 1% 391 1% 884 2% 866 2% 3,121 2%
Dwelling/Duplex
Townhouse/Rowhouse 6,743 25% 4,163 20% 3,712 17% 10,060 22% 9,252 25% 3,179 8% 37,109 19%
Low Rise Apartment 3,391 13% 1,179 6% 5,605 26% 4,729 10% 6,854 19% 8,495 22% 30,253 16%
High Rise Apartment 0 0% 0 0% 576 3% 0 0% 0 0% 5,932 15% 6,508 3%
Source: City of Surrey Planning and Development Department, September 2018
Surrey’s six communities have varying proportions of its dwelling units in single family
structures, from a high of 72% in Fleetwood to a low of 51% in South Surrey (2017).
Only 3% of dwelling units, in Surrey are in high rise apartments; these are found only in
Whalley and Guilford 2. Approximately 16% of dwelling units are in low rise apartment
buildings. The highest proportions of low rise apartments are found in Whalley (22%) and
Guildford (26%). Fleetwood has the lowest proportion of low rise apartments, at 6%.
Surrey’s communities have similar proportions of their housing stock in townhouses (17%
to 25%), with the exception of Whalley which only has 8% of its dwelling units in
townhouses/rowhouses.
Definitions: Tenure, Dwelling type and Household
• Tenure refers to whether some member of the household owns or rents the dwelling, or whether the
dwelling is band housing (on an Indian reserve or settlement).
• Private dwelling refers to a separate set of living quarters with a private entrance from outside or from a
common hall, lobby, vestibule or stairway inside the building. The entrance to the dwelling must one that
can be used without passing through the living quarters of someone else.
• Collective dwelling refers to a dwelling which has a commercial, institutional or communal nature (e.g.
lodging or rooming houses, hotels, motels, tourist homes, nursing homes, hospitals, staff residences,
group homes).
• Household refers to a person or a group of persons (other than foreign residents) who occupy the same
dwelling. It may consist of a family group (census family) with or without other persons, of two or more
families sharing a dwelling, of a group of unrelated persons, or of one person living alone. Unless
otherwise specified, household data refers to private households only, and not to collective households. In
the 2011 Census, the number of households equals the number of occupied dwellings.
(Statistics Canada definitions)
2 In this report, a ‘high rise apartment’ refers to an apartment building that is five storeys or taller and a ‘low
rise apartment’ refers to an apartment building with one to four storeys.
Surrey Housing Profile (Updated 2018) 13Housing Stock by Tenure
Figure 3 - Housing Tenure in Metro Vancouver (2016)
Source: 2016 Census, Statistics Canada
Surrey has a high level of home ownership (71%), compared to rental (29%). As shown in
the figure above, Surrey’s rate of homeownership is higher than the Metro Vancouver
average of 64% ownership. Ownership rates are decreasing slightly in Surrey (from 73% in
2011 to 71% in 2016) and regionally from 65% to 64%.
14 Surrey Housing ProfileFigure 4 - Housing Tenure in Surrey by Neighbourhood (2016)
Source: 2016 Census, Statistics Canada
South Surrey has the highest rate of ownership rates at 83%. The highest proportions of
renter households are in Whalley (44%), Newton (31%) and Guildford (30%). Renters make
up 57% of households in City Centre. (Note – City Centre is the downtown area within
Whalley).
Surrey Housing Profile (Updated 2018) 15Non-resident Ownership
Figure 5 - Non-Resident Ownership by Property Type, Surrey (2017) 3
Source: Statistics Canada, Canadian Housing Statistics Program, CANSIM Table 034-0005.
2.9% of all properties in Surrey are owned by non-residents. This is lower than the Metro
Vancouver average of 4.8% for all property types. Condominiums have higher levels of
non-resident ownership. In Surrey, 4.8% of condominiums are owned by non-residents,
compared to the Metro Vancouver average of 7.9%.
3 Statistics Canada / CMHC definitions:
• ‘Non-resident’ refers to an owner(s) whose principal dwelling is outside the economic territory of
Canada. Note that this definition is irrespective of the owner’s citizenship. Therefore, a Canadian
citizen whose principal residence is outside of Canada would be considered a non-resident owner.
• ‘Property with multiple residential units’ refers to a property containing more than one set of living
quarters owned by the same owner (s), as is the case for an apartment building or duplex.
16 Surrey Housing ProfileFigure 6 – Proportion of Residential Properties Owned by Non-Residents
by Period of Construction (1960 or earlier – 2017) 4
Source: Statistics Canada, Canadian Housing Statistics Program, CANSIM Table 035-0003
Looking at non-resident ownership by period of construction, Surrey’s proportion of non-
resident ownership has increasing since the 1960’s. As well, since 2006 the rate of
nonresident ownership in Surrey has remained relatively steady, hovering between 6 – 7%.
In contrast, rates of non-resident ownership have been increasing more rapidly since 2006
in Metro Vancouver, jumping from 6.9% in 2006 to 12.0% in 2017. In the City of Vancouver
this trend is more pronounced, rising from 9.4% in 2006 to 15.5% in 2017.
4Period of construction refers to the period during which the residential structure was originally constructed
(when the structure was completed).
Surrey Housing Profile (Updated 2018) 17Age of Housing Stock
Table 2 – Average Age of Residential Buildings by Community (2017)
Average Age of Building
Community
(Years)
Surrey 27
Cloverdale 21
Fleetwood 26
Guildford 30
Newton 23
South Surrey 26
Whalley 37
Source: City of Surrey Planning and Development Department, September 2018
The average age of existing buildings in Surrey in 2017 was 27 years. Dwellings in Whalley
have the oldest average, followed by dwellings in Guildford. Cloverdale has the lowest
average age of dwellings among Surrey’s communities.
Figure 7 - Period of Construction of Surrey Residential Units (1900s – 2017)
Source: BC Assessment Authority, City of Surrey Planning Department, September 2018
Note: the number of dwellings and buildings constructed in the last time period is for a six-year period from
2011 to 2017 inclusive, as opposed to a ten-year time period.
18 Surrey Housing ProfileB. NEW HOUSING UNITS
It is expected that the multi-family housing market will continue to gain momentum in
Surrey. For example, in 2017 approximately 76% of housing starts in Surrey were multi-
family.
With an expectation that townhouses and apartments will dominate the yearly number of
housing starts, the five year average of multi-family starts is projected to be 70 – 75% of
total new units.
Figure 8 – Estimated and Projected Units Added, by Housing Type (2012 - 2022) 5
Source: City of Surrey Planning and Development Department, September 2018
5 2017 – 2021 data is projected.
Surrey Housing Profile (Updated 2018) 19C. LOSS OF HOUSING STOCK
At this time there do not appear to be significant issues in terms of the loss of housing
stock in Surrey. While there is increasing pressure for redevelopment of lands occupied by
older single-family detached houses in some of Surrey’s more established neighbourhoods,
most such redevelopment resulted in new single-family homes. In 2017, 639 single family
and 20 two family dwellings that were demolished. As well, redevelopment of
manufactured home parks is occurring. Surrey lost 38 units of manufactured homes in
2018. With a number of active applications for redevelopment of manufactured home
parks, the number of manufactured homes is expected to decrease further in 2019.
D. ESTIMATES OF FUTURE HOUSING DEMAND
Table 3 - Estimates of Future Housing Demand in Surrey (2016 – 2026)
Housing Demand 10-Year Estimate
Ownership Demand 35,500
Rental Demand 11,500
Very Low Income Rental Demand – affordable to 4,290
households with incomes of less than $35,000 / year
Low Income Rental Demand – affordable to households 2,600
with incomes between $35,000 - $60,000 / year
Moderate Income Rental Demand – affordable to 2,200
households with incomes between $60,000 - $85,000 /
year
Above Moderate Income Rental Demand – affordable to 1,200
households with incomes $85,000 - $110,000 / year
High Income Rental Demand – affordable to households 1,100
with incomes above $110,000 / year
Total Demand 47,000
Source: Metro Vancouver, Regional Affordable Housing Strategy (2016) 6
Based on regional population and household projections, it is estimated that there will be a
demand for 47,000 new housing units in Surrey by 2026. Based on past trends,
approximately 3,550 households a year will be able to buy a new home. Rental housing
demand is estimated at 1,150 new units each year over the next ten years. Of these rental
units, approximately 60% are estimated to be for very low and low income households, or
about 700 units per year.
6 Metro Vancouver has prepared updated housing demand estimates for the period 2016 –2026 in consultation
with municipalities using recent Census data and a cohort survival model. Estimates assume that household
income and household type ratios remain constant over the projection period. In 2017, revisions were made to
income thresholds, based on the 2016 Median Regional Household Income.
20 Surrey Housing ProfileE. MANUFACTURED HOMES
Approximately 2,500 7 of the dwelling units in Surrey were manufactured homes or trailers
as of December 2017.
Although manufactured homes account for only approximately 1% of Surrey’s dwelling
units, they provide housing to approximately 6450 residents and represent an important
form of affordable housing that is starting to come under pressure for redevelopment.
In Surrey, manufactured homes or trailers had an average price of $166,150 8 and an
average pad rental of $740 (MLS Listings December 2017).
Of the manufactured homes in Surrey:
• Approximately 1,800 units were on properties in the “Manufactured Home
Residential Zone (RM-M)”. Of these, approximately 550 are strata tenure where
the pads are owned by the manufactured home owner, and the remainder are on
rented pads;
• Approximately 470 manufactured homes were on properties zoned “Tourist
Accommodation Zone (CTA)” where all of the pads are rented; and
• The approximately 150 remaining manufactured homes were located in
comprehensive development zones with nearly all having fee simple or strata
tenure.
While the CTA Zone only permits tourist accommodation “for no more than 182 days in a
12-month period” or camps-sites or tourist trailer parks where “recreational vehicles for
transient use” may be parked, it would appear that a number of these have transitioned to
permanent accommodation.
7The number of manufactured homes is based on estimates of permanent manufactured homes in manufactured
home parks and trailer parks (irrespective of zoning), and not all trailer parks and camp grounds. There is evidence
that some trailers located in CTA (Tourist Accommodation) zones are being used as permanent housing; these
numbers are not included in this data.
8 Includes listings for manufactured homes on rented pads, as well as those with strata and freehold tenure.
Surrey Housing Profile (Updated 2018) 21Figure 9 - Locations of Manufactured Homes in Surrey (2018)
Source: City of Surrey Planning and Development Department, December 2018
Note the map shows only those manufactured home parks and trailer parks where there is evidence of
permanent manufactured homes (irrespective of zoning), and not all trailer parks and camp grounds.
22 Surrey Housing ProfilePART III: RENTAL STOCK
A. MARKET RENTAL STOCK
Market Rental by Structure Type
There are over 42,000 private market rental units in Surrey. The majority of Surrey’s
market rental units are secondary suites. Primary market rentals in apartment buildings or
townhouse complexes are those where the building (or all units) are owned by a single
landlord.
Table 4 - Estimated Market Rental Units in Surrey by Structural Type (2018) 9
# of units % of total
Primary Market
Townhouses 93 0%
Low rise apartments 5,339 13%
High rise apartments 282 1%
Secondary Market
Coach houses 986 2%
Secondary suites 27,684 66%
Condominium apartments rented out by owners 7,795 18%
Total 42,179 100%
Source: City of Surrey Planning and Development Department, December 2018 and Statistics Canada, 2016
Census
Rental Sector: Definitions, Affordability and Security of Tenure
Rental housing can be distinguished between primary and secondary market rentals. The primary rental market
is comprised of purpose-built market housing that was built originally as rental projects. The secondary rental
market includes secondary suites as well as condominiums, townhouses, duplexes and single or semi-detached
residential homes that are rented out by the owner.
There are typically key differences between these in terms of affordability and security of tenure:
Purpose-built apartments:
• Generally provide greater security of tenure.
• Older purpose-built rentals can provide more affordable rents.
Secondary suites:
• Generally provide significantly lower rents than purpose-built rentals; in Metro Vancouver, rents were
25% lower in two bedroom secondary suites than purpose-built rentals in 2016 (CMHC Rental Market
Report Vancouver CMA, 2016).
• Less security of tenure; can revert back to owner-occupancy.
Rented condominiums:
• Usually newer, with higher rents. In Metro Vancouver, the average rent for a 1 bedroom condo was
15% higher than a purpose-built apartment; two bedrooms were 21% higher (CMHC Rental Market
Report Vancouver CMA, 2017).
• Less security of tenure; can revert back to owner-occupancy.
9The data on low rise apartments does not include market rental units included in seniors’ housing buildings
that have a mix of both non-market (social housing) and market units.
Surrey Housing Profile (Updated 2018) 23Purpose-built Rental Stock
Table 5 - Purpose-built Market Rental Units in Surrey (2018)
# of units % of total
Townhouse 93 2%
Low Rise Apartment 5,339 93%
High Rise Apartment 282 5%
Total Purpose-Built 5,714 100%
Source: City of Surrey Planning and Development Department, December 2018
In December 2018, there were approximately 5,714 non-stratified, purpose-built
townhouse and apartment units in Surrey, accounting for about 14% of all private market
rental units (see
Table 4 above). Most of these purpose-built market rental units are in low rise apartment
buildings (93%). 2% are in townhouse complexes and 5% are in high rise apartment
buildings.
Table 6 - Purpose-built Market Rental Units in Surrey by Community (2018)
Housing Type Cloverdale Fleetwood Guildford Newton South Surrey Whalley Surrey
Townhouse 0 0 68 25 0 0 93
Low Rise Apartment 348 3 2,053 542 180 2,213 5,339
High Rise Apartment 0 0 0 0 0 282 282
Total Purpose-Built 348 3 2,121 567 180 2,495 5,714
Percent of Surrey 6% 0% 37% 10% 3% 44% 100%
Purpose-Built
Source: City of Surrey Planning and Development Department, December 2018
Most of Surrey’s purpose-built market rental stock is found in Whalley (44%) and Guildford
(37%).
Table 7 – Purpose-built Rental by Bedroom Type, Metro Vancouver and Surrey (2018) 10
Metro Vancouver Surrey
Bedroom Type
# of Units % of Total # of Units % of Total
Bachelor 12,313 11% 78 1%
1-bedroom 67,989 62% 2648 47%
2-bedroom 26,751 24% 2485 44^
3+ bedroom 2,236 2% 392 7%
Total 109,289 100% 5,603 100%
Source: CMHC, Rental Market Report, November 2018
10CMHC data on numbers of purpose-built rental stock differs slightly from the City of Surrey Planning and
Development Department data.
24 Surrey Housing ProfileThe majority of Surrey’s purpose-built rental stock is one and two-bedroom apartments. As
table 7 indicates, only a small number of the purpose-built stock is available for larger
family households with 392 units of three-bedroom apartments.
Figure 10 - Construction of Purpose-Built Market Rentals (1900s – 2018) 11
Source: City of Surrey Planning and Development Department, December 2018
The majority of private market rental units in purpose-built rental buildings were
constructed in the 1970s. In the last few years, Surrey has begun to see the development
of new purpose-built market rental. Two new purpose-built market rental buildings have
opened since 2010: one building in Cloverdale (2016) and one in Whalley (2018). At the
end of 2018, there were approximately 600 market rental units under construction and
over 500 units in development, as well as two market rental redevelopment projects under
application.
11 Market rental units for seniors in "mixed" buildings that include both market and social housing for seniors
are not included in this data.
Surrey Housing Profile (Updated 2018) 25Figure 11 - Locations of Purpose-built Market Rental Stock in Surrey (2018)
Source: City of Surrey Planning and Development Department, December 2018
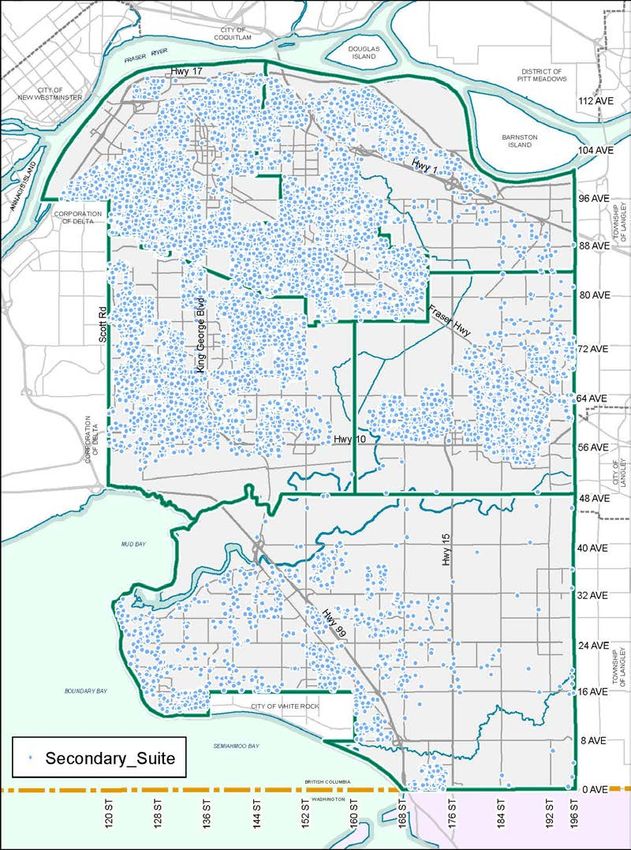
26 Surrey Housing ProfileSecondary Suites
The majority of Surrey’s private market rental units are secondary suites in single family
structures. According to Surrey’s Planning and Development Department, in 2018 there
were approximately 27,684 known secondary suites in Surrey, representing about 66% of
Surrey’s market rental stock. It is acknowledged that there are challenges in estimating
secondary suite numbers, and that there are likely additional secondary suites which are
not known or accounted for in Surrey’s building inventory at this time. 12
Prior to 2011 secondary suites were permitted only in the RF-SS, RF-12C, RF-9C, and RF-9S
zones. The Surrey Zoning By-law currently provides for legal secondary suites in the
following zones:
• all Single Family Residential zones;
• all One-Acre Residential, Half-Acre Residential, and Cluster Residential zones; and
• all Agriculture zones.
Information gathered from Surrey’s Finance Department which collects the Secondary
Suite Fee from known suites indicates that approximately 75% of suites were built without
a building permit.
Table 8 - Known Suites by Building Permit Status (2018)
# of units % of total
Secondary suites with building permits 6,936 25.1%
Secondary suites without building permits 20,748 74.9%
Total 27,684 100%
Source: City of Surrey Planning and Development Department, December 2018
All secondary suites in Surrey must be registered. Secondary suite annual payment fees are
based on the Secondary Suite Service Fee Bylaw. For unregistered suites, a $1000 penalty
fee is added to the taxes due on the property for each unregistered secondary suite if the
City of Surrey becomes aware of a suite that is not registered. The City is continually
identifying unauthorized suites by a variety of methods.
12 The City of Surrey secondary suite estimate is based on its own inventory that reconciled with British
Columbia Assessment Authority information.
Surrey Housing Profile (Updated 2018) 27Figure 12 - Locations of Known Secondary Suites in Surrey (2018)
Source: City of Surrey Planning and Development Department, December 2018
28 Surrey Housing ProfileCondominium Apartment Rentals
Figure 13 - Number of Rented Condo Apartments in Surrey by Community (2016)
Source: 2016 Census, Statistics Canada, custom data
According to 2016 census data, there are 7,795 apartments in Surrey with condominium
status that are rented, representing approximately 18% of Surrey’s market rental stock.
Whalley has the highest number and proportion of rented condo apartments; 3,655 or
47% of condo apartments in Whalley are rented out by owners.
Figure 14 - Number of Rented Condo Apartments in Surrey
by Period of Construction (2016)
Source: 2016 Census, Statistics Canada, custom data. Note: 2011 to 2016 is a five-year period only.
In looking at rented condos by period of construction, rented condos are generally newer
stock, built since 2001. 2985 households rent condos built in the decade between 2001 –
2010, while 2040 households rent condos built in the five years between 2011 – 2016.
Surrey Housing Profile (Updated 2018) 29B. NON-MARKET SOCIAL HOUSING
Inventory of Social Housing
Surrey currently has approximately 5,200 social housing units in the non-market range of
the housing continuum. 13 The highest proportion of social housing stock is in low income
rental housing, which does not include any support services and is intended for those who
are able to live independently.
Table 9 - Number of Social Housing Units in Surrey (2018)
% of social
Type of social housing # of units
housing units
Aboriginal 155 3%
Co-operative housing 879 17%
Low income rental housing 1,764 34%
Low income seniors 1,354 26%
Long-term supportive housing 184 4%
Transition / Supportive 666 13%
Emergency shelter beds 187 4%
Total 5189 100%
Source: City of Surrey Planning and Development Department, December 2018
Rental Supplements
Rental supplements are provided to help those in identified at-risk groups access rental
housing in the private market. The number of rent supplements in Surrey for those who
are homeless or at risk of homelessness increased from 118 in 2012 to 336 in 2018.
Table 10 – Number of Rent Supplements in Surrey, 2018 14
Homelessness Low Income Families and Seniors
BC Housing Fraser Health Rental Assistance for Shelter Aid for Elderly
ACT Teams Families (RAP) Renters (SAFER)
276 60 1341 1951
Source: BC Housing and Fraser Health Authority, March 2018
13 In this report, ‘social housing’ refers to housing for low income households or adults with special needs that
is operated by a public agency, non-profit society or housing co-operative. Housing units or beds in privately-
run market facilities (e.g. senior’s housing/facilities) that are funded or subsidized by government agencies are
also included in the number of social housing units.
14
BC Housing provides rent supplements for homelessness (Homeless Prevention Program, Provincial Homelessness Initiative
Outreach Teams) and low income families and seniors through the RAP and SAFER programs. Fraser Health Authority
provides rent subsidies through Assertive Community Treatment (ACT) teams.
30 Surrey Housing ProfileConstruction Period of Social Housing Units
Figure 15 - Construction of Social Housing Units in Surrey by Type (Pre-1960 – 2018) 15
Source: City of Surrey Planning and Development Department, December 2018
The majority of co-operative and low income housing units for aboriginal people, families,
seniors and single people were constructed during the 1980s. Since 2010, most social
housing that has been constructed has been transition / supportive housing.
15
Figure 15 includes only social housing units that are constructed as part of new developments; non-profit housing
organizations also may add to the total number of social housing units in Surrey by buying and renovating existing buildings.
The data presented here is by the original year of construction of the building.
Surrey Housing Profile (Updated 2018) 31Figure 16 - Locations of Social Housing in Surrey (2018)
Source: City of Surrey Planning and Development Department, December 2018 16
16 Social housing with confidential addresses are not shown.
32 Surrey Housing ProfileC. RENTS AND VACANCY RATES
Table 11 - Average Market Rents and Vacancy Rates, Primary Rental Market (2018)
Bachelor 1 bedroom 2 bedroom 3 bedroom+ Total
Average rent Surrey $774 $978 $1151 $1307 $1079
Metro $1150 $1307 $1649 $1921 $1385
Vancouver
Vacancy rate Surrey 0.0% 0.4% 0.5% 0.0% 0.4%
Metro 0.9% 1.1% 0.9% 1.0% 1.0%
Vancouver
Source: CMHC, Rental Market Report, November 2018
CMHC reported that the average rent in Surrey’s primary rental market increased by $65 a
month, from $1005 in 2017 to $1079 in 2018. However, the average rent in Surrey is 22%
lower than the regional average of $1,385 (Table 11, above).
Figure 17 - Average Purpose-Built Apartment Rents, Surrey & Metro
Vancouver (2009 – 2018)
Source: CMHC, Rental Market Report, October 2009 - 2018
Over the past ten years, rents have been increasing in Surrey, as in the region as a whole.
Looking at Figure 15, rents for purpose-built apartments increased by 34% in the previous
ten years in Surrey and 26% in the last five years. Over the past ten years, Surrey’s rents
have been increasing at a slightly slower rate than in Metro Vancouver. However, this
trend has changed – in the past five years, Surrey’s rents have increased at the same rate
as in Metro Vancouver.
Surrey Housing Profile (Updated 2018) 33Secondary suites tend to have lower rents than purpose-built rentals. In Metro Vancouver,
the average rent for a two-bedroom secondary suite was 22% less than a two-bedroom
purpose-built rental (2016) 17.
Condominium apartments tend to have higher rents than purpose-built rental units,
because the stock of the former is typically newer and often has amenities not found in
traditional rental units. In Metro Vancouver, the average rent for a one-bedroom
condominium apartment was 17% higher than the average rent in a purpose-built
apartment, while a two-bedroom unit was 19% higher in 2018. 18
Figure 18 - Regional Comparison of Vacancy Rates for Private Apartments (2009 – 2018)
Source: CMHC, Rental Market Reports, 2009 to 2018
Surrey’s vacancy rates have been dropping rapidly since 2012. In 2016, Surrey’s vacancy
rates dropped lower than Metro Vancouver’s for the first time in at least ten years. From
2017 – 2018, the vacancy rate for Metro Vancouver rose slightly, while Surrey’s vacancy
rate decreased.
17 CMHC, Rental Market Report, 2016. Secondary suite rental rates are from 2016 as this is the last date that
this data was provided in CMHC’s annual Rental Market Report.
18 CMHC, Rental Market Report, 2018
34 Surrey Housing ProfileD.RENTAL HEALTH: CANADIAN RENTAL HOUSING INDEX
The BC Non-Profit Housing Association (BCNPHA) released a “Canadian Rental Housing
Index” based on the 2016 census. The rental index uses supply and affordability data to
measure the health of rental housing across Canada.
An assessment of rental health is based on five indicators: affordability, overspending,
income gap, overcrowding and bedroom shortfall. Each community is given two overall
rankings: one that illustrates how it compares to other communities in the same province,
and another that illustrates how it compares to all communities in Canada.
Surrey’s rental health is ranked as ‘critical’. At a national level, Surrey ranks 510 out of 552
communities. At a provincial level, Surrey ranks 67 out of 72 communities. This means that
Surrey has the sixth worst rental health of all municipalities in BC.
Table 12 - BC Municipalities, Top 10 Most Critical Scores (2016)
Ranking Municipality
1. Burnaby
2. Richmond
3. Coquitlam
4. Whistler
5. North Vancouver City
6. Surrey
7. Vancouver
8. West Vancouver
9. New Westminster
10. North Vancouver District
Source: BCNPHA, Canadian Rental Housing Index, 2016
Surrey Housing Profile (Updated 2018) 35PART IV: AFFORDABILITY – RENTERS
A. INCOME IN SURREY
Household income 19 is a major determinant of what type of housing, along the housing
continuum, households are able to obtain.
Income Distribution for All Households
Figure 19 – Share of Total Households by Income Groups for Surrey (2015)
Source: 2016 Census, Statistics Canada
Households earning between $50,000 - $79,999 are the largest income group in Surrey
with approximately 43,460 households. Looking at the two lowest income groups,
approximately 25,660 households earned under $30,000 while 38,400 earned between
$30,000 - $49,999 (2015). Surrey’s income distribution is similar to Metro Vancouver’s.
Income and Tenure
Table 13 - Median Household Income in Surrey by Tenure (2015)
2015
Median income of owner households $92,614
Median income of renter households $47,965
Renter income as % of owner income 52%
Source: Metro Vancouver Housing Data Book, based on Statistics Canada, 2016 Census
According to the 2016 Census, the median income of renter households in Surrey
($47,965) in 2015 was slightly more than half the median income of owner households
($92,614). The median income of all households in Surrey was $77,515 (2016).
19Statistics Canada definitions:
• ‘Household total income’ refers to the sum of the total incomes of all members of that household. Unless
noted otherwise in this report, the income characteristics of private households refer to before-tax income.
36 Surrey Housing ProfileFigure 20 - Median Household Income for Renter Households,
Metro Vancouver Subregions (2015)
Source: Metro Vancouver Housing Data Book, based on Statistics Canada, 2016 Census
Across the region, median household incomes for renter households are substantially
lower than for owner households. Rental household incomes in the Surrey-White Rock
subregion are comparable to those in other subregions 20.
20Figure 20 shows median rental household income by subregion, which includes Surrey and White Rock.
Figures differ slightly than the median rental household income shown in Table 13, which are for Surrey only.
Surrey Housing Profile (Updated 2018) 37You can also read