Amazon Is Coming to Town: Headquarters Relocation and Housing Market Efficiency
←
→
Page content transcription
If your browser does not render page correctly, please read the page content below
Amazon Is Coming to Town:
Headquarters Relocation and Housing Market Efficiency∗
                 Yifan Chen†             Sean Wilkoff‡             Jiro Yoshida§
                                      December 20, 2020

                                             Abstract

      This study empirically examines strong-form market efficiency in housing markets.
      We use Amazon’s recent progressive disclosure of its new headquarters locations to
      distinguish changes in the public’s knowledge. Using a spatial difference-in-difference
      approach, we test whether housing prices increase, before Amazon’s announcements,
      near Amazon’s new headquarter locations in Crystal City, Virginia, and Long Island
      City, New York. The quality-adjusted housing prices exhibit 4.9% and 4.6% price
      premia near Amazon’s Virginia and New York headquarters, respectively, after the
      revelation of 20 finalist cities but no premia for other shortlisted cities. In addition,
      price premia for New York disappear before the formal cancellation of the New York
      headquarters, while premia remain constant in Virginia. This result is consistent with
      strong-form efficiency, where housing prices incorporate Amazon’s private information.

      JEL Classifications: G14, R21
      Keywords: market efficiency, private information, insiders, office locations, housing
      demand

  ∗
      We thank the seminar participants at Penn State for their valuable comments. We also thank the
financial support by the Penn State Institute for Real Estate Studies. The data are provided by Zillow
through the Zillow Transaction and Assessment Dataset (ZTRAX). More information on accessing the data
can be found at http://www.zillow.com/ztrax. The results and opinions are those of the author(s) and
do not reflect the position of Zillow Group.
    †
      The Pennsylvania State University, yxc326@psu.edu
    ‡
      University of Nevada, Reno, swilkoff@unr.edu
    §
      The Pennsylvania State University and the University of Tokyo, jiro@psu.edu, 368 Business Bldg.,
University Park, PA 16802.
1         Introduction

        Insider trading has been illegal in the securities markets since 1934 with the creation of
                                  1
the Securities Exchange Act           and in 1942 with the creation of rule 10b-52 . Insider trading
in the real estate market is still legal. As technology companies continue to grow, they
face an ever increasing need for more space. The size of these companies means that they
impact housing prices when they choose to relocate or add an additional location in a city3 .
The impact of a company moving and bringing 25,000 jobs will have large scale impacts on
the economy and house prices. Given the size of these companies, it can take considerable
planning to move headquarters (HQ) or to build a new one. Due to the complex nature of
choosing a new headquarters location, there will be many employees that potentially know
the location of the HQ before the public. These employees can then purchase properties or
reveal the HQ location prior to any public announcement.
        To the best of our knowledge, there is no research examining if housing markets in-
corporate private information. Due to the nature of the real estate market, it has been
difficult to study whether prices move with private information. Thus, existing literature
has examined the weak form and semi-strong-form efficiency in the real estate market (e.g.,
Capozza and Seguin, 1996; Fu and Ng, 2001; Larsen and Weum, 2008). However, no study
has examined the real estate market for strong-form efficiency until now. In this paper, we
examine whether housing markets incorporate private information prior to its public dis-
closure, thereby providing a test of the existence of strong-form efficiency in the housing
markets.
        There have been many changes in the housing market in the last two decades since anyone
last looked at the efficient market hypothesis in regard to the real estate market. First, the
internet has provided a pathway for information to flow to housing market participants.
    1
     https://www.sec.gov/about/laws/secrulesregs.htm
    2
     https://www.govinfo.gov/content/pkg/CFR-2020-title17-vol4/xml/CFR-2020-title17-vol4-
sec240-10b-5.xml
   3
     Hu et al. (2020)

                                                    1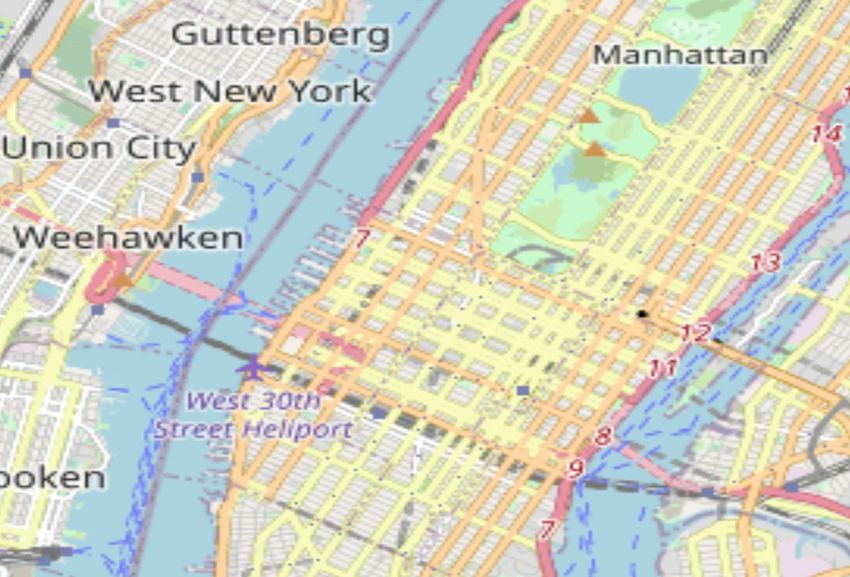
Sites such as Zillow and Redfin make housing prices available to everyone in almost real-
time. Second, numerous new companies have grown to such sizes that their movement
changes house prices (Hu et al., 2020). These firms are adding additional locations. In
December 2018, Google announced a major real-estate expansion in New York City and
planned to double its New York-based workforce to more than 14,000 employees over the
next decade. In 2017 Amazon announced it was looking for a second location and that cities
should provide a bid. Amazon’s public search for a new HQ and progressive disclosure has
provided us with a natural experiment that allows us to examine the information contained
in the housing market at each point in time. We are able to examine if house prices reflect
Amazon’s choice before Amazon discloses their decision.
   Amazon’s progressive disclosures and the time frame in which they appeared are as
follows: On September 7, 2017, Amazon publicly announced its plan to build a new head-
quarters and asked for bids from cities. Amazon announced this through a Request for
proposal 4 . They gave cities about a month to put together a bid that would include the
incentives the city would offer them.
   By the deadline on October 19, 2017, a total of 238 cities in Canada, Mexico, and the
U.S. offered tax breaks and other incentives to encourage Amazon to choose their city.
   On January 18, 2018, Amazon publicly stated a shortlist of 20 cities from the 238 cities
that made a bid, one of which Amazon would build an HQ at. The list included 19 cities in
the United states and one city in Canada. These cities arranged Amazon team’s visits and
tours around potential headquarter locations. However, the public still did not know exactly
where Amazon would build its headquarters.5
   The decision announcement on November 13, 2018, made public that the firm would
build two new headquarters in Arlington (Crystal City), Virginia and New York City (Long
   4
     https://images-na.ssl-images-amazon.com/images/G/01/Anything/test/images/usa/RFP 3. V
516043504 .pdf
   5
     The shortlisted cities are: Atlanta (GA), Austin (TX), Boston (MA), Chicago (IL), Columbus (OH),
Dallas (TX), Denver (CO), Indianapolis (IN), Los Angeles (CA), Miami (FL), Montgomery County (MD),
Nashville (TN), Newark (NJ), New York City (NY), Northern Virginia (VA), Philadelphia (PA), Pittsburgh
(PA), Raleigh (NC), Toronto (Canada), and Washington (DC).

                                                  2
Island City), New York. The firm also disclosed that they would bring 25,000 workers for
each location. However, before the November announcement, the Washington Post and
the Wall Street Journal reported that several finalists were in advanced talks with Amazon
over the headquarters decision, including the potential of choosing Crystal City in Northern
Virginia. Mike Grella, Amazon Director of Economic Development, wrote on Twitter that
the leaker responsible for informing the newspapers was violating a non-disclosure agreement.
This news indicates that Amazon employees knew which cities were seriously considered and
potentially the exact cities to be chosen, prior to Amazon’s official announcement.
   After the announcement of the New York location, Amazon faced an unexpectedly fierce
backlash from lawmakers, progressive activists, and union leaders, who were opposed to a
large amount of government incentives. On February 14, 2019, about three months after the
decision announcement, Amazon canceled the plan for Long Island City.
   The progressive nature of the public disclosures allows us to use a spatial difference-in-
difference approach to examine the impact of Amazon’s HQ decisions on housing prices. We
test whether housing prices increase before Amazon’s announcements near Amazon’s new
headquarter locations in Crystal City, Virginia, and Long Island City, New York.
   This study uses real estate transactions from ZTRAX covering a year before Amazon’s
announcement through the end of 2019. We use the ZTRAX data combined with a difference-
in-difference methodology over five different events, public disclosure by Amazon. The public
disclosures include Amazon’s announcement of a public search, a shortlist of 20 finalist cities,
Amazon’s HQ decision, and their cancellation of the New York location. The difference-in-
difference approach allows us to analyze whether news of Amazon’s headquarter location
choice was incorporated into the housing market.
   This study finds that the quality-adjusted housing prices near Amazon’s future Virginia
HQ exhibit 4.9% larger appreciation than in the surrounding area post Amazon’s selection of
finalists through six months past Amazon’s cancellation of their New York HQ. This result
is consistent with the real estate market being strong-form efficient. The Virginia housing

                                               3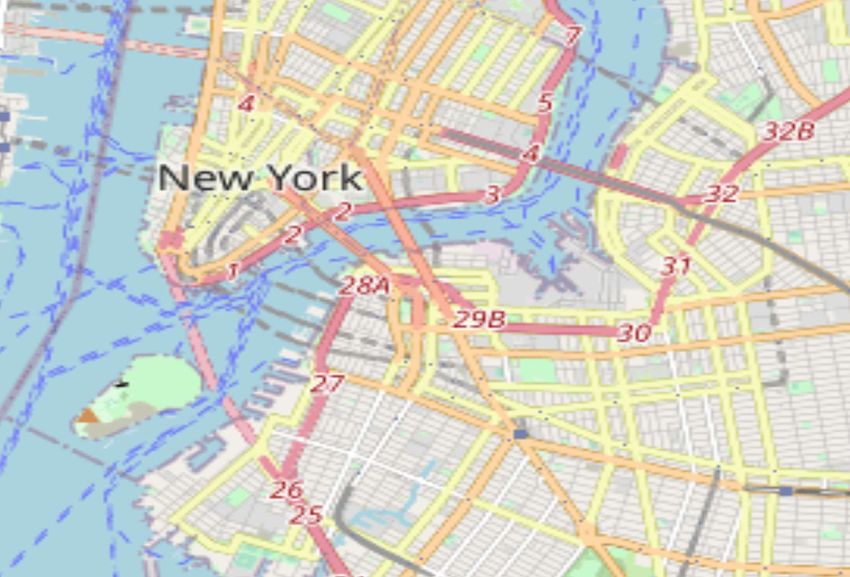
market around Amazon’s HQ incorporated private information after Amazon selected 20
finalists. Additionally, we find that house price appreciation in New York and Virginia are
similar after selection, with quality-adjusted housing prices near Amazon’s future New York
HQ exhibiting 4.6% larger appreciation. However, two months before Amazon’s decision,
the difference in housing values for New York properties appreciate 14.8% and then decrease
back to their baseline values prior to the public disclosure of Amazon selecting Long Island
City. These results provide further evidence that the housing market is strong-form efficient.
In New York, the housing market incorporated some private information after Amazon’s
selection but incorporated incremental private information two months prior to Amazon’s
public HQ decision. Additionally, due to Amazon’s cancellation of their HQ in New York, we
are able to confirm the effect we find is due to Amazon and not other confounding factors.
      We further analyze the housing markets in other finalist cities that ultimately were not
selected by Amazon. We find no house price changes during the same time period except
in New Jersey, where we find speculation existed between Amazon’s public announcement
of their search and a few months after Amazon’s selection of 20 finalist cities. This finding
implies that the effect we find is not due to speculation but due to private information.
We analyze the housing prices in other locations within the broader area of the ultimate
locations to confirm our result is due to Amazon’s HQ choice and not a confounding effect
related to the characteristics of the location.
      This paper addresses the concern that regulators have regarding the efficiency of the real
estate market and potential insider trading 6 . Our results suggest that the real estate market
is strong-form efficient, which means that private information is included in housing prices.
      We contribute to the literature in multiple ways. First, we are, to the best of our knowl-
edge, the first paper to examine the strong-form of market efficiency in the real estate market.
Second, we reexamine the efficiency of the real estate market in the current environment and
examine if information is more readily incorporated into housing prices. There has not been
  6
   https://www.wsj.com/articles/state-senator-proposes-law-to-ban-real-estate-deals-bas
ed-on-nonpublic-information-1543842000

                                                  4
a paper about efficiency in the real estate market in almost two decades. Advances in tech-
nology have reshaped the real estate market as well as the flow of information. Third, we
help to contribute to the ongoing debate over whether the real estate market is efficient. As
the literature has found mixed results over the years, we find that the real estate market can
be strong-form efficient in housing markets.
        The paper is structured as follows. Section 2 specifies the hypotheses. Section 3 de-
scribes the empirical strategy. Section 4 presents data and summary statistics. Section 5
demonstrates the main empirical results, followed by robustness checks outlined in Section
6. Section 7 concludes.

2         Hypotheses

        Due to Amazon’s size, an opening of an HQ could potentially create a positive impact
on real estate prices in whatever city they chose to locate. In particular, the relocation of
Amazon HQ with 25,000 workers will add significant demand in the local housing market
within the commuting zone. Although the actual commuting zone is not yet revealed, there
is a good reason to believe that these workers prefer living close to their workplace (e.g.,
Hartman-Glaser et al., 2020). More inelastic demand for units around the HQ will raise
transaction prices through Amazon’s decision process. Thus, we first hypothesize:

Hypothesis 1 (H1): Residential property prices appreciate more around the proposed Ama-
zon’s HQ than areas further away during Amazon’s decision process.

        Some home buyers may not be Amazon employees but those who expect the spillover
effect of Amazon’s relocation on the local economy.7 For example, owners of business service
firms, local shops, and restaurants may reside in the area anticipating the increased business
    7
    Even Amazon employees may not appear on the public record because actual buyers could be their
relatives, friends, or firms formed for a particular investment. This flexibility makes it difficult to conduct a
buyer status analysis.

                                                       5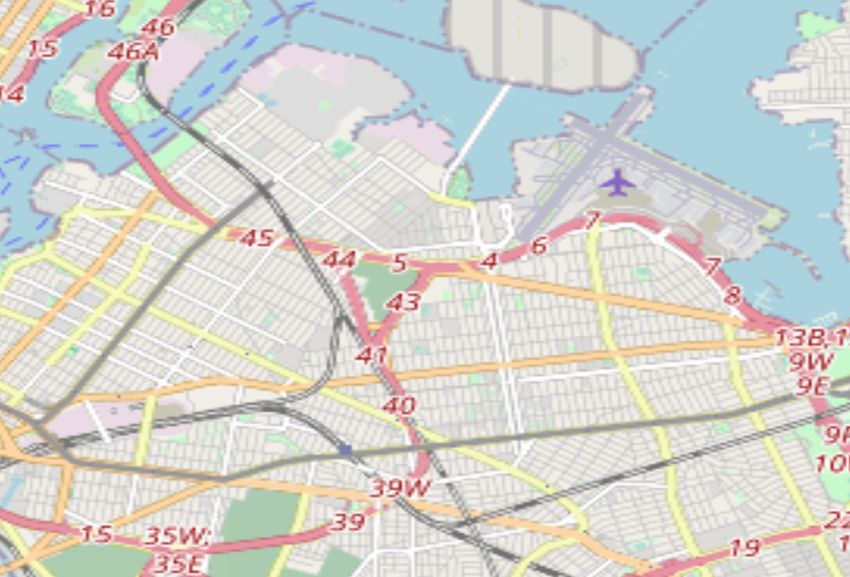
opportunity with Amazon. We include these housing demands in our estimation because
they are also caused by the Amazon relocation shock.
   A series of Amazon’s decisions with specific announcement dates provides us with a
unique opportunity to test the timing and magnitude of Amazon’s effect on local housing
prices. We focus on four critical release dates:

   • Announcement: September 7, 2017, for the announcement of Amazon’s opening a new
     HQ.

   • Selection: January 18, 2018, for the selection of 20 finalist cities

   • Decision: November 13, 2018, for the decision for New York and Virginia as the HQ
     locations.

   • Cancellation: January 14, 2019, for the cancellation of the New York HQ.

   The Cancellation event allows us to run an additional test on whether the price premia we
find is caused by Amazon’s relocation. If the price premia is caused by Amazon’s relocation
then we expect that property prices around the proposed New York HQ will not exhibit a
price premium after Cancellation. Our second and third hypotheses are:

Hypothesis 2 (H2): There is no premium in residential property prices around New York
HQ after Cancellation.

Hypothesis 3 (H3): There remains a premium in residential property prices around the
Virginia HQ after Cancellation.

   Our main question is whether housing prices incorporate private information before news
release dates: i.e., strong-form market efficiency. When Amazon’s board decided to build a
second HQ, only the board members and selected staff would have known the decision. As
evident by the leakage of Amazon’s final decision, there is private information inside Amazon
before official release dates. Unfortunately, we do not know what private information is

                                               6
available to what level of employees on what date. Nevertheless, the sequence of news
releases allows us to infer when price-relevant private information was likely generated.
   Before Announcement, Amazon could have decided on where the firm wanted to be
located. Alternatively, the firm could have just decided to open a new HQ with a strategy to
choose the best deal from a city. Either way, private information created at this stage would
not be valuable for housing purchases because there was no guarantee where Amazon would
locate their new HQ. Any trades related to Amazon would still be speculation at this point.
Thus, we do not focus on the period before Announcement. Even after Announcement and
bids were submitted, insiders were not likely to know the ultimate location because 238
cities were willing to provide generous tax breaks and subsidies. Thus, it is unlikely that
pure speculation can affect housing prices in Long Island City or Crystal City at this stage.
   In contrast, private information would have been generated around Selection. By the
time Amazon selected 20 cities from 238 bids, the firm was likely to rank them based on
comprehensive factors, including incentive packages. Then, the rank order must have been
shared among the board members, executive officers, and the staff who analyzed the bids. In
the most extreme case, the top two candidate cities—Virginia and New York—may have been
internally identified. Thus, Amazon employees could potentially have private information
relevant to the pricing of residential units around the target locations.
   Note that trading houses based on private information does not incur any legal or moral
issues unless a non-disclosure agreement prohibits it because the Securities and Exchange
Commission (SEC) does not regulate the housing market. If some of the Amazon employees
with private information purchased residential units around the anticipated HQ, local brokers
would share the heard-on-the-street news. Illiquid housing markets with a slow transaction
time makes it difficult to identify insider trading before Selection. Most transactions re-
quire approximately a month between a purchase agreement and closing. Thus, our next
hypothesis is:

Hypothesis 4 (H4): If private information is used for housing purchases, there will be

                                              7
price premia around Virginia and New York HQ slightly before or shortly after Selection.

   After Selection, speculators having a public list of 20 cities could bid up housing prices
in these cities. However, large-scale speculation is difficult because a single speculator is
unlikely to allocate funds across all 20 cities. Overall, a collection of local speculations could
cause price appreciation. Thus, we hypothesize:

Hypothesis 5 (H5): If speculation induced housing purchases around Amazon HQ, there
will be price premia in 20 shortlisted cities after Selection.

   After Decision, there are numerous reasons to think house prices would increase in these
cities. First, semi-strong-form efficiency suggests that prices should incorporate public in-
formation. The news about 25,000 employees at each HQ suggests a significant increase in
housing demand. Second, Amazon employees’ income above the local average will create
spillover effects through local consumption at restaurants and local service stores. Thus, the
hypothesis about semi-form strong efficiency is:

Hypothesis 6 (H6): If the local housing market is semi-strong-form efficient, there will be
price premia around Virginia and New York HQ only after Decision.

   Alternatively, if prices incorporate private information, there are two cases of price re-
sponses. First, if prices have already incorporated private information about Virginia and
New York around Selection, there will be no additional increase in price premia:

Hypothesis 7 (H7): If prices have incorporated private information about the ultimate de-
cision around Selection, there is no increase in price premia before Decision.

Second, if additional private information is generated before Decision, such as the elimination
of several finalist cities, there will be an additional increase in prices:

Hypothesis 8 (H8): If prices incorporate additional private information before Decision,
price premia will increase.

                                                 8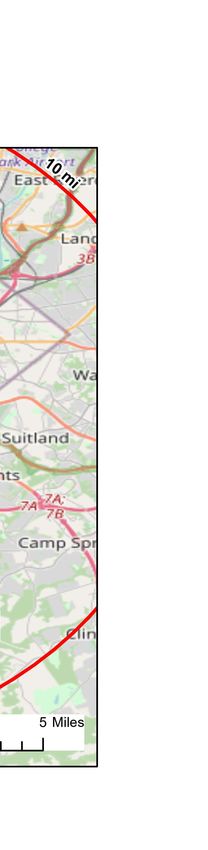
However, speculation will also result in changes in price premia. As the Amazon team
visited more sites after Selection, various media made speculative reports about Amazon’s
ultimate choice. Thus, there are incremental updates of information for speculators after
Selection. We hypothesize:

Hypothesis 9 (H9): If speculation induced price premia around Amazon HQ after Selec-
tion, price premia will gradually increase until Decision for Virginia and New York but
decrease to zero for other shortlisted cities.

3     Empirical Strategy

    There are several empirical challenges in identifying the causal effect of Amazon’s deci-
sions on nearby housing prices. First, each housing unit is unique and traded infrequently.
Second, the price appreciation around the proposed HQ in Virginia and New York may
be commonly observed throughout these metropolitan areas. Third, the price appreciation
around the proposed HQ may be caused by a shock unrelated to Amazon’s decisions. Fourth,
the price appreciation may stem from either the information about Amazon’s decisions or
pure speculation.
    To address the first challenge, we employ the hedonic pricing approach, which is a stan-
dard method applied in housing-related research to isolate the equilibrium price associated
with a particular housing attribute. In this approach, a property is regarded as a bundle
of attributes, each of which has an implicit price in equilibrium. (e.g., Rosen, 1974). Con-
structing a repeat-sale sample can be an alternative method to control for heterogeneity but
is infeasible due to the relatively short sample period in this study.
    To address the second and third challenges, we employ a spatial difference-in-differences
(DID) approach. We compare the housing price changes around Amazon events between
the area close to the proposed HQ and an area slightly further away. This method is widely
used to estimate the causal effect of a local economic event on housing values. Past studies

                                                 9
analyze the impact of Walmart store openings (Pope and Pope, 2015), sex offenders (Pope,
2008), foreclosures and forced sales (Gerardi et al., 2015; Lin et al., 2009; Schuetz et al.,
2008; Campbell et al., 2011), the initial public offerings of corporate stocks (Hartman-Glaser
et al., 2020), and the transit infrastructure (Gupta et al., 2020).
A spatial DID requires a treatment and control group. We define the treatment group by
the residential property transactions near the anticipated Amazon HQ location. We use a
five-mile radius for Virginia and a one-mile radius for New York each reflecting the different
commuting environments. For Virginia, we use a five-mile radius because car commuting
is common due to limited access to public transit. Other studies also find that a five-mile
radius is a reasonable boundary for other U.S. cities where car commuting is standard (e.g.,
Hu et al., 2020; Hartman-Glaser et al., 2020).
In New York, walkability and public transit are defining factors, whereas driving is not a
major mode of transportation. We focus on the area walkable to the HQ because New York’s
extensive public transit makes it difficult to define the public transit commuters’ treatment
area clearly. Thus, we estimate the partial effect of Amazon’s relocation only on a small
area associated with pedestrian commuters. There can be additional effects on further areas
along public transit.
We define the control group by transactions within a ring around the treatment area.
We use a ring defined by five and ten-mile radii for Virginia and a ring defined by one
and five-mile radii for New York. We exclude Washington D.C. and Manhattan from our
analysis because rivers create a natural barrier to commuting. Residential property markets
in Washington D.C. and Manhattan are also driven by confounding factors. For example, the
housing demand in Manhattan is significantly affected by other concurrent shocks generated
by a large-scale project such as Hudson Yards, in which Google expanded its HQ. Specifically,
we estimate the following equation:
X
ln Pit = αT reatment + βe P eriode + γe P eriode × T reatment + δ 0 Xi + ZIP + εit , (1)
e
10where Pit denotes the transaction price of housing unit i at date t. Treatment denotes an
indicator variable that takes a value of one if a transaction occurs in the treatment area
that we defined above. A vector of variables Xi denotes hedonic attributes. ZIP denotes
zip-code fixed effects.
The variable P eriode denotes an indicator variable for a period associated with Amazon’s
decision event. The variable takes a value of one if a transaction occurs during P eriode and
zero otherwise. Because we cannot specify too granular periods due to the sample size, we
specify five event periods in the main specification for e:
post announcement,
post selection,
e1 = two months before decision, . (2)
post decision, and
post cancellation
These periods have no overlaps; e.g., the post announcement period is between the announce-
ment date and the selection date. The base period is twelve months before the announcement
date. The average time trend is captured by βe . Our main interest is to test hypotheses H2
through H9. In particular, to test H7 and H8, we separate a two-month pre-decision period
out of the post-selection period.
To gain further insights into the timing around selection and cancellation for hypotheses
11H2 through H5, we also estimate the model with two additional pre-event periods for e:
post announcement,
two months before selection,
post selection,
e2 = two months before decision, . (3)
post decision,
two months before cancellation, and
post cancellation
This specification allows us to test if housing prices change even before the selection of twenty
cities, despite less statistical power due to a smaller sample size.
Our DID estimator is γe in equation (1). For identification, we need the following as-
sumptions. First, more Amazon employees need to prefer living close to HQ. We do not
require that all employees prefer close locations because we do not attempt to estimate the
full effect. For example, some employees will increase housing demand in a distant neighbor-
hood with high amenities or school quality. Those employees without proximity preferences
will attenuate our estimates, making it more difficult to find a statistically significant result
for our treatment group.
Second, the treatment and control areas need to have similar price trends before Amazon
events. The coefficient α captures the price difference between the two areas during the
baseline period. However, if the treatment area has a long-term growth trend exceeding that
of the control area, our DID estimate is biased upward. For example, long-term economic
development may be taking place in the treatment area. Thus, we will test the consistency of
price trends before our study period by estimating equation (1) by shifting all dates backward
by two calendar years.
Given those two conditions, if we find a significant coefficient γe for two months before
Decision, it is a sign of strong-form market efficiency because there was no public information
12about the final decision for New York and Virginia during that period. If private information
existed more than two months before Decision, we would also find a significant δe for the
post selection period.
However, hypotheses H5 and H9 state that speculation can also result in a positive
coefficient before Decision. To distinguish the price change induced by private information
from speculation, we conduct two analyses.
In the first analysis, we test whether price premia drift up until the official decision date
(H8) or remain stable (H7). Stable price premia suggest private information. However, an
upward drift can be caused by either additional private information (H8) or speculation
(H9).
Thus, the second analysis utilizes price premia in the other short-listed cities. We estimate
equation (1) for the anticipated HQ locations in New Jersey, Colorado, Pennsylvania, and
Georgia. If there are no price premia after Selection, then hypothesis H5 for speculation
is rejected. If these cities exhibit the post-Selection premia that gradually decrease to zero
until Decision, then the result is consistent with hypothesis H9 for speculation. However,
if non-decreasing price premia are observed after Selection, the result is inconsistent with
speculation.
4 Data
We obtain Amazon’s announcement dates from USA Today 8 . For housing transactions,
we use the Zillow Transaction and Assessment Database (ZTRAX) for New York, Virginia,
New Jersey, Colorado, Georgia, and Pennsylvania. The ZTRAX data set includes more than
400 million public records from more than 2,750 counties in the U.S. between 1994 and 2019.
Our sample covers one year before Amazon announced they were taking bids for an HQ
location until ten months after the New York HQ was canceled. Thus, the data runs from
8
https://www.usatoday.com/story/tech/science/2018/09/12/timeline-Amazons-search-hq-2-
its-second-headquarters/1273275002
13September 2016 through December 2019.
We use the contract date as the date of the transaction because this will reflect the date
at which the buyer decided on the house price. The housing characteristics include building
age, unit square footage, the number of stories for the unit’s building, a dummy variable for
fireplace, deed type, and dummies for residential types (e.g., Single-family, townhouses, and
condominiums).
We confine our sample to arms-length transactions of single-family homes, townhouses,
and condos by using only standard transfer deeds and general warranty deeds. We exclude
outliers for prices, unit square footage, and lot size based on three times the inter-quartile
range (IQR); i.e., we use observations if variable X is in [Q1 − 3(Q3 − Q1), Q3 + 3(Q3 − Q1)],
where Q1 and Q3 denote the lower and upper quartiles, respectively.
Then, we restrict our sample to the sales price per square foot between the first and the
99th percentiles. We cull homes that report a negative building age (i.e., sale year minus
year built) or greater than 100 years. Last, we confine the New York sample to properties
within 5 miles from Amazon’s second HQ and the Virginia sample to properties within 10
miles from Amazon’s second HQ. After data cleaning, we have obtained 4,085 transactions
for New York and 14,589 transactions for Virginia.
Table 1 shows the summary statistics of the data used in our analysis. The average
sales price is $848,000 in New York and $628,082 in Virginia. The average building age
is 50 years in New York and 40 years in Virginia. The New York market is denser than
Virginia; the average number of stories of buildings is 5.84 for New York and 1.62 for Virginia.
The treatment and control areas exhibit significant differences in housing characteristics,
suggesting the need to control for characteristic differences.
145 Results
Our results imply that the real estate market is strong-form efficient. Strong-form effi-
ciency in the real estate market means that private information is incorporated into housing
prices prior to the public disclosure of that information. Based on the methods described
above, we examine when the information that Amazon was opening an HQ in Long Island
City, NY and Crystal City, VA was incorporated into property prices.
5.1 Absence of diverging trends
To assure that the DID estimator is unbiased, we demonstrate that the treatment area
does not exhibit growing price premia relative to the control group before Amazon’s an-
nouncement of their HQ relocation. We estimate our hedonic model, described in equation
1, shifting the date of each event and our baseline period backwards by two calendar years.
For example, for the true announcement date of September 7, 2017, we specify a placebo
announcement date of September 7, 2015. Similarly, for the true cancellation of New York
HQ on February 14, 2019, we specify a placebo cancellation date of February 14, 2017. With
a two-year shift in dates, the placebo periods do not have an overlap with the true sample
period. The results are in Figures 8a and 8b. None of the coefficients are positive and
statistically significant for Long Island City or Crystal City. Thus, housing prices within the
treatment area followed the same trend as those for the control area in both cities before
Amazon announced its intention of HQ location.
5.2 Long Island City, New York
Figure 3a graphically presents the coefficients of interest. These coefficients represent the
marginal change in the property price differentials between the treatment and control groups
for different public disclosures made by Amazon related to their HQ decision. House prices
in the treatment group do not deviate from those in the control group until Long Island
15City is publicly selected as a top 20 finalist for Amazon’s HQ location. This suggests that
the real estate market did not price in that Amazon would build an HQ in Long Island City
prior to Amazon’s selection of 20 cities. The coefficient on the interaction of the treatment
group and the selection dummy, which represents the time period between Amazon’s public
selection of finalists and two months prior to Amazon’s final decision, is statistically and
economically significant. We can see in Table 2 that the change in housing prices around
selection is almost 5% which economically translates to approximately $43,819.
We further examine the change in housing prices for transactions that occur within two
months of Amazon’s public decision. The coefficient is statistically significant at 15% and
economically significant at $140,560 implying that prices increased by three times as much
two months prior to the public decision relative to when Long Island City was publicly
selected to be a finalist. This result is consistent with the housing market being strong-form
efficient.
It is possible that when Long Island City was selected as a finalist investors were specu-
lating that it would be chosen. However, we will show below in Section 6 that other cities
not ultimately chosen but part of the finalists did not get such an increase in housing prices
after the public selection by Amazon. Even speculation at the time of selection is consistent
with the real estate market incorporating news of Amazon’s HQ in Long Island City prior
to the public announcement. Because two months prior to Amazon’s decision house prices
increased threefold from the initial increase after Long Island City’s selection. This implies
that more information was incorporated into housing prices prior to the public decision to
have an HQ in Long Island City.
In order for the housing market to be strong-form efficient it is necessary that when
Amazon’s decision was made public that housing prices did not increase. An increase would
imply that there was additional information provided to the market that affect housing
prices. The coefficient on decision in Figure 3a, which represents, the time of the actual
public decision, suggests that the house prices in the treatment area decreased to their
16baseline levels. This result reflects the new information that was publicly available after the
Decision. Once the HQ location was announced in New York the local community protested
Amazon’s location choice and the deal New York was going to provide Amazon. It became
very clear that a majority of locals opposed Amazon. The decision coefficient represents the
house values from the time the decision was made public until Amazon publicly cancelled
the HQ from going to New York. The effect of Amazon’s cancellation of their Long Island
City HQ provides further evidence that the effect on house prices is due to Amazon.
Our results suggest that there is not another explanation for the increase in housing
prices we saw besides for the effect of Amazon. Further, we see that there is no change in
house prices when Amazon publicly announces the cancellation of the HQ in Long Island
City. We do not see any additional change in housing prices because the market has already
incorporated the cancellation into housing prices prior to Amazon’s announcement. We
see this in our results through the statistically insignificant coefficients on the decision and
cancellation events. If Amazon had not cancelled their HQ location in Long Island City we
would have expected to see no change in the results. The coefficients should have remained
constant from two months prior to decision through decision and beyond as the value of
Amazon’s HQ would be permanently priced into the housing market.
In the next section we examine the results from our analysis of Crystal City Virginia
where Amazon announced an HQ location that was not cancelled.
5.3 Crystal City, Virginia
In Figure 3b we see results that imply the housing market in Crystal City incorporated
the information that Amazon would be building a second HQ there prior to the public
dissemination of that information. The coefficients in Figure 3b show that property prices
in the treatment group in Crystal City did not change prior to Amazon’s selection of finalist
cities. After Amazon’s selection prices for houses in the treatment group increased relative
to the control group. The coefficient on selection is statistically significant at 5% this is also
17an economically significant impact that represents $27,807. This result holds from the time
of selection through the end of our period. These results suggest the market knew Amazon
was going to pick Crystal City prior to that information being made public. We show in
Section 6 that this effect is not a speculation effect and is in fact specific to the area where
Amazon’s HQ is intended to be built.
6 Robustness
In Section 5 we discuss how our results are consistent with the housing market being
strong-form efficient. Our results imply that house prices in both Long Island City and
Crystal city reflect information before that information was made public. The results in this
section imply the housing market is strong form efficient and the following three alternative
explanations are not suitable alternative explanations. The first alternative explanation is
that the effect we find is not related to Amazon. It may be possible that the effect we find
starts before the selection of the finalists and is therefore not related to Amazon. We show
the effect does not occur until after the cities have submitted bids and the finalists have been
chosen, which therefore reflects that it is private information being reflected. The second
alternative explanation is the results we find are due to an unobserved effect taking place in
the city at the same time. We provide analysis that chooses three other locations in the city
as a proxy for the Amazon HQ and find none of them show an effect. Therefore, the effect
we find is only due to the HQ location choice by Amazon. The third alternative explanation
is the increase in housing prices is a reflection of speculators and not private information. In
order, to test for this we examine other finalist cities and find there is no increase in prices
in other cities.
186.1 Pre-effect
In this section we provide support that our results above are not a result of house prices
in the treatment area increasing prior to Amazon’s selection of 20 finalists. In Figures ?? and
4b we add additional event dates to examine when the impact on housing prices occurred.
We include a date that is two months prior to Amazon’s public disclosure of the selection
of finalists and two months prior to Amazon’s public disclosure of cancellation. We do not
include an event date for two months prior to announcement as the market did not even
know what cities would apply to be a host city for Amazon. Additionally, our baseline period
that we established, in Section 5.1, has parallel trends is prior to the announcement which
implies there is no additional difference prior to the announcement.
Figure 4a displays the results for Long Island City. We see that two months prior to
the public announcement of Amazon’s selection of 20 finalists that housing prices within the
treatment group are not statistically different from housing prices in the control group. This
implies that prior to Amazon’s public disclosure there is no change due to Amazon’s HQ. As
discussed above, Houses prices within one mile of Amazon’s future HQ location increase in
price, reflecting Amazon moving in, in the time period after Amazon announces the finalists.
The other additional event date we included was two months prior to cancellation. As
expected we see there is no effect on housing prices two months prior to cancellation. The
reason for this is protests and local outrage was very public so the knowledge that Amazon
was going to cancel their decision was already priced in prior to cancellation.
Figure 4b allows us to examine when the market knew about Amazon’s public disclosures
in Crystal city. We find that the results in Crystal city are similar to the results found for
Long Island City. Two months prior to Amazon’s announcement of the finalists there was
no change in house prices. The housing market had not yet priced in Amazon’s decision. We
also examine the effect of Amazon’s cancellation in Long Island City on housing prices in
Crystal City. As above, we find there is no change in housing prices due to Amazon’s New
York cancellation after cancellation or two months before. Housing prices in the treatment
19group remain above housing prices in the control group by as much as they did two months
prior to Amazon’s decision to locate to Crystal city. Cancellation in New York had no impact
in Crystal city.
Our findings suggest that the information about Amazon’s HQ locations was incorporated
into housing prices after Amazon made its selection of 20 finalists and not before. The results
also imply that the market knew Amazon would cancel its HQ location in Long Island City
prior to the public announcement. The housing prices in Long Island City reverted to their
levels prior to Amazon’s selection of 20 finalists further implying that the effect we find is
due to Amazon.
6.2 Placebo Test
Another possible explanation for our findings is that the effect we are picking up is not
related to Amazon but to something else. If the result is not attributable to Amazon HQ it
must be tied to the characteristics of the area. Therefore, in order to examine this explanation
we assume that any area similar to our treatment group would yield similar results to what
we found. We find three areas that are similar in characteristics to our treatment group and
treat each one of those as a placebo treatment group. We then establish a new control group
that does not include our original treatment group and implement our original DID analysis.
For our New York analysis, we selected three sites similar to Long Island City. We looked
for gentrifying locations that had a similar mix of industrial and residential. Figures 6a, 6b,
and 6c provide the coefficients for each placebo treatment group and Amazon’s disclosure.
The results imply that there is no Amazon effect for any of the placebo treatment groups
in New York. There are no coefficients that are positive and statistically significant. These
results are expected if we think Amazon’s HQ is the cause of the effect we find in our original
analysis.
In Virginia, we selected three locations similar to Crystal city. These locations were far
enough away from Crystal city that their five-mile radius did not overlap with the Crystal
20City treatment group. The locations we chose were also in driving distance of D.C. and
had established box stores.Figures 7a, 7b, and 7c provide the coefficients for each placebo
treatment group and Amazon’s disclosure. The results imply that there is no Amazon effect
for any of the placebo treatment groups in New York. There are no coefficients that are
statistically significant for two months prior to the decision or at the time of decision. These
results are expected if we think Amazon’s HQ is the cause of the effect we find in our original
analysis.
Our results for New York and Virginia imply that the cause of the effect we find on the
original treatment is due to Amazon moving it’s HQ. If the effect were due to the type of area
or pure location choice then we would have expected to see similar results in our regressions
of the placebo treatment groups. However, we find that the there are not significant results
when examining placebo treatment locations.
6.3 Proxy Cities
The last alternative explanation we have not examined is that our results are due to
investors speculating. If investors were speculating and not investing based on private infor-
mation then the speculators would need to speculate in every city that was named a finalist.
In addition, each city submitted a bid to Amazon with multiple locations for Amazon’s HQ.
This means that if an investor was to speculate in just one city they would need to purchase
multiple properties to speculate everywhere Amazon could be located. Alternatively, you
may have a lot of people speculating in different locations within a city. The number of
properties that would need to be purchased to speculate in all possible locations would be
too great for an individual and it is highly unlikely a REIT or hedgefund would purchase
enough properties in every area of every finalist city to change house prices. In order to test
whether our result is a due to speculation we run our analysis on alternative cities. These
cities come from Amazon’s final list.
We examine four finalists: Jersey City, NJ; Denver, CO; Atlanta, GA; and Philadelphia,
21PA. We choose these three cities because they provide enough information online to limit
the possible locations Amazon had to choose from to a small limited number. These cities
would have been best suited to speculators due to the small amount of location choices for
Amazon. Other cities provided a large number of location choices that would make it hard
to guess where speculators were most likely to invest. In actuality, if investors were just
speculating there are too many cities and even within cities too many locations for there to
be enough people speculating to see a change in prices.
If there was speculation going on we would expect to see a statistically significant coef-
ficient on the interaction between the treatment group and selection or treatment and two
months prior to the decision. Investors would be speculating before the information was
revealed.
Table 4 provides the results for our four proxy cities and possible cites for each city. We
do not find any statistically significant coefficients for three of our proxy cities and their
proxy sites for any time prior to Amazon’s public decision. We do find that New Jersey has
statistically significant coefficient on the interaction of treatment and selection. This effect
goes away by two months before the decision. These result implies that our result is not due
to speculation but is due to the market knowing that Amazon will choose Virginia and New
York as their new headquarter location.
All of our robustness checks support our hypothesis that the real estate market is strong-
form efficient in certain instances.The results we have from our analysis and robustness
checks are that the housing market knew the location of Amazon’s HQ location over two
months before Amazon disclosed it publicly.
7 Conclusion
As companies continue to grow and relocate or build additional HQs there will be po-
tential for private information to leak into the housing market. We are the first paper to
22examine if private information is incorporated into house prices. We test teh housing market
for strong form efficiency by using Amazon’s public process for selecting a HQ. The progres-
sive nature of Amazon’s public disclosure allows us to use a spatial difference-in-difference
approach to examine the impact of Amazon’s HQ decisions on housing prices. We find
that the quality-adjusted housing prices near Amazon’s future Virginia HQ exhibit 4.9%
larger appreciation than in the surrounding area post Amazon’s selection of finalists through
six months past Amazon’s cancellation of their New York HQ. Additionally, we find that
quality-adjusted housing prices near Amazon’s future New York HQ exhibiting 4.6% larger
appreciation. However, two months before Amazon’s decision, the difference in housing val-
ues for New York properties appreciate 14.8% and then decrease back to their baseline values
prior to the public disclosure of Amazon selecting Long Island City. These results provide
evidence that the housing market is strong-form efficient. We provide further analysis to
rule out any alternative explanation. Our paper adds to the literature on housing market
efficiency with the result that the housing market is strong-form efficient.
23References
Campbell, J. Y., Giglio, S., and Pathak, P. (2011). Forced Sales and House Prices. The
American Economic Review, 101(5):2108–2131.
Capozza, D. R. and Seguin, P. J. (1996). Expectations, efficiency, and euphoria in the
housing market. Regional Science and Urban Economics, 26(3-4):369–386.
Fu, Y. and Ng, L. K. (2001). Market efficiency and return statistics: Evidence from real estate
and stock markets using a present-value approach. Real Estate Economics, 29(2):227–250.
Gerardi, K., Rosenblatt, E., Willen, P. S., and Yao, V. (2015). Foreclosure externalities:
New evidence. Journal of Urban Economics, 87:42–56.
Gupta, A., Van Nieuwerburgh, S., and Kontokosta, C. (2020). Take the q train: Value cap-
ture of public infrastructure projects. Working Paper 26789, National Bureau of Economic
Research.
Hartman-Glaser, B., Thibodeau, M., and Yoshida, J. (2020). Cash to Spend: IPO Wealth
and House Prices. Working paper, SSRN, 3329651.
Hu, M., Tsang, D., and Wan, W. X. (2020). Corporate relocation and housing market
spillover. Available at SSRN 3683630.
Larsen, E. R. and Weum, S. (2008). Testing the efficiency of the norwegian housing market.
Journal of Urban Economics, 64(2):510–517.
Lin, Z., Rosenblatt, E., and Yao, V. W. (2009). Spillover effects of foreclosures on neighbor-
hood property values. The Journal of Real Estate Finance and Economics, 38(4):387–407.
Pope, D. G. and Pope, J. C. (2015). When Walmart comes to town: Always low housing
prices? Always? Journal of Urban Economics, 87:1–13.
Pope, J. C. (2008). Fear of crime and housing prices: Household reactions to sex offender
registries. Journal of Urban Economics, 64:601–614.
Rosen, S. (1974). Hedonic Prices and Implicit Markets: Product Differentiation in Pure
Competition. Journal of Political Economy, 82(1):34–55.
Schuetz, J., Been, V., and Ellen, I. G. (2008). Neighborhood effects of concentrated mortgage
foreclosures. Journal of Housing Economics, 17(4):306–319.
24Figure 1. Amazon Headquarters Relocation Timeline
Source:https://www.usatoday.com/story/tech/science/2018/09/12/timeline-Amazons-search-hq-
2-its-second-headquarters/1273275002
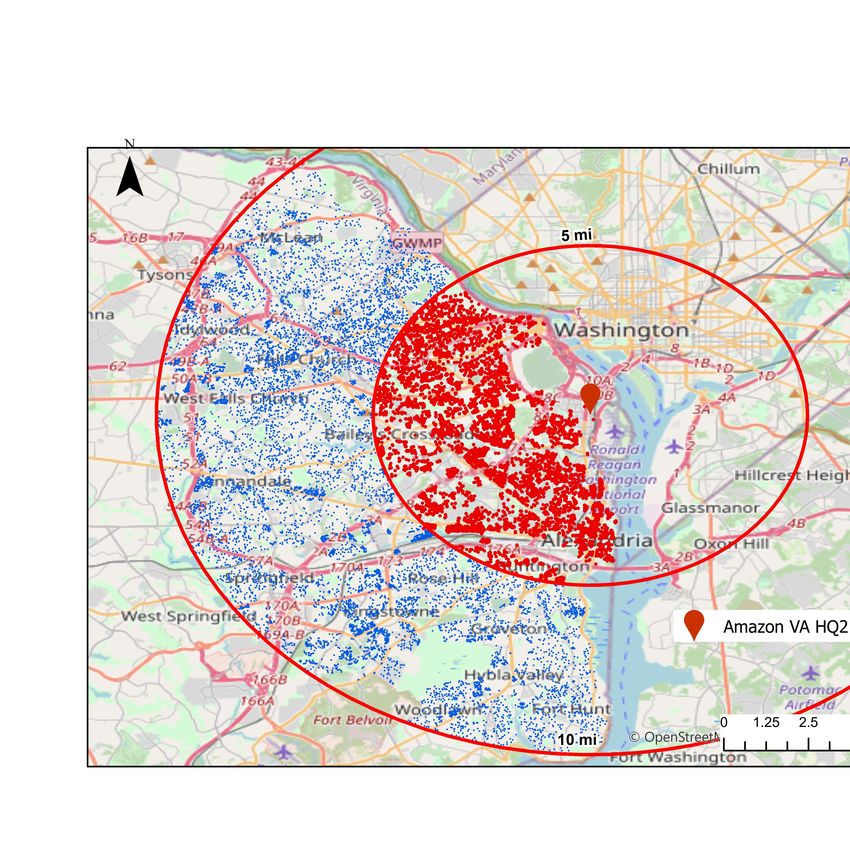
25Figure 2. Treatment and Control Areas
0 1.25 2.5 5 Miles
i
m
5
Amazon NY HQ2
1 mi
5 mi © OpenStreetMap (and) contributors, CC-BY-SA
(a) New York
(b) Virginia
This figure shows the treatment and control areas for New York (a) and Virginia (b). Red pins denote
Amazon’s second headquarters. Red dots inside the inner solid circles represent the treatment group, whereas
blue dots in the outer ring represent the control group. The radius of the treatment area is 1 mile for New
York and 5 mile for Virginia. The radius of the outer circle for the control area is 5 miles for New York and
10 miles for Virginia. The sample period is between September 2016 and Decebmer 2019.
26Figure 3. Difference-in-difference Estimation Results
.3
.2
.1
0
-.1
-.2
-.3
Base Announcement Selection 2m-before-Decision Decision Cancel
(a) New York
.3
.2
.1
0
-.1
-.2
-.3
Base Announcement Selection 2m-before-Decision Decision Cancel
(b) Virginia
The figures display difference-in-differences estimation results for New York (a) and Virginia (b). The
vertical axis represents the log price premium for the treatment area relative to the baseline period (Base).
The horizontal axis (Announcement, Selection, 2m-before-Decision, Decision, and Cancel) represents the
post-event periods defined by equation (2) in Section 3.
27Figure 4. Difference-in-difference Estimation Results of Seven Event Windows
.3
.2
.1
0
-.1
-.2
-.3
Base Post-A Pre-S Post-S Pre-D Post-D Pre-C Post-C
(a) New York
.3
.2
.1
0
-.1
-.2
-.3
Base Post-A Pre-S Post-S Pre-D Post-D Pre-C Post-C
(b) Virginia
The figures display difference-in-differences estimation results with seven event windows for New York (a)
and Virginia (b). The vertical axis represents the log price premium for the treatment area relative to the
baseline period (Base). The horizontal axis (Base, Post-A, Pre-S, Post-S, Pre-D, Post-D, Pre-C, and Post-C)
represents the post-event periods defined by equation (3) in Section 3.
28Figure 5. Treatment and Control Areas in Placebo Tests
0 1.25 2.5 5 Miles
i
m
5
Amazon NY HQ2
Placebo Site1_Cadman_Plaza_Park
Placebo Site2_Continental_Army_Plaza
Placebo Site3_Latham_Park 1 mi
1 mi
0 mi
1 mi
0
m
i
5 mi © OpenStreetMap (and) contributors, CC-BY-SA
(a) New York
(b) Virginia
This figure shows the treatment and control areas used in the placebo tests for New York (a) and Virginia (b).
The inner solid red circles around Amazon’s second headquarters (red pins) represents the real treatment
area, which is excluded from the placebo test. We specify three placebo treatment areas (dashed circles) in
the the real control area. The placebo control sample comprises transactions outside each placebo treatment
area.
29Figure 6. Difference-in-difference Estimation Results of Placebo Tests in New York
.3
.2
.1
0
-.1
-.2
-.3
Base Announcement Selection 2m-before-Decision Decision Cancel
(a) Placebo Site 1
.3
.2
.1
0
-.1
-.2
-.3
Base Announcement Selection 2m-before-Decision Decision Cancel
(b) Placebo Site 2
.3
.2
.1
0
-.1
-.2
-.3
Base Announcement Selection 2m-before-Decision Decision Cancel
(c) Placebo Site 3
The figures display difference-in-difference estimation results of three placebo site tests in New York. Base
represents baseline periods, i.e. 12 months before the announcement date. Announcement represents the
period from the announcement date to the selection date. Selection represents the period from the selection
date to two months before the decision date. 2m-before-Decision represents the period two months prior to
the decision date. Decision represents the period from the decision date to the cancellation date. Cancel
represents the period from the cancellation date to the following 10 months.
30Figure 7. Difference-in-difference Estimation Results of Placebo Tests in Virginia
.2
.1
0
-.1
-.2
Base Announcement Selection 2m-before-Decision Decision Cancel
(a) Placebo Site 1
.2
.1
0
-.1
-.2
Base Announcement Selection 2m-before-Decision Decision Cancel
(b) Placebo Site 2
.2
.1
0
-.1
-.2
Base Announcement Selection 2m-before-Decision Decision Cancel
(c) Placebo Site 3
The figures display difference-in-difference estimation results of three placebo site tests in Virginia. Base
represents baseline periods, i.e. 12 months before the announcement date. Announcement represents the
period from the announcement date to the selection date. Selection represents the period from the selection
date to two months before the decision date. 2m-before-Decision represents the period two months prior to
the decision date. Decision represents the period from the decision date to the cancellation date. Cancel
represents the period from the cancellation date to the following 10 months.
31Figure 8. Parallel Trend Tests
.3
.2
.1
0
-.1
-.2
-.3
Proxy-Base Proxy-Announcement Proxy-Selection Proxy-2m-before-Decision Proxy-Decision Proxy-Cancel
(a) New York
.2
.1
0
-.1
-.2
Proxy-Base Proxy-Announcement Proxy-Selection Proxy-2m-before-Decision Proxy-Decision Proxy-Cancel
(b) Virginia
The figures display difference-in-difference estimation results of placebo periods in New York (a) and Virginia
(b). All the proxy events are two years before the real event dates correspondingly.
32Table 1. Summary Statistics
Panel A: New York
Full Sample Treatment Control Difference t-stat
Mean SD Min. Max. (a) (b) (a) - (b)
Sales Price 848,000 505,000 105,000 6,231,000 1,050,760 834,611 216,149 6.67
Building Age 49.93 36.36 1 100 24.60 51.62 -27.02 -11.70
Unit Square Footage 1,172.97 522.15 341 8,580 960.77 1,187.16 -226.39 -6.75
Number of Stories 5.84 6.53 1 40 9.01 5.63 3.39 8.09
Single Family 0.41 0.49 0 1 0.00 0.43 -0.43 -13.89
Condominium 0.56 0.50 0 1 1.00 0.53 0.46 14.80
Other Residential 0.03 0.17 0 1 0.00 0.03 -0.03 -2.83
Observations 4085 256 3829
Panel B: Virginia
33
Full Sample Treatment Control Difference t-stat
Mean SD Min. Max. (a) (b) (a) - (b)
Sales Price 628,082 382,121 55,000 4,100,000 684,610 605,176 79,434 11.42
Building Age 39.94 20.57 1 99 35.57 41.71 -6.14 -16.49
Unit Square Footage 1,744.18 932.95 428 10,614 1,665.53 1,776.05 -110.52 -6.49
Number of Stories 1.62 0.59 1 5 1.72 1.57 0.14 13.57
Fireplaced 0.66 0.47 0 1 0.53 0.71 -0.18 -20.46
Single Family 0.57 0.50 0 1 0.64 0.54 0.10 10.55
Townhouse 0.21 0.41 0 1 0.18 0.23 -0.05 -6.38
Condominium 0.22 0.41 0 1 0.19 0.23 -0.05 -6.29
Observations 14589 4207 10382
The table reports the descriptive statistics of sales prices and property characteristics between September 2016 to December
2019. Columns (a) and (b) show mean values for the treatment and control groups. Panel A is for New York, where the
treatment and control groups are defined by a 1 mile radius and a ring between 1 and 5 miles from Amazon’s headquarters.
Panel B is for Virginia, where the treatment and control groups are defined by a 5-mile radius and a ring between 5 and 10
miles. The last column reports t-statistics from a two-tail mean difference test between the treatment and control groups.You can also read