Fiji Housing Markets and Housing Affordability
←
→
Page content transcription
If your browser does not render page correctly, please read the page content below
Fiji Housing Markets and
Housing Affordability

Executive Summary

As a more developed Pacific island country, Fiji faces its own pressure on lack of affordable
housing in the urban area. With a majority proportion of land can only be developed on a
leasing basis, the policy certainty and the creditability of deed of cession plays a crucial role.
With the previous not so successful housing policies, the Fiji government could improve this
situation by introducing the public private partnership, providing low-cost alternative
arrangements, and introducing more relevant policies.

                                                                                                1
Table of Contents
Introduction ........................................................................................................................... 4
Background........................................................................................................................... 4
      Land tenure.................................................................................................................... 5
      Cities and towns in Fiji ................................................................................................... 6
      Rural areas .................................................................................................................... 6
      Informal settlement ........................................................................................................ 7
      Income level................................................................................................................. 12
The state of Fiji housing market .......................................................................................... 13
      Prices........................................................................................................................... 13
      Demand ....................................................................................................................... 15
      Supply .......................................................................................................................... 16
      Future Development Plans ........................................................................................... 18
Housing Affordability Programs ........................................................................................... 18
      Social Housing Policy .................................................................................................. 18
      Government funding .................................................................................................... 19
      Residential Housing Development Package (Affordable housing for ordinary Fijians) .. 20
The institutions .................................................................................................................... 20
      Department of Town and Planning ............................................................................... 20
      Native Land Trust Board (NLTB) .................................................................................. 21
      The Department of Lands ............................................................................................ 21
      Housing Authority of Fiji ............................................................................................... 21
      Public Rental Board (PRB) ........................................................................................... 21
      The Housing Assistance and Relief Trust (HART)........................................................ 21
      Local Banks ................................................................................................................. 21
The foreign institutions ........................................................................................................ 22
      ADB ............................................................................................................................. 22
      Chinese Government and Firms .................................................................................. 22
Discussion and Conclusion ................................................................................................. 23
Reference ........................................................................................................................... 25
Appendix 1 .......................................................................................................................... 30
Appendix 2 .......................................................................................................................... 31

                                                                                                                                        2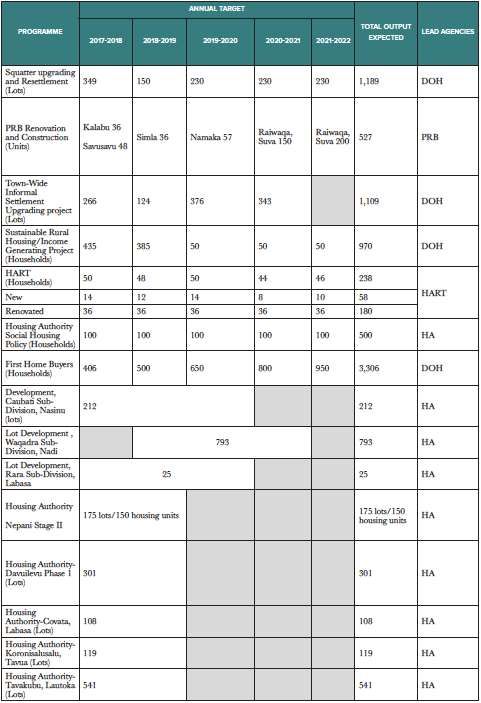
Appendix 3 .......................................................................................................................... 33

List of Tables
Table 1: Total Population by Urban and Rural, 1976-2017 .................................................... 5
Table 2: Average Household Income .................................................................................... 5
Table 3: Water Supply, Electricity Supply, and Toiletry Facility in Private Dwellings .............. 8
Table 4: Comparison of Housing Affordability between Fiji and Sydney (Australia) ............. 13
Table 5: Sale by Land Tenure ............................................................................................. 15
Table 6: Building Permits .................................................................................................... 16
Table 7: Future Housing Projects ........................................................................................ 16
Table 8: Distribution and Quality of Housing Stock in Fiji .................................................... 17
Table 9:Building Material Price Index .................................................................................. 17
Table 10: Home Loan Interest Rate .................................................................................... 21

List of Figures
Figure 1: Map of Fiji and its nearest metropolitan market ...................................................... 4
Figure 2: Squatter Settlement in Fiji ...................................................................................... 7
Figure 3: Informal Settlement distribution .............................................................................. 9
Figure 4: Suva City Scheme Plan........................................................................................ 10
Figure 5: Distribution of Residential Zone by Category........................................................ 11
Figure 6: Luxury resort in Fiji ............................................................................................... 11
Figure 7: Docile Distribution of Household Income .............................................................. 12
Figure 8: Contribution of Paid Employment by Geographical Area, 2014 ............................ 13
Figure 9: Residential Property Price Change ...................................................................... 14
Figure 10: Relationship between Completion and Yearly price increasing rate.................... 18

                                                                                                                                      3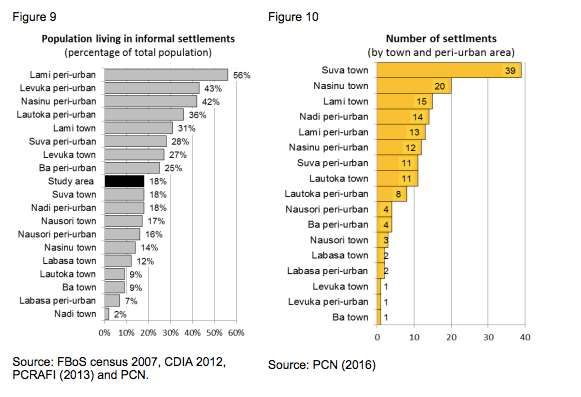
Introduction
This report provide information obtained from on-line sources, regarding the Fiji housing
market. This report will pay particular attention to the background of Fiji housing market,
state of the market, affordability programs, institutions involved and will highlight the
recommendations for the Fiji government.

The analysis of this report do have limitations due to lack of information.

Background
Fiji is one of the larger and more developed Pacific island countries that is nearly 3,000
kilometres (Figure 1) from major metropolitan markets. Tourism is the leading sector for
growth and sugar is the main stay of the rural area. Rural-urban migration is accelerating,
and the percentage of people living in the cities is expected to increase from 50% in 2013 to
60% by 2030. (ADB, 2014) In contrast with the circular process, which indicates that the
migrants would eventually return to the village after moving to towns, Connell and Lea (2002,
p.52) summarise that the modern urban migration has tended to be characterized by
permanent and relatively long-distance family movement. As shown in Table 1 (Fiji Bureau
of Statistics, 2018), the urban population is increasing decades by decades, while the rural
population is decreasing.

Figure 1: Map of Fiji and its nearest metropolitan market

Extracted from: https://www.distancefromto.net/, the exact distance between Brisbane and Fiji is 2786.12 km.

                                                                                                               4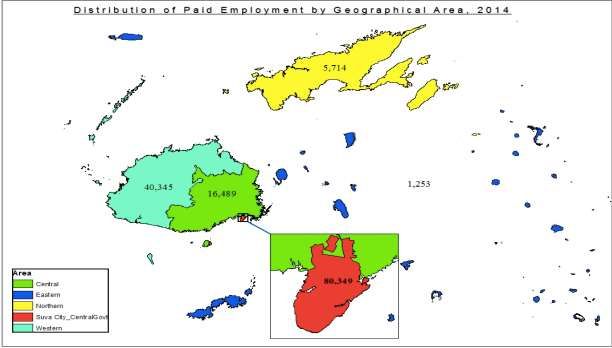
Table 1: Total Population by Urban and Rural, 1976-2017

The urban migration is probably resulted form the regional disparities. As shown in Table 2,
there is merely a 10% household income increase (-13% real increase) in the rural area
comparing with the 51% (19% real increase) in the urban area from 2002 to 2008. This is
caused by several influences: expiring sugarcane land leases and sugar price reduction; the
downfallen of garment industry; rising consumer prices; and low real growth in wages.
(Vunicagi, n.d.)

Table 2: Average Household Income

Extracted from Vunicagi, (n.d.).

With 50% of population residing in the cities and towns, close 20% of the urban population
lives in settlements that do not meets basic human rights physically, legally and socially; and
are highly vulnerable to climate change impacts. Despite some significant recent
government poverty alleviation policies, sometimes poor levels of coordination in urban
management have resulted in population growth in urban areas outstripping the supply of
serviced. This has resulted in a continuing expansion of informal settlements, many without
basic services, inadequate housing, insecure tenure, poverty and social exclusion from key
democratic and economic institutions. (People’s Community Network, 2018)

Land tenure
Fiji has three types of land holdings - Native Land, freehold land and Crown Land. Freehold
land can be bought and sold. Native Land and Crown Land cannot be bought and sold but is
available only on a leasehold basis. Leasehold land can be developed as much of it is

                                                                                             5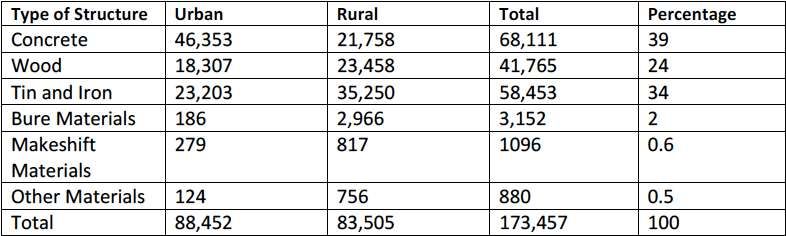
available on a long-term lease basis (often 99 years). (Department of Town & Country
Planning, n.d.)

•   Native Land

Approximately 83% of land in Fiji is Native Land. All Native Land belongs to village groups or
'land-owning units'. Leases of Native Land are available through the Native Land Trust
Board (NLTB), a statutory authority which administers all such lands on behalf of the Fijian
owners. All applications for leases of Native Land are made to the NLTB. Once an NLTB
lease has been issued, the land must go through a process of de-reservation before
development can take place.

•   Freehold Land

Approximately 10% of land in Fiji is freehold land which can be purchased, transferred, or
leased, subject to the conditions of the Land Sales Act.

•   Crown Land

Approximately 7% of land in Fiji is Crown Land, administered by the Department of Lands.
Like Native Land, Crown Land is not sold outright but some is available on a leasehold basis.
Crown leases are granted and managed by the Director of Lands.

Cities and towns in Fiji
Cities and towns provide many opportunities for development compared to more remote
sites. (Department of Town & Country Planning, n.d.)

In Fiji, cities and towns are not just any 'built-up' areas; they are specially declared areas that
have local City or Town Councils. Fiji has two cities and ten towns: Ba Town, Labasa Town,
Lami Town, Lautoka City, Levuka Town, Nadi Town, Nasinu Town, Nausori Town, Savusavu
Town, Sigatoka Town, Suva City, Tavua Town.

Rural areas
In Fiji, all land and any islands that have not been subject to survey or subdivision, including
former native reserves, are classified as Rural Areas. (Department of Town & Country
Planning, n.d.) Land in Rural Areas is a largely unknown quantity, and the most significant
challenge is to ensure development is appropriate. As applications for development are
made, environmental impact and other studies are required so the values and best use of
each area can be considered.

                                                                                                 6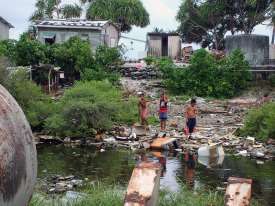
Informal settlement
Informal settlement refers to those who reside on freehold or state land with no legal title
(squatters) and who have made informal arrangements with owners to reside on native land.

Most informal settlements are on marginal lands, including flood-prone areas, unstable
hillsides, stream banks, and areas adjacent to rubbish dumps or industrial areas. The
construction materials are made of wood and tin that are usually recycled.

With the rapid rate of urban growth, informal settles grow faster than the plans for serviced
settlements, resulting in areas being poorly serviced, unhealthy, and frequently vulnerable to
natural hazards and disease. The houses are more temporary in nature, and often do not
comply with the existing building codes and regulations. Many households frequently share
water and power supplies, feeder roads are of very poor quality, and sewage connections
are often absent. (Vunicagi, n.d.)

Because informal settlements are not officially recognised, the residents have no rights to
the land, services or representation. (Phillips & Keen, 2016) In state lands, squatters occupy
land without the landlord’s consent, and to take advantage on a general knowledge that the
state will not evict them but providing alternative arrangement. On native land, many settlers
do not have any formal written arrangements, instead, only traditional arrangement,
‘vakavanua’ arrangement, is established. This make the settlers at risk of being evicted from
the land even though the chances are very rare. Those settles on the freehold land have the
highest chance of being evicted for illegally occupying and trespassing.
Figure 2: Squatter Settlement in Fiji

Extracted from http://www.roland-seib.de/Fiji-etc/slides/Fiji-etc-11-Feldmann-2006.html

Up till 2007, there are 10% of private dwellings don’t have safe water supply, 11% don’t have
electricity supply, and 0.7% don’t have toilet facilities.

                                                                                            7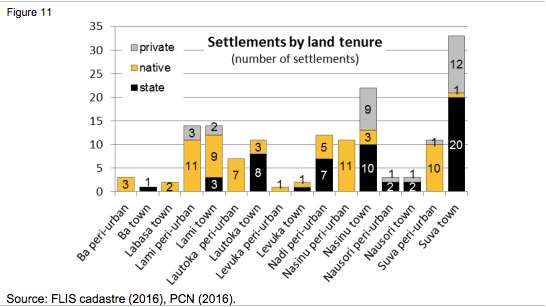
Table 3: Water Supply, Electricity Supply, and Toiletry Facility in Private Dwellings

(Fiji Bureau of Statistics, 2012)

From 1996 to 2003, the number of squatter settlement was estimated to increase by 73%.
By now, it is estimated that 140,000 people (15% of the urban population) are living in the
200 squatter settlements. (Vunicagi, n.d.)

As shown in Figure 3, 71% of the informal settlement resides in the metropolitan area, which
makes the housing shortage even more severe in the GSUA (Suva, Lami, Nasinu and
Nausori) area. (UN habitat, n.d.) In the greater Suva area, it is estimated that 16.4%

                                                                                          8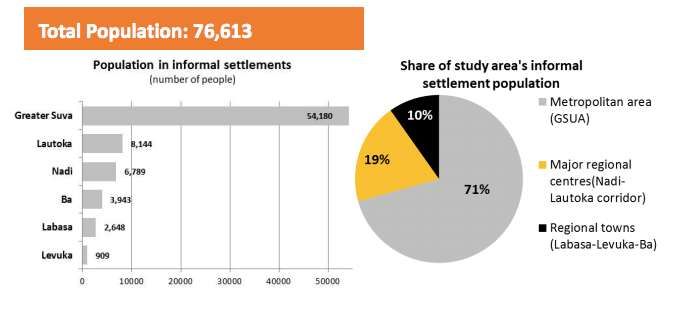
population are squatters, comprising 8,908 households of 58,508 people and the numbers
are expected to grow. (Mckinnon, et.al, 2007)

Figure 3: Informal Settlement distribution

                                                                                    9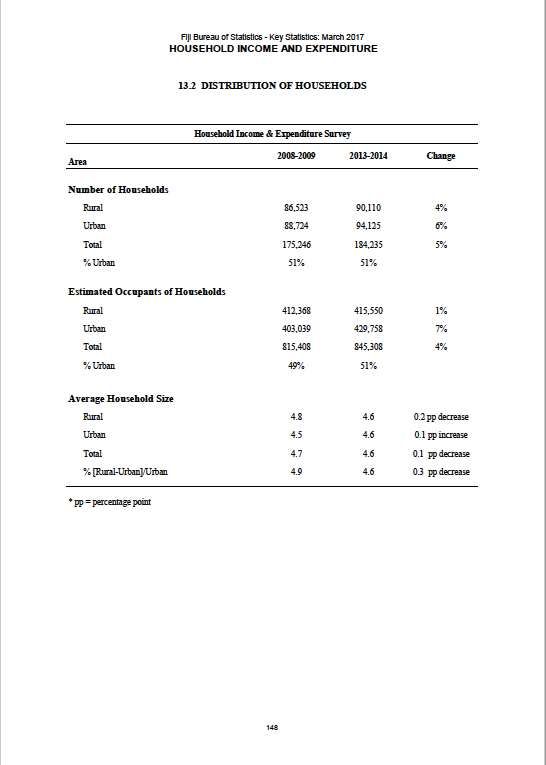
It can be clearly seen in Figure 4 that most of the land is used for residential purpose. The
Town Planning General Provision (1999) defines Res D specifically for the development of
low cost residential directed for low income earners and Res C for medium income earners.
In Suva City only 14% of the total residential developments is directed for low income
earners, the medium income earners accounts for 20%. The rest of the residential
development is for the high income earners.

Figure 4: Suva City Scheme Plan

                                                                                          10
Figure 5: Distribution of Residential Zone by Category
There are wide gaps between the income levels of rich and poor in Fiji. Although much of the
land in Fiji is collectively owned, it is controlled by tribal chiefs who derive most of the
economic benefit. (Nations Encyclopedia, n.d.)
Figure 6: Luxury resort in Fiji
11Picture extracted from https://homeadore.com/2015/02/16/laucala-resort-fiji/
It is also worth mentioning that after the cyclone Winston, there are tens of thousands
homeless in Fiji. Approximately 7.2% (62,400) of Fijians are in evacuation centres with many
staying relatives or in other places away from home. (Reuters, 2016)
Income level
The richest 10% households received 31% of total household income and the poorest 10%
households only received 3.2% of total household income. The top earns has approximately
10 times higher income than the lowest earners. This makes the low-income earners
impossible to compete with other buyers in the housing market.
Figure 7: Docile Distribution of Household Income
12Fiji Bureau of Statistics (2015)
Figure 8: Contribution of Paid Employment by Geographical Area, 2014
Fiji Bureau of Statistics (2015)
The state of Fiji housing market
Prices
As shown in Table 4 (Property Prices, 2018), despite the higher housing cost in Australia,
the costs per dollar in salary for Fijian’s are higher.
Table 4: Comparison of Housing Affordability between Fiji and Sydney (Australia)
Rent Per Month Fiji Australia Aus to Fiji
600.00 FJ$ 4,202.61 FJ$
+600.44 %
Apartment (1 bedroom) in City Centre (382.85 A$) (2,681.64 A$)
80.00% to salary 52.73% to salary -34.09%
250.00 FJ$ 3,030.34 FJ$
Apartment (1 bedroom) Outside of +1,112.14 %
(159.52 A$) (1,933.63 A$)
Centre
35.71% to salary 38.02% to salary +6.46%
3,754.55 FJ$* 7,260.64 FJ$
+93.38%
Apartment (3 bedrooms) in City Centre (2395.72 A$) (4,632.94 A$)
536.36% to salary 91.10% to salary -83.02%
1,016.00 FJ$ 4,889.87 FJ$
Apartment (3 bedrooms) Outside of +381.29 %
(648.30 A$) (3,120.17 A$)
Centre
145.14% to salary 61.35% to salary -57.73%
Buy Apartment Price
3,713.55 FJ$ 20,614.42 FJ$
Price per Square Meter to Buy +455.11 %
(2,369.58 A$) (13,153.85 A$)
Apartment in City Centre
530.51% to salary 258.65% to salary -51.25%
Price per Square Meter to Buy 2,260.00 FJ$* 13,197.88 FJ$ +483.98%
13Apartment Outside of Centre (1442.07 A$) (8,421.43 A$)
322.86% 165.59% -48.71%
Salaries
750.00 FJ$ 7,970.07 FJ$
Average Monthly Net Salary (After Tax) +962.68 %
(478.57 A$) (5,085.62 A$)
* Data is originally missing, filled in with data extracted from https://www.numbeo.com/cost-of-
living/country_result.jsp?country=Fiji
Table 4 illustrates the housing spending and salary between Fiji and Sydney. Even though
the renting and buying costs are higher in Sydney, the costs take less proportion of the
monthly salary. Fijians have to pay 80% of their salary to rent a 1-bedroom apartment in the
city centre. For families living outside of the city centre, the renting cost for a 3-bedroom
apartment is 145.14% of one person’s salary. The high cost placed a serious problem for the
Fijian household.
There is a serious income disparity in the Suva area that only certain elite group has the
access to the housing market. Majority of the population of Suva will need some form of
housing assistance. (Vunicagi, n.d.)
Figure 9: Residential Property Price Change
Extracted from Hassan (2007).
From 2001 to 2005, the average price of residential property has increased 102.63% from
$50,590 to $102,511. This indicate that there is a housing shortage in Fiji which may be due
to the high cost of building new houses or the difficulties of acquiring the building permission.
14Demand
With the increasing of number of household (Fiji Bureau of Statistics, 2017), there is more
demand for the real estate properties.
According to the National Business Review’s interview with Phillip Toogood, from Bayleys
Real Estate (Fiji), there is a rapidly developing shortage of waterfront property suitable for
the leisure market. (Robb, 2014)
The housing market is heating up in Namadi Heights. Harcourts senior sales consultant,
Jasmindar Singh said, “If I have 20 properties, those can be sold in two months.” The price
range is $300,000 to $450-000 at Namadi Heights, Mr Narayan said. (Arguliar, 2017)
Land demand
Analysis of the sales data at Table 5 suggests that a large percentage (46%) of the buyers
prefer to buy freehold properties than State and Native leases. The advantage of having
freehold land as compared to leases is that the owner is not liable to pay annual ground
rental on the land and the consent of the third party except local authority not needed for any
development. (Hassan, 2007)
Table 5: Sale by Land Tenure
Region Freehold State Native land Housing Authority
Central 587 127 134 273
Western 201 101 96 165
Northern 56 56 35 15
Total 844 284 265 453
Percentage 46% 15% 14% 25%
Foreign investors
Government has taken steps to make the local residential properties available for Fijians by
slowing the demand from foreign investors. The Minister for Finance, Aiyaz Sayed-Khaiyum
announced that a 10 per cent stamp duty will be charged on transfer for non-resident state
title property buyers and also a five per cent duty will be charged on mortgage for non-
resident strata title property buyers. (Lal, 2014)
Further, the Fijian government imposed retrospective laws on foreign landowners that shake
the confidence of foreigner investing in Fiji housing market. (Cooks Islands News, 2016)
15Supply
As a useful indicator of the supply of housing, the completion certifications issued in recent
year is 555, which is very little comparing to 184,235, the total household in 2014. The less
than 40% completion rate might be the result of the high construction standard. (Hassan,
2007)
Table 6: Building Permits
Estimated Percentage
Building Completion
Value of Completed
Period Permits Value [FJD] Certificates Value [FJD]
Work Put-in-
Issued [No.] Issued [No.]
Place [FJD]
2008 1,192 83,696 377 41,195 254,003 31.63%
2009 1,119 101,861 347 64,586 250,260 31.01%
2010 1,210 203,800 416 92,686 259,368 34.38%
2011 1,324 166,141 465 111,411 257,080 35.12%
2012 1,396 487,876 515 63,123 279,285 36.89%
2013 1,412 199,169 506 54,594 360,346 35.84%
2014 1,511 220,273 546 109,058 415,243 36.14%
2015 1,612 226,624 532 103,294 466,677 33.00%
2016 1,605 252,088 555 82,599 513,907 34.58%
Source: Fiji Bureau of Statistics, 2017
With the 1887 lots to be launched in the housing market by 2019 (Table 7), the pressure of
housing shortage remain unsolved.
Table 7: Future Housing Projects
Future Projects Total Land Land Tenure Tentative Date of Land Lots only
Area Delivery (tentative)
Central Makosoi Pacific 26.45 Acres Crown Land Yet to be confirmed 212 Lots
Western Waqadra
Harbour 90 Acres Native Lease End of 2016 to 2018 793 lots
Western Natadola 114 Acres Native Lease End of 2016 to 2019 380 Lots
Western Tavua 33 Acres Native Lease Yet to be confirmed 226 Lots
Western Tavakubu 106.6 Acres Crown Land End of 2016 to 2017 226 Lots
Western Tavakubu In-Fill 4 Acres Crown Land Yet to be confirmed 25 Lots
16Northern Rara End of 2018 25 Lots
Source: Housing Authority of Fiji, http://www.housing.com.fj/future-projects/
Based on a search at property.com.fj (access on 2/4/2018), there are only 35 residential
listings in Northern area, 1 residential for sale in Eastern area, 134 residential listings in
Central area and 571 residential for sale in western area. The supply in the housing market
is less than adequate comparing to the total number of household.
Table 8 indicates that 39% of houses are concrete structure; 24% are wooden structure; 34%
are made of tin and iron; bure, makeshift and other materials occupy 2%, 0.6% and 0.5%. It
seems the housing supply is relatively sufficient, however, there is no big difference between
the urban and rural house number. It means that with the urban migration, there must be a
lack of housing in the urban area.
Table 8: Distribution and Quality of Housing Stock in Fiji
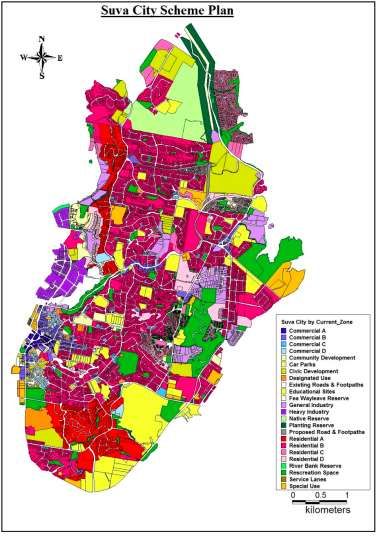
Cost of housing is composed of four items, material, labour cost, cost of service and cost to
develop vacant land. Comparing between Table 6 and Table 9, we can find a directly
proportional relationship between the cost and the completion certificates issued. Contradict
with Hassan (2007), the rising building material price will not negatively impact the housing
activities.
As a result of the rising building material prices, it is becoming impossible by the public
sector housing developers to service citizens with low-income earners. In the circumstances,
the ability to service the loan while maintaining living standards is difficult for an average
wage earner in Fiji. (Hassan, 2007)
Table 9:Building Material Price Index
17All Wood and Cement Iron Plumbing Paint Floor Door Electrical
Items Related and and ware and and and Products
Materials Related Steel Glass Wall Window
Materials Tiles Frames
[Base: June 2011 = 100.0]
WEIGHT 1000.0 73.4 375.9 94.8 79.5 79.8 64.7 101.0 130.9
2011 100.0 100.0 100.0 100.0 100.0 100.0 100.0 100.0 100.0
2012 101.5 101.3 101.6 99.0 101.6 100.1 96.2 101.5 104.5
2013 104.7 108.1 104.2 96.2 98.8 101.7 99.2 102.9 116.9
2014 106.9 112.7 108.9 97.7 99.1 102.6 98.1 103.1 117.9
2015 111.3 114.4 112.3 99.4 106.7 105.8 96.0 103.6 121.9
2016 107.2 108.5 106.4 96.5 100.2 104.9 89.7 100.4 117.2
2017 108.0 110.6 108.3 94.5 95.3 103.9 89.0 101.2 118.2
Source: Fiji Bureau of Statistics
580 0.05
560 0.04
0.03
540
0.02
520 0.01
500 0 Completion
480 -0.01 Yearly Price increasig rate
-0.02
460
-0.03
440 -0.04
420 -0.05
2011 2012 2013 2014 2015 2016
Figure 10: Relationship between Completion and Yearly price increasing rate
Future Development Plans
See Appendix 2.
Housing Affordability Programs
Social Housing Policy
In 2011, the Fijian government launched the “affordable and decent housing for all
communities by 2020” policy. This policy addresses constraints faced by public institutions
that primarily responsible for the provision of quality and affordable homes for people in the
urban and peri-urban areas.
18The board of Housing Authority of Fiji approved a housing loan rehabilitation policy that
assist Housing Authority customers, who own a home, however are finding it difficult to meet
their loan repayments due to retirement, sickness, unemployment and disability. The policy
will assist hundreds of middle and low-income families around the country.
The Prime Minister said “The policy will assist home owners by either writing off their full
loan amount remaining, partial loan write off and as a temporary measure, assist
unemployed citizens by freezing the interest and fees on the loan balance for up to 12
months.” (Housing Authority, 2011)
Since the policy was introduced in 2011, there are 309 families nationwide were assisted.
(Housing Authority, n.d.) Comparing with the total number of households, the ratio is only
less than 0.035%, which is much lower than Fiji’s poverty rate, 28.1%. (Fiji Bureau of
Statistics, 2013-2-14)
Government funding
Fiji government announced a major funding of 60 million in the 2017-2018 National Budget
for affordable housing through the Reserve Bank of Fiji, and the funding is aiming to
increase the home ownership in Fiji. The approved lenders will receive $10,000 if they’re
building their first residential home or $5,000 for those intending to buy their first home.
(Silaitoga, 2017)
The acting CEO of HFC bank, Raj Sharma, says that with the HFC new package, customers
will be able to take advantage of the 4.25% a year interest rate fixed for 5 years. The
qualified customer will need to have an annual income of $50,000 or less. (Bayshorefiji,
2017)
The total budget of the Ministry of Local Government and Housing in 2017-2108 is $33.9m,
comprising $6.6m for operating expenditure, $27.1 for capital expenditure and VAT of 0.2m.
By the end of 2018, there will be 478 affordable housing available, as $7m has been
allocated to subsidise the land development cost of two new subdivisions of the Housing
Authority in Nepani and Davuilevu. 300 families in Nabua are preparing to be relocated to
Waidra, Baulevu and $1.3m has been allocated under the Informal Settlement Relocation
Programme to assist with this relocation. $2.6m has been allocated to upgrade the Namaka
housing market and another $2.6m is allocated to redevelop the Govind Park. (Reece, 2017)
19Up to now, there are about 9,000 people on the Housing Authority of Fiji waiting list who are
qualified for the lot allocation criteria. (Turaga, 2018) To meet the requirements, Fijian
government need to fasten up the progress of housing developing.
Residential Housing Development Package (Affordable housing for ordinary Fijians)
Developers can benefit from this package by having profit exemption, subsidy grant, and
duty concession when they have a project size bigger than 20 units or 20 lots.
The institutions
Department of Town and Planning
In Fiji, any kind of development, including subdivision, construction, building and earthworks,
and proposals to change the use of existing buildings, require approval under the provisions
of the Town Planning Act and Subdivision of Land Act.
In certain circumstances, however, additional approvals may be required in order for a
development to proceed. Some of the most common are:
• Building Permits, which are required to certify the safety of proposed methods of
construction prior to any works being commenced.
• Environmental Impact Assessment, which must be undertaken and approved before
other permits can be granted for development that is large or in a sensitive area.
• Foreign Investment Approval, when a development involves significant funding from
non-Fiji sources.
The assessment processes for each type of application and different circumstances are
different, but there are several key components:
• Initial Review – to make sure the application form is correctly filled in.
• Local Authority Assessment – is assessed by technical staff of the local authority.
• Town and Country Planning Assessment - The Department of Town & Country
Planning provides technical and professional staff to assist the Director of Town &
Country Planning in executing the Subdivision of Land Act and Town Planning Act.
20Native Land Trust Board (NLTB)
NLTB manage the native land, which comprises 87% of all the land in Fiji. Public use of
native land is available by leasing. Leases can vary from 30 years for agricultural purposes
up to 99 years for most other uses (commercial, residential, etc).
The Department of Lands
The Department of Lands is responsible for the effective and efficient administration,
development and management of all crown land in Fiji. Activities under this programme
include surveying, mapping, land valuation, development and maintenance of state land and
geographic information system.
Housing Authority of Fiji
The housing authority of Fiji was established in 1955 under the Housing Act. It aims to
produce affordable and quality housing products and services by providing competitive loan
packages, service to low and middle income group, being socially aware and responsible
and excellent service to both customers and employees.
Public Rental Board (PRB)
PRB was established in 1989 under the Housing Act to take over from the Housing Authority
rental function. It provides affordable rental flats for low-income earners on a transition basis.
It is expected to operate on a commercial basis, but it is not required to make a profit. The
government provides a subsidy to top up any shortfall between the revenues generated by
the PRB and its cost.
The Housing Assistance and Relief Trust (HART)
The HART was established in 1970 by the Fiji Council of Churches. It is a charitable
organization that was initially formed to provide shelter for the destitute and now it provides
supports and services annually to about 800 families of mainly women and children who
have little or no regular source of income and rely on the department of Social Welfare for
financial assistance. HART provides services to empower individuals to become resourceful
and productive in order to secure a better life.
Local Banks
Except the Reserve Bank of Fiji, there are mainly 6 banks operates in Fiji. They are ANZ
Bank Fiji, Bank of Baroda Fiji, Bank of South Pacific Fiji, Bred Bank Fiji, HFC Bank Fiji, and
Westpac Bank Fiji. The home loan interest rate comparison among the banks is shown
below:
Table 10: Home Loan Interest Rate
21Home Loan Type ANZ BRED Baroda BSQ
Variable rate 6.99% p.a. 6.25% p.a. 6.15% p.a. 6.25% p.a.
1 year fixed rate 4.99% p.a. 4.45% p.a. 4.50% p.a. 4.50% p.a.
2 year fixed rate 5.45% p.a. 5.45% p.a. 4.50% p.a. 5.45% p.a.
The foreign institutions
ADB
As of 31/12/2016 (ADB, 2016), ADB has loaned Fiji 576.6 millions US dollars. The water and
other urban infrastructure and services section took 25.73% of it, 148.34 million.
ADB had launched a low-income housing development project in 1980s. The project was
initiated in response to the housing shortage in the urban area for low-income families in Fiji
during 1980s. The project was finished three years later than expected. The housing
authority of Fiji was able to produce and sell targeted number of lots and disburses the
project’s mortgage finance. Though this is achieved by focusing on better-off families who
can afford not by reducing housing cost. (ADB, 1999)
Chinese Government and Firms
In 2008, the Housing Authority of Fiji invite three Chinese firms to develop low-cost housing
project that cost around FJ$55 million. (Pacific Island Report, 2008)
Fiji’s ambassador to China, Sir James Ah Koy secured a 230 million dollar soft load in the
housing agriculture, and commercial projects in 2008
In 2010, the Chinese government provided Fiji a 50 million dollar loan to build around 2,000
low-cost housing units.
Chinese government had taken out 285 million Fiji dollars concessional loans to upgrade
major road links, build new public housing projects and enhance information technology
capabilities in 2011.
There are 50 million dollar low-cost housing project and 2 million dollar low-cost building
project completed in 2008. In the following years (2009-2011), there are also many housing-
related projects finished. (Lyu, n.d.)
22Discussion and Conclusion
Fiji has approximately 83% of land owned collectively by the village groups or ‘land-owning’
units. Even though the native land cannot be bought or sold, leases can be made through
NLTB.
The high construction cost and lack of available development land in Fiji make 35% of
Fijians living in the informal settlements. Most of the informal settlements are on marginal
lands, which are frequently vulnerable to natural hazards and diseases. After the cyclone
Winston, there are at least 7.2% of Fijians homeless.
The previous social housing policy is not very successful that only 0.035% families nation
wide were assisted. ADB also introduced a low-income housing development project.
However, instead of helping the aimed low-income group, the better-off families who can
afford are benefited.
The fast rising housing price makes it even more difficult for the low-income to start owing a
legal property.
Government can solve this issue by improving the regulatory environment and introducing
more policies in favour of the poor, ethnic minorities, women and the Disable. Additionally,
the government may seek foreign firms for cooperation.
There are several challenges for the Fijian government to take to solve the housing shortage
problem.
PPP (Public-private partnership)
Fiji can follow the steps of the developed country precedents to attract private institutional
capitals into affordable housing. England uses a mixed public grant and private sector
funding model; USA applies the low income housing tax credit model; Switzerland has the
specialist intermediary issuing government guaranteed bonds; Netherlands has loan
guarantees from a government backstopped intermediary; Austria issues the housing
construction convertible bonds; and France has pooled savings scheme based on low
interest, tax advantaged saving accounts. The common factor above is that partnership
between public, non-profit and private sectors is essential for the successful funding and
delivery of housing supply programs. (Hooker, 2014)
Land availability for development and secure the land tenure
Investors are seeking to have a sense of security when they make the purchase. So the
credibility of the deed of cession must be honoured.
23Improve Poor reliability of government
The government sector needs to provide greater policy certainty, and more conductive
environment for foreign investments. (ADB, 2014)
Supporting the disadvantaged groups
The provision of land for the poor, ethnic minorities, women and the Disable need to be
recognized. Government authority should be both practicality and fairness of land allocation.
(United Nations, n.d.)
Creating awareness of the deed of Cession
Prevention of squatters, land speculation and land disputes. It is also beneficial to monitor
the suspicious area that are prone to the squatter development.
Low cost alternative living arrangement
There can be more small-dwelling size apartments for the young families.
Developers can provide tenants the mixed ownership, which the tenants can partially buy the
house and pay rent to the developers.
Restrictions and policies on the developers
Government can provide tax incentives to the developers that promote low-cost housing.
Further, the government can force the developers to sell at least certain percentage (for
example, 50%) of their houses to the low-income owners by sign contracts with the
developers.
Cut the number of government institutions and clarify the legislation
The housing legislation is administrated by various government institutions. This imposes the
fragmented issue on the developers and households. It is better to have a clear instruction
for both groups.
24Reference
ABC News. (2017). Retrieved from: http://www.abc.net.au/news/programs/pacific-beat/2017-
02-24/35-per-cent-of-fijians-live-in-squatter-camps-says/8302076
ADB. (1999). Project Performance Audit Report on the Low-income Housing Development
Project in the Republic of the Fiji Islands.
ADB. (2014). Country Partnership Strategy: Fiji 2014-2018. Retrieved from
https://www.adb.org/sites/default/files/institutional-document/150684/cps-fij-2014-2018.pdf
ADB. (2016). Cumulative Lending, Grant, and Technical Assistance Approvals. Retrieved
from https://data.adb.org/dataset/cumulative-lending-grant-and-technical-assistance-
approvals
Arguliar, M. (2017). Demand Up for Suva Properties. Retrieved from
http://fijisun.com.fj/2017/07/29/demand-up-for-suva-properties/
Bayshorefiji. (2017). Retrieved from: https://bayshorefiji.wordpress.com/2017/09/08/new-
home-loan-package-launched-by-hfc-bank/
Cook Islands News. (2016). Fiji land laws imposed on foreign owners. Retrieved from:
http://www.cookislandsnews.com/regional/item/62210-fiji-land-laws-imposed-on-foreign-
owners/62210-fiji-land-laws-imposed-on-foreign-owners
Department of Town and Country Planning. (n.d.). Emerging Tural Areas. Retrieved from
http://www.townplanning.gov.fj/index.php/planning/planning-issues/emerging-rural-areas
25Department of Town and Country Planning. (n.d.). Growth of Cities and Towns. Retrieved
from http://www.townplanning.gov.fj/index.php/planning/planning-issues/growth-of-cities-
towns
Department of Town and Country Planning. (n.d.). Land Tenure. Retrieved from
http://www.townplanning.gov.fj/index.php/planning/planning-issues/land-tenure
Fiji Bureau of Statistics. (2012). 2007 Fiji Census of Population and Housing Analytical
Report.
Fiji Bureau of Statistics. (2013-2014). Retrieved from:
http://www.statsfiji.gov.fj/component/advlisting/?view=download&format=raw&fileId=1381
Fiji Bureau of Statistics. (2015). 2013-14 Household Income And Expenditure Survey.
Fiji Bureau of Statistics. (2015). Provisional Annual Paid Employment 2014
Fiji Bureau of Statistics. (2018). Statistical News. Retrieved from
http://www.statsfiji.gov.fj/census
Hassan, A. (2007). National Overview of Housing in Fiji. Paper presented at The 13th Annual
Conference of the Pacific Rim Real Estate Society, Curtin University of Technology, Perth,
Western Australia.
Hooker, J. (2014). Australia’s Essential Housing Crisis. Submission to the Senate Stading
Committee on Economics Inquiry into Affordable Housing.
26Housing Authority. (2011). Retrieved from: http://www.housing.com.fj/social-housing-policy-
to-assist-home-owners/
Housing Authority. (n.d.). Retrieved from: http://www.pacificsoedata.org/fiji/state-owned-
enterprises/housing-authority/
Lal, R. (2014). Steps Taken To Curb Foreign Demand For Local Residential Properties.
Retrieved from http://fijisun.com.fj/2014/11/23/steps-taken-to-curb-foreign-demand-for-local-
residential-properties/
Lyu, G. (n.d.) China’s development aid to Fiji: motive and method. Retrieved from:
https://www.victoria.ac.nz/chinaresearchcentre/programmes-and-projects/china-
symposiums/china-and-the-pacific-the-view-from-oceania/24-Lyu-Guixia-Chinas-
Development-Aid-to-Fiji-Motive-and-Method.pdf
McKinnon, J., Whitehead, S., Chung, M., & Taylor, L. (2007). Report of the Fiji Informal
Settlements Scoping Mission. Wellington: New Zealand Agency for International
Development.
Ministry of Economy, Republic of Fiji. (2017). 5-Year & 20-Year National Development Plan
Transforming Fiji. http://www.fiji.gov.fj/getattachment/15b0ba03-825e-47f7-bf69-
094ad33004dd/5-Year---20-Year-NATIONAL-DEVELOPMENT-PLAN.aspx
Nations Encyclopedia. (n.d.) Fiji- Poverty and wealth. Retrieved from:
http://www.nationsencyclopedia.com/economies/Asia-and-the-Pacific/Fiji-POVERTY-AND-
WEALTH.html
Pacific Islands Report. (2008). Chinese Firms to Bid on Low Cost Housing in Fiji. Retrieved
from: http://www.pireport.org/articles/2008/05/01/chinese-firms-bid-low-cost-housing-fiji?qt-
article_tabs=0#qt-article_tabs
27People’s Community Network. (2016). Fiji Informal settlement situation analysis. Retrieved
2/4/2018, from https://pcnfiji.files.wordpress.com/2017/06/pcn_unhpsup_ssa_final_report.pdf
Phillips. T. and Keen. M. (2016). Sharing the City: Urban Growth and Governance in Suva,
Fiji. SSGM Discussion Paper. Australian National University.
Property Prices. (2018). Retrieved from: https://www.numbeo.com/property-
investment/compare_cities.jsp?country1=Fiji&country2=Australia&city1=Fiji&city2=Sydney
Reece, L. (2017). Government boost home ownership for Fijian. Retrieved from:
http://fijivillage.com/news/Government-boosts-home-ownership-for-Fijian-people-kr25s9
Reuters. (2016). Tens of thousands of Fijians homeless after cyclone: disaster agency.
Retrieved from: https://www.reuters.com/article/us-cyclone-fiji/tens-of-thousands-of-fijians-
homeless-after-cyclone-disaster-agency-idUSKCN0VY0HH
Robb, J. (2014). Fijian property market offers opportunities. Retrieved from:
https://www.nbr.co.nz/article/fijian-property-market-offers-opportunities-ns-164773
Silaitoga, S. (2017). $60 million for affordable housing. Retrieved from:
http://www.fijitimes.com/story.aspx?id=406781
Turaga, S. (2018). About 9,000 people currently on the Housing Authority of Fiji waiting list
for lot allocation. Retrieved from: http://fijivillage.com/news/About-9000-people-currently-on-
the-Housing-Authority-of-Fiji-waiting-list-for-lot-allocation-52kr9s
United Nations. (n.d.) Retrieved from:
http://www.un.org/esa/agenda21/natlinfo/countr/fiji/land.pdf
UN Habitat. (n.d.) Fiji Informal Settlement Situation Analysis. Retrieved from:
https://www.planning.org.nz/Attachment?Action=Download&Attachment_id=4128
28Vunicagi, K. (n.d.) Social Housing in Fiji Is Social Housing applicable for the poor and low-
income onlyor does it include other levels of income earners? University of Porto, Porto,
Portugal.
29Appendix 1
30Appendix 2
31http://www.fiji.gov.fj/getattachment/15b0ba03-825e-47f7-bf69-094ad33004dd/5-Year---20-
Year-NATIONAL-DEVELOPMENT-PLAN.aspx
32Appendix 3
I am not sure whether to put it in the report.
The supply number is the completion certificate issued.
I couldn’t find the report that the author cited for the demand.
http://www.prres.net/papers/Hassan_National_Overview_Housing_Fiji.pdf
33You can also read