CITY OF TSHWANE: DEVELOPMENT CHALLENGES
←
→
Page content transcription
If your browser does not render page correctly, please read the page content below
CITY OF TSHWANE: DEVELOPMENT CHALLENGES
                                        J W M CAMERON and M N KRYNAUW∗

                          TRC Africa (Pty) Ltd. P O Box 95230, Waterkloof, 0145
                 ∗City of Tshwane Metropolitan Municipality, P O Box 6338, Pretoria, 0001

ABSTRACT

This document was prepared as background information for newly elected Councillors of the City
of Tshwane, to highlight the development challenges that they will face in the coming five years. It
has been modified slightly for the CODATU SEMINAR ON THE SOCIAL ASPECTS OF
TRANSPORT but remains a presentation, rather than a paper. To this end, its focus is on
illustrations of the spatial development of the city. The text is written in plain language and is
deliberately non-technical.

A sub-theme for the presentation could well be, “City of Tshwane: A Tale of Two Cities”. This is
because there is a stark contrast between the southern half of the city, which is populated by people
who are relatively affluent, and the north, in which most of the residents are disadvantaged. The
contrast shows up in voting patterns, incomes, demographics and the transport and travel
characteristics of the population. Most South African cities have similar characteristics but the
development challenges in Tshwane are more extreme, owing to long commuting distances.

Metropolitan Tshwane extends across the borders of Gauteng into North West Province. Until there
is commitment to the full devolution of powers and functions to municipal government, the
fragmentation of roles and responsibilities between, national, provincial and local government will
challenge the ability of municipal government to deliver services. This applies particularly to
transport. In the paper, reference is made to the relatively uncoordinated plans and actions of the
South African National Road Agency (SANRA), the South African Rail Commuter Corporation
(SARCC,) provincial transport departments (roads and public transport) and municipal transport
departments. All these agencies serve different masters and have their own, often conflicting,
objectives and agendas.

At the heart of development and service delivery problems is the challenge associated with the
assignment of fiscal powers, political accountability for the execution of functions within those
powers and the political will to make decisions that will be socially just, sustainable and cost-
effective.

Apart from institutional and financial problems, the main challenge to politicians will be to approve
Integrated Development Plans that are realistic and practical, yet acceptable to the voting public.
Even in the medium-term, it will not be acceptable to prioritise development and services delivery,
largely in favour of the disadvantaged, at the cost of ratepayers. On the other hand, developer-led
decentralisation is not sustainable and should not be encouraged, even if developers are willing to
pay a premium for development and services. As is demonstrated in the presentation,
decentralisation in Tshwane has already severely damaged the public transport system.

20th South African Transport Conference                                               South Africa, 16 – 20 July 2001
‘Meeting the Transport Challenges in Southern Africa’                              Organised by: Conference Planners
Conference Papers                                                 Produced by: Document Transformation Technologies
BACKGROUND

In 1999 the then Greater Pretoria Metropolitan Council undertook a representative survey of 7 500
households in Tshwane Metropolitan Area, which provided information to enable its Land-use and
Planning Directorate to carry out its duties. The summaries of some of the information contained in
this presentation provide the Executive Mayor and Councillors with valuable insights about the
challenges they face in the coming five years.

The survey was a sample, which is representative of:

      •   Population groups;
      •   Gender;
      •   Income groups; and
      •   Areas of the municipality.

This presentation contains some key facts in the form of maps, graphs and tables, which “paint a
picture” of the characteristics of Tshwane and the development challenges to be faced by the
Council. The information is presented for strategic areas of the city but can also be queried by
groups of wards, to inform Councillors about conditions in their areas of responsibility. For
example:

      •   How many households live in shacks?
      •   How many people are unemployed?
      •   How many families live below the Poverty Datum Line (PDL)?
      •   What is the level of car ownership and use in the ward?
      •   How do people travel to work and school?
      •   What are the main transport problems for residents?
      •   Are the residents satisfied with public transport services?
      •   With what aspects of public transport are they least satisfied?

These, and other questions, form the basis of this presentation for the Tshwane metropolitan
municipality as a whole.

CITY OF TSHWANE – A “TALE OF TWO CITIES”

All political parties will acknowledge that the main challenge facing the Tshwane Metropolitan
Minicipality will be service delivery. This applies to both rich and poor residents of the city, who
will define service delivery in different ways. Wealthy ratepayers will expect “value for money”
while the underprivileged will expect “affordable services” and improved “access to services and
amenities”.

The political composition of Tshwane reflects the differences between rich and poor. As seen
opposite, voting patterns reveal the impact of Apartheid on the city.

      •   With the exception of the central business district (CBD), all the ANC wards are in the
          north or on the periphery, where the population is mainly Black. The problems and needs
          of people in these wards are largely associated with poverty: unemployment or low
          incomes, and inaccessibility to jobs, activities, services, amenities and even housing in
          some cases. As a result, ANC voters will expect service delivery to reflect these needs.
• The DA wards are all in the central and southern parts of Tshwane where the population
is largely White and relatively wealthy. Residents have good access to economic
activities, sporting and recreational facilities, services and amenities. DA voters will
expect service standards to be maintained, especially if rates and tariffs are to be
increased.
• The only Independent ward is in Mamelodi South, an area of informal housing. Perhaps
this result signals a warning about future non-delivery of services.
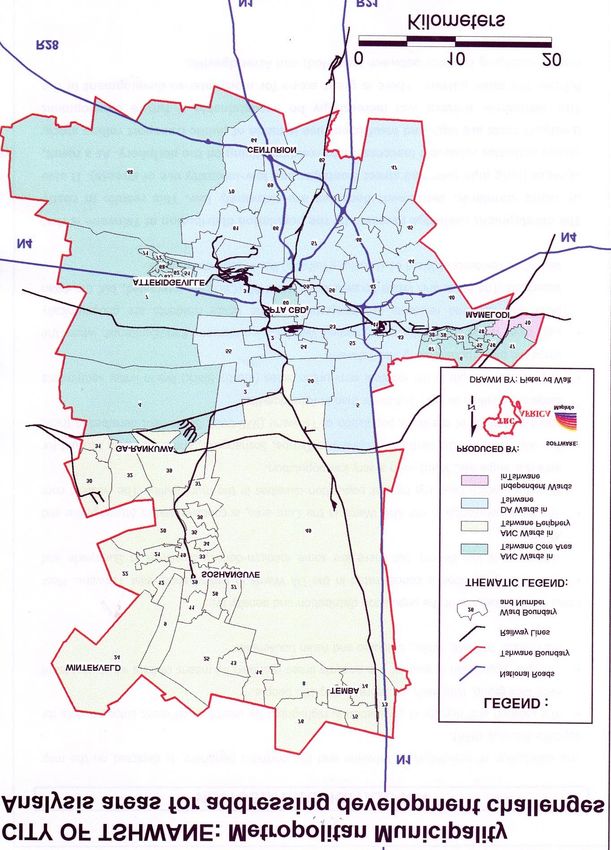
This presentation provides information relevant to development issues and challenges in the
different parts of the city. The analysis areas used are large, but highlight differences between ANC
and DA wards and between central and remote (peripheral) ANC wards. The contrast between the
latter two areas, highlights the importance of transport services to residents of the city for access to
activities and amenities. The characteristics of the semi-urban areas of North West Province, which
are dependent upon Tshwane, are also provided (see map on following page).
POPULATION DISTRIBUTION
The distribution of population in Tshwane and the northern periphery, is depicted on the map
opposite (Census 1996).
• The location and density of population is highlighted by means of different coloured dots
for each race group, with each dot representing 100 people.
• The total population in each of five analysis areas is shown by means of bars, which
represent the number of Black, White, Coloured and Asian households.
Some notable features of the population distribution and density are:
• The White population is concentrated in the DA Wards in central-south-east Tshwane.
Most settlement is low density but there are some medium-density dwellings in Sunnyside
and Arcadia.
• The Black population in the ANC Wards in the Core area, is concentrated in
Atteridgeville and Mamelodi, which have the highest population densities in the
municipality. The western core area is a single ANC Ward, with a very low population.
• The ANC Wards in the northern periphery in Temba, Soshanguve, and Garankuwa
account for about two thirds of the Black population of Tshwane (975 000). Settlement
densities in these areas are medium to high, but lower than in Atteridgeville.
• The 125 000 people in the external semi-urban areas (mostly Black) live in linear
settlements along the main roads leading into Tshwane.
• Only three wards are racially mixed, namely Ward 43, Jan Niemand Park/Eersterust,
where the Black and Coloured residents are integrated but the White residents are
geographically separated. The Black and White households in Ward 60 (CBD) are
integrated, but the Asian and White residents of Ward 61 (Laudium/Valhalla) live in
separate suburbs.
The development challenge revealed by the population distribution of Tshwane is that by world
standards, settlement densities are extremely low. This results in costly services (long pipe runs and
street frontages and low-intensity use of streets). It also makes activities relatively inaccessible to
residents living on the periphery. As a result, transport costs are high and insufficient use is made of
public transport rolling stock.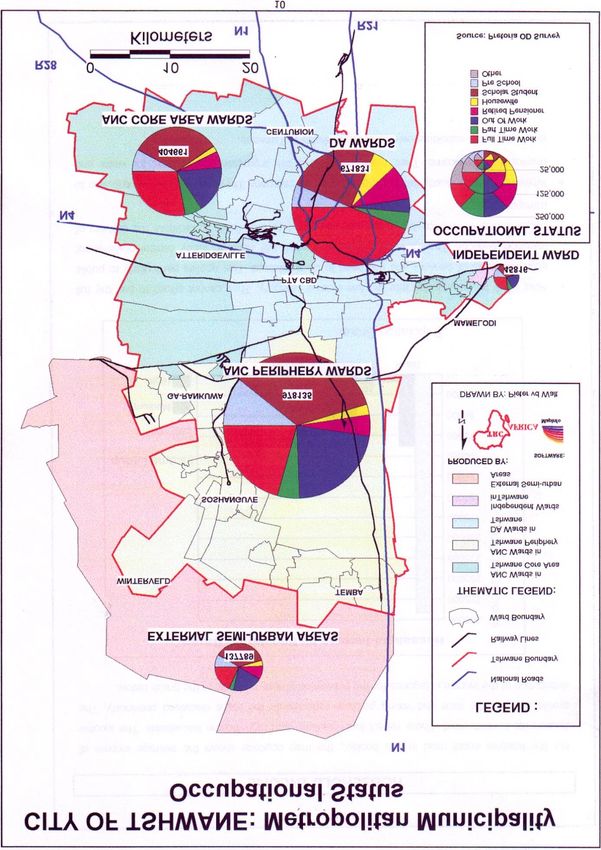
The current settlement pattern will be increasingly unsustainable, particularly if future development
continues the decentralisation trend. There is great scope for more intense development in the
rapidly changing corridor between Mamelodi and Atteridgeville, which is viable for the
development of public transport services.
EMPLOYMENT DISTRIBUTION

Existing employment centres in Tshwane are shown on the map opposite. The main features of the
employment pattern are:

      •   Most jobs are in the central and south-eastern region of the city and very few Whites work
          outside this region.

      •   The work places of Black employees are scattered throughout Tshwane, although the
          majority of jobs are in the centre and south-east.

      •   There are relatively few jobs (less than 128 000) in the ANC wards in the core of the city,
          mostly in the CBD, Mamelodi and Atteridgeville. The majority, (63%) are taken by Black
          workers.

      •   Work places in the ANC Wards in the northern periphery are out of proportion to the
          population: (47% of the population live in this region, which has only 10% of the jobs in
          Tshwane).

      •   There are very few jobs in the external area to sustain the 140 000 residents. They mostly
          travel to work in Tshwane.

      •   The main work locations are Rosslyn, Pretoria North, Pretoria West, the Inner City,
          Hatfield, Waltloo and Centurion. The N1 is increasingly attracting jobs, for example to
          Menlyn.

The distribution of jobs in Tshwane and the pattern of unemployment (see map on page 10) indicate
that there are insufficient jobs to sustain the disadvantaged residents of the northern periphery. The
mostly Black workers on the periphery have to travel long distances to their work places in the
centre and south-east.

The resultant development challenges are obvious. Tshwane Metropolitan Municipality will need
to adopt proactive land use policies, such as zoning and a review of development rights, and apply
investment incentives (differential rates) to attract economic activity to the northern regions of the
city. The Council will, thus, need to “horse-trade” with developers.

While developers create jobs and provide rates income, pandering to their needs often results in
hidden costs, which impact on all residents. The Menlyn development, for example, has created
congestion, resulted in blight in some residential areas and lured much business away from the inner
city. Unlike the CBD, Menlyn is inaccessible to the under-privileged, who depend on public
transport. It is resulting in demands for additional costly road space and road improvements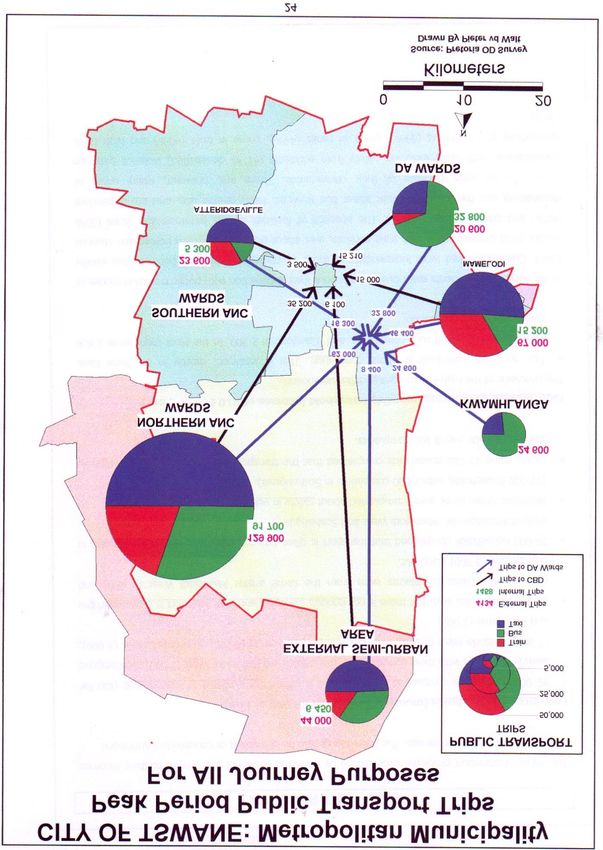
OCCUPATIONAL STATUS AND UNEMPLOYMENT

The occupational status of Tshwane residents is shown in the figure opposite. The Economic
Development, Safety and Security and Social Development Directorates of the Tshwane Municipal
Council. are responsible for poverty alleviation, economic empowerment, SMME support, crime
prevention, emergency services, sports and recreational facilities. The following observations are
pertinent to these directorates

      •   In the centre and south-east, nearly half of the population of 670 000 are in full or part-
          time employment (red and green slices of the cake). Very few adults are out of work
          (royal blue slice).

      •   Only about a quarter of the population of the ANC core (Mamelodi, Atteridgeville and the
          CBD) and northern peripheries (Soshanguve/etc) are in full or part-time employment. The
          level of unemployment averages 40 percent of all economically active adults and 20
          percent of the population as a whole.

      •   There are many more pre-school and schoolchildren in the peripheral areas, which are
          mostly Black communities. Between one third and half of the population are 18 years or
          younger (brown and grey slices of the pie).

The numbers of employed and unemployed persons and children in each population group in
Tshwane are shown on the graph below.

                                          Occupational Status of Household Members by Race
                                 800000
              Number of People

                                 700000

                                 600000

                                 500000

                                 400000
                                                                                       Category
                                 300000                                                      Employed

                                                                                             Unemployed
                                 200000
                                                                                             Retired

                                 100000                                                      Housewife

                                     0                                                       Children
                                              Black     White     Coloured    Asian

                                          Population Group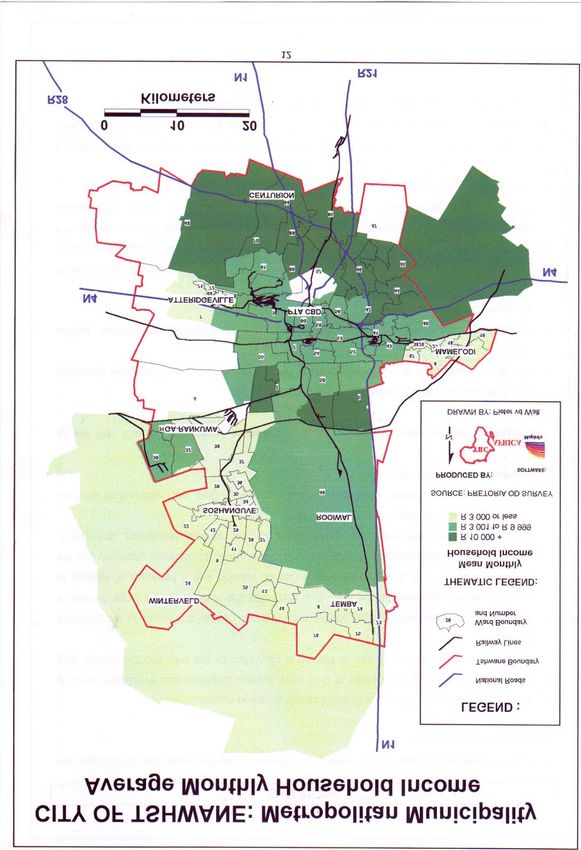
HOUSEHOLD INCOME
For the analysis areas used in this presentation, the map opposite shows the average income of
households in each ward. These reflect low- medium- and high-income households. The income
profile matches the race and voting patterns reflected in the maps discussed previously. The
distribution of the income categories for the population groups is shown in the graph below.
Household Income by Population Group
No of Households
300000
275000
250000
225000
200000
175000
150000
125000
100000 Income Group
75000 Low
50000
Medium
25000
0 High
Black White Coloured Asian
Population Group
• Most Black households fall into the low-income category. They cannot afford to pay the
full economic costs of services and will need to be subsidised. This applies particularly to
public transport services. The Tshwane Municipality will need to lobby central
government (Departments of Finance and Transport) to commit subsidy funds to facilitate
the delivery of transport services.
• White households mostly fall into the high-income category. They make a large
contribution to municipal rates income. Their rates income and the progressive tariffs paid
for water and electricity, cross-subsidise service provision to low-income households in
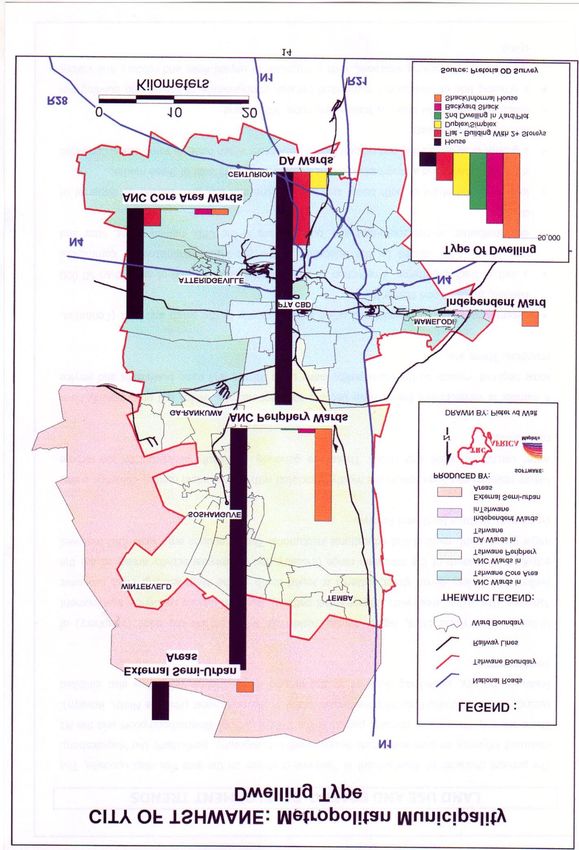
Tshwane.HOUSING
The type of dwellings occupied by the residents of Tshwane in the five areas used for analysis, are
shown in the map opposite.
• In all areas, most households live in single storey detached houses.
• Higher density dwelling types (Flats of 2 or more storeys, Duplexes and Simplexes) are
only found in the centre and south-east in the wards controlled by the DA., and the
Central Area (ANC).
• The majority of backyard shacks, shacks and informal houses are found in the northern
periphery wards controlled by the ANC. It is likely that the reasons for the large number
of informal houses in this area include both a historic backlog and a tendency of families
to migrate from the rural periphery. Migration tendencies are likely to continue, especially
into the south because the core area offers good access to jobs, schools, technicons,
universities, medical facilities, shopping, recreational and other facilities.
• Dwellings in the independent ward are mostly of the informal type, with rudimentary
services, possibly explaining the voting choice of residents.
The housing development challenge for the Tshwane Municipality will be as follows:
• the type and density of housing;
• the identification of accessible locations for redevelopment and for new housing; and
• making the location of housing complementary to existing under-utilised public transport
.
In adopting a vision for the future development of the city, the Tshwane Municipality would be
advised to consider the choices already being made by residents. The occupation by Black singles
and families of flats and other high-density dwellings in the Central Business District (CBD),
Sunnyside and Arcadia, indicates that for some, these may be the dwelling types of choice. This
applies particularly if such dwellings are close to work areas, good public transport and other
facilities.
The observed choice of accessible high-density housing, suggests that the municipality should adopt
a more diverse housing delivery vision, to facilitate the servicing and development of multi-storey
dwellings in the inner city, close to existing train services and activity centres. Vacant office blocks
could be converted into high density housing, at relatively low cost.LAND USE AND SPATIAL DEVELOPMENT TRENDS
The present character of development in Tswhane is shown on the land use map opposite. The
dominant influence on past and future development is topography, particularly the Magaliesberg.
There are only three major crossing points through the Magaliesberg, one national, one provincial
and one municipal, Derdepoort (N1) at the Theo Martinspoort (PWV 9), and Wonderboompoort.
This has “choked” development, particularly in the north-west (Pretoria North, Rosslyn). South of
the city, underlying dolomite in and around the Fountains Valley has also inhibited development.
Unlike in most world cities, denser settlement is on the edge (periphery) of Tshwane (the yellow
areas with a dense street pattern). Most low density residential development (yellow with a less
dense street pattern) is found south of the Magaliesberg. Most economic activity is also south of the
mountain range (industry and commercial activity areas) as are the major government, medical and
educational institutions. The exceptions are Akasia CBD (not developed to its full potential),
Pretoria North and Rosslyn.
Nature reserves and open spaces are mostly associated with the mountain ranges, dolomitic areas,
water catchment areas and rivers. These are generally not easily accessible to low-income
communities.
A number of development trends have become apparent recently, which will progressively have
some negative impacts on the municipality, many of its citizens and some businesses and service
providers. These are:
• uncontrolled decentralisation of commercial and office activity driven by market forces,
mostly to the south and east (Centurion, Hatfield, Brooklyn and Menlyn);
• a shift of trading patterns, a reduction of trade turnover and the loss of more than 50 000
jobs in the CBD caused by the relocation of the provincial administration, commercial
decentralisation to the south-east and ‘push’ factors in the CBD, namely crime, litter and
decay;
• loss of market share of both buses and trains to the mini-bus taxi, caused by dispersal of
economic activity and a progressive decline in the service standards of these modes;
• a growth of street trading and other informal businesses which have, in some cases,
“crowded out” formal businesses;
• invasion of residential areas by traders and home offices; and
• a growing tide of lawlessness manifested through infringements of zoning and building
by-laws, traffic and parking violations, with a mountain of unpaid fines and robbery and
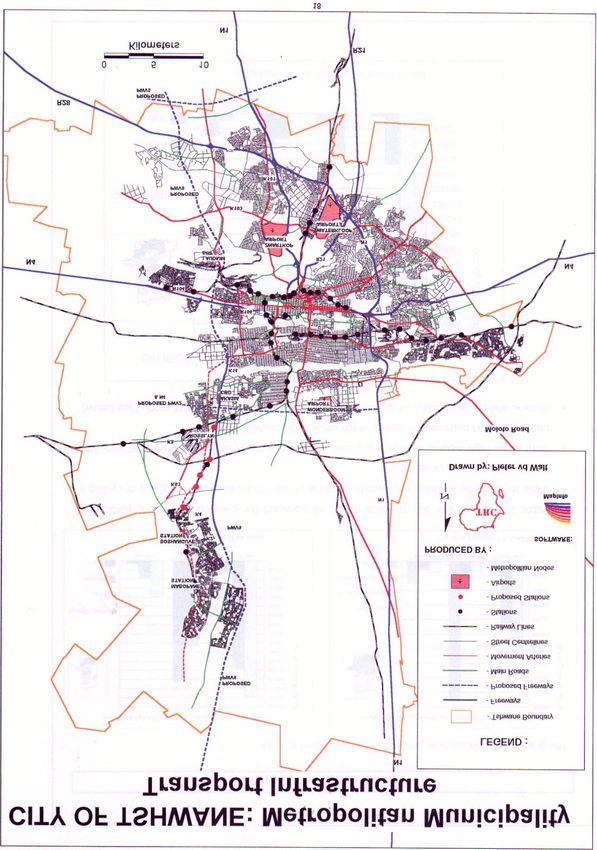
violent crime.TRANSPORT INFRASTRUCTURE The map on the opposite page shows the infrastructure, which gives shape to Tshwane, links it with surrounding areas and enables the citizens to move around inside the city. The rail system largely serves captives to commuter passenger movements. Road hauliers have largely captured the freight market. Only the heavy industrial areas of Pretoria West, Waltloo and Rosslyn are served by rail freight. Long-distance passenger services run from Pretoria Station daily to Johannesburg and twice-weekly to Cape Town and Durban. The commuter services mainly operate from Soshanguve/Mabopane in the north, from Atteridgeville in the west and from Mamelodi in the east. The southern line carries some commuters to the city from Johannesburg, Kempton Park and Tembisa. It also carries a few Tshwane commuters southwards to work in Olifantsfontein, Kempton Park and Johannesburg. The freeway system moves long-distance freight and passenger traffic to the surrounding areas such as Johannesburg and the International Airport (JIA). Freeways are either national (N) or provincial (R or PWV) roads. The south and east of the city are well served by the N1, N4, R21 and R28. These roads have contributed to the rapid development of the south-east, (e.g. Centurion, Constantia Park, and Menlyn), in a manner, which has not been complementary to the city’s public transport system, particularly rail. The traffic generated by the freeways, has resulted in the need for investment in complementary and connecting arterial roads, which has been to the account of the municipal council/s. Development of the south-east has been at low density, largely for high-income car owning households, which does not encourage the development of public transport services. The map shows proposed new national and provincial freeways in the north (N4/PWV2) and west (PWV9). Both have been associated with the Mabopane-Centurion Development Corridor and are seen as catalysts to develop the north and west of the city. Funding for these new facilities, and other freeway extensions and improvements will have to be based on tolls. Unfortunately, however, the proposed tolling of the NI (Zambezi Drive to the N4) will impact negatively on some disadvantaged communities and worsen the separation of north and south. Tolls will affect some communities more than others, while yet others will not be affected. The PWV2 and 9 could, however, be complementary to public transport, if they attract development to the proposed “Urban Port” at the intersection of the two freeways. This area is presently well served by trains, buses and taxi services. The geographic centre of Tshwane is now north of the Magaliesberg and there is, therefore, a need for infrastructure development to support and develop the area. Other transport infrastructure issues which require strategic action are: the ring-rail system around the CBD, and the absence of a major regional or international airport to serve the capital city.
PASSENGER MOVEMENT
The graph below shows how people in Tshwane travel to work
Transportation Mode to Work in Study Areas Mode of Transport Used to Travel to Work
200000 160000
No of Trips to Work
No of Trips to Work
150000
180000
140000
160000 130000
120000
140000 110000
100000
120000
90000
100000 80000
70000
80000
60000
Demarcation Income Group
60000 50000
40000
Northern ANC Wards Low
40000 30000
Southern ANC Ward 20000 Medium
20000
10000
0 DA Wards 0 High
Public Transport Private Transport Walk/cycle Public Transport Private Transport Walk/cycle
Mode of Transport to Work Mode of Transport to Work
• Public transport is the only practical means of transport for low-income earners,
particularly those living in the northern ANC wards. Because of the distances to work,
walking or cycling is not possible for most people.
• Only a few high-income earners use public transport to travel to work and there is very
little public transport patronage in wards, which elected DA councillors.
• Income and car availability, which are strongly related, explain the choice of mode (see
below)
Car Availability by Household Income
No of Households
300000
280000
260000
240000
220000
200000
180000
160000
140000
120000
Income Group
100000
80000
Low
60000
40000 Medium
20000
0 High
0 1 2 3
No of Cars Available to HouseholdThe travel mode used for trips to schools, colleges and universities is also influenced by household
income, as can be seen below.
• Households with high incomes generally transport their children by car.
• Middle-income households also transport their children by car, but many more use public
transport (about one third) and either walk or cycle.
• The children of low-income households mostly walk or cycle to school, but a fair number
also use public transport.
Transportation Mode to School Travel Time of Commuters in Study Area
500000 400000
No of School Trips
No of Trips
450000
350000
400000
300000
350000
250000
300000
250000 200000
200000 150000
Income Group Study Area
150000
100000
Northern ANC Wards
Low
100000
50000 Southern ANC Wards
Medium
50000
0 High 0 DA Wards
Public Transport Private Transport Walk/Cycle
0-15 16-30 31-45 46-60 61-90 90+
Mode of Transport to school Travel time (minutes)
The travel times for work trips are shown in the graph above.
• Generally, more commuters from the northern ANC wards travel for more than 45
minutes to get to work. The average travel time for all low-income commuters is 53
minutes.
• Most residents of the DA wards (car drivers or passengers) take less than 30 minutes to
get to work. Their average travel time is 29 minutes.
Average Travel Time by Income Group
60
A
v
e
55
T
r 53
a 50
v
e
l 45
t
i
m 40
e
i 35
n
M 30
i 30
n 29
u
t 25
e
s
20
Low Medium High
Income GroupTRAVEL PATTERNS
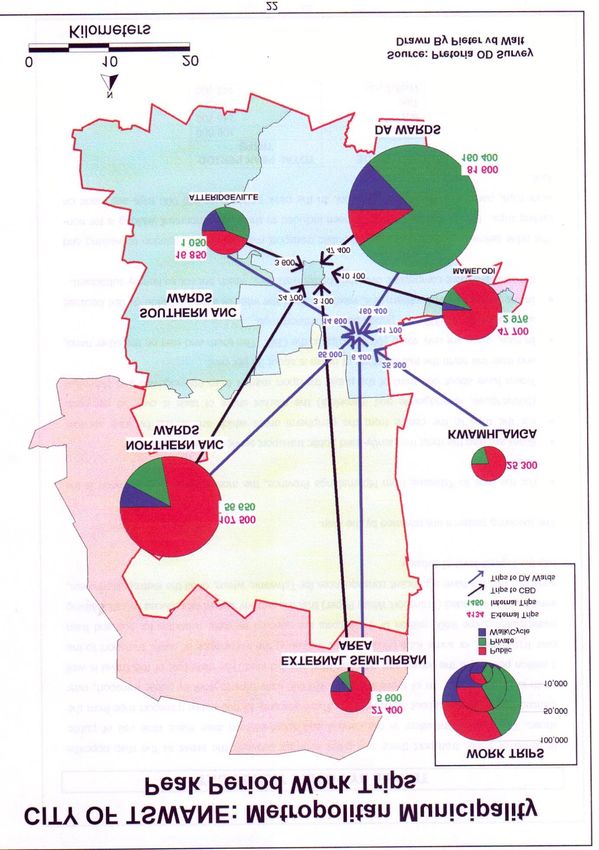
The map opposite shows travel to work by public, private and non-motorised modes in the morning
peak period (6 to 9 a.m.). The size of the pie is proportional to the number of trips and the pie slice
shows the mode share. The figures printed next to the pies indicate the number of trips from each
area to other areas (external) and the number of trips within each area (internal).
• The wards controlled by the DA, generate and attract the most peak hour work trips. Most
of these are made by private transport (green slice).
• Travel both within and from all the other areas is mostly by public transport (red slice). In
every case, there are more trips out of the area to central and south-eastern Tshwane than
internal trips (i.e. trips which start and end in the areas in question).
• In all the areas, for the internal trips, walking and cycling have a relatively larger mode
share. Many internal trips are short enough to permit workers to walk or cycle.
• The map also shows the trips into Tshwane from Mpumalanga via the Moloto Road and
from North West Province.
• From the south-east (DA wards) there are 81 600 external trips, 47 400 to the CBD,
mostly by car. The balance are trips to the south to Kempton Park, Midrand and
Johannesburg (34 200).
The mode used for work trips is shown in the table below. The majority of trips (52%) are by
private modes. Car drivers and their passengers account for 37.9 per cent of all peak period work
trips.
Travel mode used for work trips
Mode Number of commuters % of commuters
Train 77 800 13.4
Bus 78 900 13.6
Taxi 121 900 21.0
Total public transport 278 700 48.0
Lift Club 6 500 1.1
Car Driver 182 300 31.4
Car passenger 37 700 6.5
Motor cycle 1 200 0.2
Company transport 12 700 2.2
Other 600 0.1
Total private transport 240 400 41.4
Walk 59 200 10.2
Bicycle 2 300 0.4
Total non-motorised 61 500 10.6
GRAND TOTAL 580 700 100.0TRAVEL BY PUBLIC TRANSPORT
In terms of public transport there is a great contrast between the areas as the map opposite shows.
Peak period travellers in the central and south-eastern area make little use of public transport (in
total, only about 53 000 trips). There are only 15 000 public transport trips from the south-east to
the CBD. In all there are some 470 000 daily trips to work by public transport, over 1 million per
day, if the return and off-peak trips are included. The daily cost of this travel is well over R10
million, or some R2.6 billion a year, indicating the importance of public transport to the
municipality. Some R600 million of these costs are covered by state subsidies for bus and train
services. It is intended (Transport White Paper) that the subsidy should be reduced by rationalising
services. This will have significant consequences for Tshwane, which, of all the metropolitan areas,
has the highest level of subsidy.
The map reveals the following patterns.
• For the trips to Tshwane from Mpumalanga Province, the most commonly used mode is
the bus.
• Buses are also the most frequently used public transport service in the DA wards.
• For the trips to the centre from the peripheral areas that are served by train services
(Soshanguve, Atteridgeville and Mamelodi) the market share of taxis is over 50 per cent.
Trains have about one third of the public transport market from Atteridgeville and
Mamelodi and from the north the market share of buses is about 35 per cent.
• In total, there are only some 100 000 trips to the CBD. The south and east on the other
hand, attracts about 180 000 peak period public transport trips.
• In the Northern and Southern ANC wards, most of the internal trips are made by taxi
because the taxis are more competitive over the shorter distances, which are not so
heavily subsidised.
The table below shows the peak period public transport market share in relation to walking and
cycling trips. Non-motorised trips have been included to show how important walking is for non-
work trips, particularly for travel to school. In the peak period over 440 000 trips are made on foot.
MODE TOTAL PEAK
PERIOD TRIPS
Train 106 000
Bus 146 700
Taxi 216 300
Walk/Cycle 442 900TRANSPORT PROBLEMS
The types of transport problems experienced by Tshwane residents are related to their incomes and
the modes of travel they use. The following should be of interest or concern to Councillors:
Low-income households (monthly incomes of R3 000 or less)
• 49 000 households complained that transport is either not available or inaccessible (too
far away). The areas with most complaints of this nature are Mamelodi West (7 500),
Soshanguve (7 300), Pretoria West (6 000), Atteridgeville (4 400),Temba (4 200), Klip-
Kruisfontein (3 600), and Mabopane (3 000).
• 36 300 households said that there is not enough transport and that transport is crowded in
the peak period. These complaints were from the same areas: Mamelodi West (5 200) and
Soshanguve (3 900) stand out.
• 26 000 households complained that transport is often late or irregular (+5 000 households
in each of Atteridgeville, Mamelodi West and Soshanguve).
• Residents of the same areas complained about safety in vehicles, speeding and accidents
(22 000 households, with 7 000 complaints in Soshanguve).
• Lastly, some 21 000 households complained that the transport is too expensive.
Atteridgeville stands out, with over 8 600 complaints.
High-income households (monthly household incomes of R10 000 or more)
The problems of the high-income group differ significantly.
• The only real complaint is about congestion. This is localised, mostly in the New East.
Wapadrand had 2 500 such complaints, and Garsfontein 2 200. In the Moot there were 2
800 complaints about congestion.
In the survey, respondents were questioned about their satisfaction with public transport modes of
travel. Questions asked were independent of those on transport problems, but reflected similar
results. Most dissatisfaction with train services, was about distances between homes and stations
(47%) and crime on trains (36%). The absence of facilities at bus terminals and stops (55%
dissatisfied) was the main complaint about bus services. Many people use, and are dependant upon,
mini-bus taxis because of their convenience. There are, however, many areas of dissatisfaction with
taxis, including safety from accidents (61 % dissatisfied) violence between associations and
operators (59%), crime at ranks (44%), crime in taxis (40%) and high fares (40%).
Another concern is the large number of trips to educational institutions in the morning peak period
and the lack of co-ordination between commuter and education services. In this context, there is
much scope for savings and rationalisation of services.TRANSPORT AND MUNICIPAL GOVERNANCE
Many of the development challenges facing Tshwane, have their roots in the spatial structure of the
city. This presentation has spelt out the challenges. Transport will provide the framework for future
spatial development.
In the past, responsibility for transport was shared between national, provincial and municipal
government. This resulted in fragmentation and many co-ordination problems. This situation still
prevails, for example, on the metropolitan road network in Tshwane, road planning, design,
management and financing overlaps. National and provincial road authorities can set tolls and
standards, which may be inequitable and contrary to the objectives and policies of the municipality.
The same applies to the South African Rail Commuter Corporation (SARCC) that regulates
METRORAIL services. Commuter rail policies result in cross-subsidisation of unprofitable services
in East London, at the expense of services in Tshwane.
In terms of the NLTT Act, municipalities are soon to be designated as Transport Authorities (TA’s).
TA’s will be assigned transport functions in terms of a Founding Agreement. Unfortunately, the
NLTTA only assigns duties and responsibilities, not powers, so the problems of fragmentation will
remain. This will create problems and impose costs on the Tshwane municipality.
The Minister expects a Founding Agreement, to be prepared as the basis for the assignment of the
transport functions specified in the Act. The Minister has “gazetted” requirements about transport
regulation. Planning requirements will follow in mid-2001.
Tshwane Municipal municipality will, therefore, need to adopt a position on the following transport
challenges, early in its term of office.
• Obtain clarity about the transport functions to be assigned. In terms of the NLTTA,
these may include planning, management and regulation of roads and other transport
infrastructure (terminals, ranks etc) and public transport services. Implementation of
national and provincial transport policies will require funds for capital and maintenance
projects. Implementing transport laws will also require additional funds and much more
effective transport and traffic law enforcement.
• Determine accountability for the planning and tolling of national and provincial
roads, which run through Tshwane. Tolls will impact on funding for the municipal
transport functions.
• Seek commitment to funding for the transport functions to be assigned by the
Minister and MEC.
• Seek clarity on the powers necessary to implement the policies and plans specified in
the Minister and MEC’s requirements.
The departure point for negotiating the City of Tshwane’s position on taking responsibility for the
transport should be, that it will not accept any additional unfunded mandates.COMPARISONS BETWEEN LOCAL AREAS
The table opposite shows the characteristics of Black households in four areas of the City of
Tshwane. The CBD and Sunnyside contrast markedly with Garankuwa and Soshanguve.
The number of Black households in each of the areas ranges from 9 000 in the CBD, to over 71 000
in Soshanguve. Some interesting features and contrasts between the areas are as follows:
• The majority of households in all areas comprise Black singles or families. The
percentage of Blacks in Sunnyside (67%) is somewhat surprising, but indicates the
demographic changes that have taken place since 1994.
• The households in the CBD and Sunnyside are considerably smaller averaging around 2.5
persons compared with the townships, which average around 5. In the CBD and
Sunnyside the overwhelming majority of households live in flats. The preponderance of
shacks is highest in Soshanguve (31%).
• Black households in the CBD and Sunnyside are more affluent, earning between R3 500
and R4 500, compared to Garankuwa and Soshanguve where household incomes
average less than R3 200 per month. The same can be said of the average personal
incomes, which are much higher in the CBD and Sunnyside.
• The average age of the adults in the CBD and Sunnyside is lower, (28 years) than in
Garankuwa and Soshanguve (37-39 years). There are also fewer school age children (23%
of the population). It is of interest to note that a larger proportion of those living in the
CBD and Sunnyside have Matric or higher qualifications. There are more young males
living in the CBD.
• The transport characteristics of Black residents of the inner city are also markedly
different to those living on the periphery. Average travel times to work are shorter
although there is little difference in the average travel time to education facilities. Many
more of the inner city residents can walk to work (+43%) and, accordingly, fewer use
public transport.
The table shows the advantages of living in the inner city, particularly in terms of transport. It
seems, however, that those choosing to live closer to the centre are generally younger, many are
single, and their incomes afford them the opportunity to purchase or rent the more expensive inner
city accommodation. There is, however, a trade-off being made between the costs of
accommodation and the costs of transport and good accessibility to work and other urban activities.
This table should give a clear directive to city planners and to Councillors who allocate
development rights and approve zoning and development applications. The potential for inner city
housing, the lack of recreation facilities in the inner city, and the potential of the inner city ring-rail
system to catalyse development, should be planned and prioritised.COMPARISONS BETWEEN LOCAL AREAS
SOSHANGUVE
GARANKUWA
SUNNYSIDE
CBD
1 Number of Black households 9 000 17 000 12 000 71 000
2 % of households which are Black 85.1% 67.3% 100% 99.7%
3 Average household size 2.4 2.5 4.8 4.9
4 Living in flats (%) 99.9 96.4 0.7 0.0
5 Living in shacks (%) 0 .6 2.1 30.6
6 Average monthly household income R4 500 R3 400 R3 200 R2 700
7 Average personal income (workers) R3 900 R3 025 R1 800 R1 860
8 Average age of those over 18 28 28 39 37
9 % under 19 years 23 22 33 39
10 % with Matric or higher education 72 69 30 20
11 % male 53 47 48 48
12 Average travel time to work 36 min 35 min 47 min 68 min
13 Average travel time to education 33 min 39 min 35 min 30 min
14 % walking to work 44 43 15 5
15 % walking to education 53 57 58 75
16 % using public transport to work 42 32 68 81
SUMMARY OF DEVELOPMENT CHALLENGES IN TSHWANE
Tshwane is severely affected by past policies. The legacy is one of polarisation between the
relatively affluent in the south and those left behind by the poverty trap, in the north. Trends since
1975 indicate that the gap may be increasing. Because the polarisation of income groups, divides on
race, the municipality will be challenged to integrate a divided city.
The most significant challenges will be:
• to improve access to opportunities (work, education, health, recreation, etc.); and
• to upgrade the environment, (better housing, more sustainable choices of access to
activities requiring the rationalisation of transport and housing subsidies.
Key challenges are, therefore, access and sustainability. The choices are:
• improve the transport system to reduce travel times and increase the choice of
destinations for activities (improve mobility); or
• reduce, or trade-off, the high cost of accessible land against the long:-term costs of
subsidised transport (improve accessibility)
• redirect public and private sector development to locations which afford good access to
existing activities and facilities, (new housing), or to the population, (new economic
activities) - (improve accessibility and sustainability).
Transport system improvements will require significant investment, will not be sustainable, even in
the medium-term, and may increase the cost burden on the poor in the form of fares hikes. Because
of the serious backlog of transport expenditure, there is, however, a need for more funds to bededicated to the ailing transport system (both rolling-stock and facilities) to arrest its further
decline.
Land use interventions will require considerable political will. The municipality will be challenged
to adopt land use policies that encourage competitive markets for land and commercial floor-space
to emerge in, or adjacent to, the areas occupied by the poor.
A start can be made by locating new state-funded activities (e.g. Technicons, Produce Markets,
Airports), close to the disadvantaged and by introducing development incentives and “conditional
planning permission” to private development applications. These include:
• higher densities and mixed land use along designated corridors: and
• delineation of an “urban edge” for service delivery.
These measures have succeeded in Curitiba, Brazil because of the vision and enterprise of the
Mayor.
REFERENCES
1. GREATER PRETORIA METROPOLITAN COUNCIL. Household Travel Survey;
Pretoria, May 2000.
2. LOMBARD, M C. & K OLIVIER. Spatial dualism revealed by the Greater Pretoria
Household Travel Survey. South African Transport Conference, CSIR, Pretoria, July 2000.CITY OF TSHWANE: DEVELOPMENT CHALLENGES
J W M CAMERON and M N KRYNAUW∗
TRC Africa (Pty) Ltd. P O Box 95230, Waterkloof, 0145
∗City of Tshwane Metropolitan Municipality, P O Box 6338, Pretoria, 0001
BILL CAMERON (MSc – Regional, Urban and Transport Planning, MCIT and MIHT) was
formerly Programme Manager: Urban Transport at the CSIR (1983/87) and is currently Director of
TRC Africa (Pty) Ltd.
Between 1995 and 1999 he was specialist advisor to the NDOT and was responsible for
development of the Land Passenger Transport Policy Framework, which was used to provide input
to the White Paper on National Transport. In this capacity, he was also instrumental in preparing
many of the sections of the Draft Land Transport Act, now the National Land Transport Transition
Bill.
As advisor to the NDOT he was also coordinator and author for the COLTO process of developing
guidelines for the Integrated Transport Planning Process (TPGs/TPRs).
Bill Cameron has also assisted the NDOT in the development of a financing strategy for land
transport and in demand estimation for the Taxi Recapitalisation Project.
He has served as a convenor for the SATC intermittently since 1985.You can also read