The importance of scaling up for agricultural and rural development - IFAD OCCASIONAL PAPER
←
→
Page content transcription
If your browser does not render page correctly, please read the page content below
IFAD OCCASIONAL PAPER             4

            The importance of scaling up for
            agricultural and rural development
            And a success story from Peru

                                            Enabling poor rural people to overcome poverty
Intellectual contributions to this paper were provided directly or indirectly by Johannes Linn,
David Nabarro, Rodney Cooke, Elwyn Grainger-Jones, Shyam Khadka, Cheikh Sourang and
Barbara Massler for the material on Peru, and by Sara Bridges and Bruce Murphy for editorial
assistance. Special thanks to Roberto Haudry de Soucy, who was IFAD’s country programme
manager in Peru for many years and was responsible for IFAD’s contribution to the Peru
success documented here. Also thanks to Josefina Stubbs, Director, Latin America and the
Caribbean Division, who oversees IFAD’s work in Peru.

© 2013 by the International Fund for Agricultural Development (IFAD)

The opinions expressed in this publication are those of the authors and do not necessarily
represent those of the International Fund for Agricultural Development (IFAD). The
designations employed and the presentation of material in this publication do not imply the
expression of any opinion whatsoever on the part of IFAD concerning the legal status of any
country, territory, city or area or of its authorities, or concerning the delimitation of its frontiers
or boundaries. The designations ‘developed’ and ‘developing’ countries are intended for
statistical convenience and do not necessarily express a judgement about the stage reached
by a particular country or area in the development process.

All rights reserved

Cover photo: ©IFAD/Pablo Coral Vega

ISBN-978-92-9072-418-6

Printed July 2013
IFAD OCCASIONAL PAPER                        4

The importance of scaling up for
agricultural and rural development
And a success story from Peru

by
Kevin Cleaver
Associate Vice-President, Programmes
International Fund for Agricultural Development
Rome, Italy

        Enabling poor rural people to overcome poverty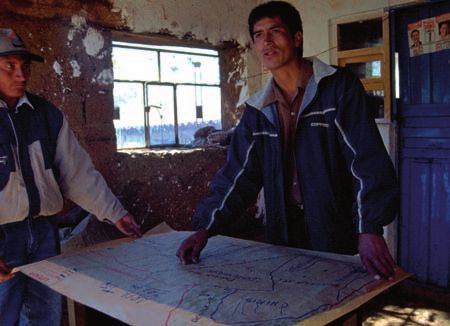
Table of contents

Abstract                                                                       2
I.    The relationship between poverty, agriculture and hunger                 3
II.   How to stimulate agricultural production                                 6
III. The role of scaling up in IFAD operations                                11
IV. Conclusions                                                               17
References                                                                    18

Acronyms

CORREDOR          Development of the Puno-Cuzco Corridor Project
FAO               Food and Agriculture Organization of the United Nations
FEAS              Promotion of Technology Transfer Project to Peasant Communities
                  in the Highlands
GDP               gross domestic product
IFPRI             International Food Policy Research Institute
KfW               Kreditanstalt für Wiederaufbau
MARENASS          Management of Natural Resources in the Southern
                  Highlands Project
M&E               monitoring and evaluation
NGO               non-governmental organization
ODA               official development assistance
IFAD Occasional Paper Series
Abstract
The thesis of this article is that governments of countries that plan their agricultural and
rural development programmes on a large scale – typically covering the entire
agriculture sector and including all or most of the important ingredients for agricultural
growth and rural development – do better in terms of agricultural production and
reduction of rural poverty and hunger than do country governments that do not invest
broadly and at scale in such development. The reason, for most low-income countries,
is that agriculture still constitutes the most important economic sector, uses the most
labour and contains the majority of the poor, who are also the majority of the hungry.
Government action to stimulate agriculture at scale pays off by increasing food
production and rural incomes. Donors that contribute to government programmes at
scale and for the long term thus contribute more to this success than donors that do not
operate at scale, and that have short-term objectives or invest in small-scale projects.
IFAD’s experience in Peru, in which it supported the Government in scaling up
agricultural and rural development investments in poor areas of the Peruvian Andes
over a period of 20 years, has paid off spectacularly in terms of poverty reduction. The
Peruvian example points to two critical ingredients: government commitment to
operating at scale and donor willingness to support governments in doing this.
2I. The relationship between poverty,
agriculture and hunger
The large variation in performance among countries in terms of agriculture, poverty
reduction and hunger reduction, combined with large differences in the treatment of
agriculture sectors by governments, enables analysis of the relationship between
agricultural performance, hunger and poverty reduction, and government efforts to
support agriculture at scale.1
The most recent data from the Food and Agriculture Organization of the United
Nations (FAO) show that over time there has been significant progress in reducing the
total number of undernourished people globally, and the same is true for poverty. The
FAO Statistical Yearbook 2013 indicates that the number of undernourished people fell
from 1 billion in 1990-1992 to 868 million in 2010-2012 (FAO 2013, 90). The same
source shows that the prevalence of food inadequacy fell from 26 per cent in 1990-1992
to 19 per cent in 2010-2012. However, significant gains made in Asia and in Latin
America and the Caribbean are offset to some extent by an increase in the number of
undernourished and poor people in many countries of sub-Saharan Africa and a few
countries on other continents.
Was good agricultural performance important in bringing down the poverty and
hunger rates in the more successful countries? There is evidence that agricultural growth
has a high poverty reduction pay-off:
• A 1 per cent per annum increase in agricultural growth, on average, leads to a
2.7 per cent increase in income of the lowest three income deciles in developing
countries (World Bank 2007; De Janvry and Sadoulet 2009).
• Investment in agriculture is 2.5 to 3 times more effective in increasing the income
of the poor than is non-agricultural investment (World Bank 2007).
• Agricultural growth, as opposed to growth in general, is typically found to be the
primary source of poverty reduction (Diao et al. 2007, 10).
The contrary is also true; a decline in agricultural growth throws many near-poor people
into poverty, and may explain some of the increase in developing country poverty and
hunger in 2008 and again in 2010 when food prices increased worldwide.
This evidence of the positive impact of agricultural growth on poverty reduction is
not new. Higher agricultural growth – due to higher agricultural productivity growth –
underpinned early development in Western Europe, Japan and the United States, and
later in China and the Republic of Korea (World Bank 2007, 35).
1 Scaling up is not defined here specifically. It refers to projects or programmes impacting significant numbers of
rural people. The number will vary according to country size: what would be considered a large-scale programme
in China will impact many more people than a large-scale programme in Togo, for example. It also refers to
sustainability: the impact must be long-lasting. Scaling up does not refer to programme cost. Low-cost
programmes that positively impact many people are more valuable than very costly programmes impacting the
same number.
3IFAD Occasional Paper Series
Another way of looking at this is to compare countries with the largest reduction in
poverty rates and undernourishment against countries with the most rapid agricultural
growth over the same period. Table 1 shows that among developing countries, those
with the most rapidly growing agriculture sector generally had the most rapidly
declining poverty incidence, as well as a declining incidence of malnutrition.2
The countries listed in Table 1 are the ‘star agricultural performers’ for the nearly
20-year period of the 1990s and 2000s (ending in 2008). All these good agricultural
performers for which data are available, with the exception of Chile, were also star
performers in terms of reducing the percentage of the population living in poverty
during this period (that is, at below US$1.25 per day per person; indicated in the third
column). Even the exceptional case, Chile, saw some reduction in poverty as its
agriculture grew rapidly. Similarly, using the decline in malnutrition as the dependent
TABLE 1
Countries with greatest Agricultural growth rate Change in percentage Change in percentage
agricultural GDP in 1990s and 2000s of population living at of population
growth rates in (per cent per annum) below US$1.25 per day undernourished
1990s and 2000s between 1998 and 2008 from 1990/1992
(percentage of population) to 2004/2006a
(per cent)
Average for developing
world as a whole 3.3 -20 -
Algeria 5.2 - -
Belize 4.8 - -
Benin 5.2 - -9.0
Brazil 4.0 -9.7 -4.0
Burkina Faso 6.7 -49.7 -5.0
Cambodia 4.6 - -13.0
Chile 4.3 -1.5 -
China 4.0 -31.6 -
Ethiopia 4.8 -46.0 -27.4
Lao People’s Democratic Republic 4.0 -37.2 -8.0
Malawi 5.7 -50.8 -16.0
Morocco 5.7 -6.3 -
Mozambique 5.6 -45.9 -22.0
Paraguay 4.4 -16.9 -4.0
Peru 4.4 -6.7 -15.0
Rwanda 4.4 - -5.0
Syrian Arab Republic 5.6 - -
United Republic of Tanzania 4.0 - -
Viet Nam 4.9 -45.1 -15.0
a
IFAD 2010a, 249-253, based on FAOSTAT data (http://faostat.fao.org/).
Note: a hyphen denotes that data are unavailable.
2 See IFAD 2010a, which compares poverty incidence (tables on pp. 248-253) with agricultural growth rates
(pp. 238-241). Table 1 shows countries with average agricultural growth rates for the 1990s and 2000s at or
above China’s rate of 4 per cent per annum. The third column shows the decline in a country’s overall poverty
incidence (measured as the percentage of the population living at below US$1.25 per day per person). The data
are simple averages. The official statistics for Guinea and Myanmar would put them in the high agricultural
growth group, but they were excluded because the data are questionable.
4variable, countries with good agricultural growth had generally strong declines in the
percentage of the population malnourished.3 The World Bank (2007) and IFPRI (2007)
analyses cited earlier suggest an empirically tight relationship between good agricultural
growth and poverty reduction. Table 1 gives a sense of which countries are involved and
the large magnitudes of improvement attained.
The evidence summarized above shows that, at least in the earlier stages of
development, agricultural growth is an effective way of reducing poverty. As countries
reach upper-middle-income status (e.g. Chile, shown in the table to be a good
agricultural performer, but with only limited further poverty reduction), additional
poverty reduction may be more effectively addressed outside of agriculture, depending
on the remaining significance of agriculture to the economy.
3 Note that malnutrition-sensitive agriculture can have key differences with poverty-reducing agriculture:
malnutrition is an imperfect proxy for poverty and vice versa.
5IFAD Occasional Paper Series
II. How to stimulate
agricultural production
Is enough known about how to stimulate agricultural growth and rural development in
low-income countries, and what their relationship is to ‘scaling up’? There is now a large
body of literature indicating that domestic and international investment in agricultural
and rural development, both private and public, stimulates growth. World Development
Report 2008 (World Bank 2007) focused on this question, as did IFAD’s Rural Poverty
Report 2011 (IFAD 2010a). The World Bank report indicated that success in agricultural
development requires a large number of investment and policy measures. The first set
deals with improving farmer and agro-industrial access to markets. This involves an
enabling government policy, partner country policy, and investment in infrastructure
and government services. The policies and investments are generally those that create
an enabling environment for private investment in marketing, farm input supply,
agroprocessing and, of course, farming itself. The investments are both private and
public, with the latter focused on rural infrastructure, rural education, information
supply, regulation and policy. In the second set of measures, an international and
individual government focus is needed on smallholder farming productivity, food
production, reversing environmental degradation, and natural resource management,
because smallholders have special information, infrastructure and support needs. This
in turn requires research and development, instruments to reduce farmer risk, and rural
financial services, among others. Labour mobility is important, as is the quality of
public-sector governance and donor interest. Investment in rural areas more broadly is
also needed, as an incentive to rural youth to remain.
The kinds of investments that work to boost agricultural growth include the
following:
• Support to farm investment
• Investment in agricultural research and extension
• Rural finance
• Land tenure, land rehabilitation and land management
• Rural employment generation and support for non-farm small businesses through
investment in smallholder farming, agro-industry, marketing and input supply
• Development of farmers’ organizations, to help manage village-level investment
and to enable farmers to have a greater voice in national and local policy
• Infrastructure
• Rural water management and irrigation
• Rural roads and energy
• Sustainable management of natural assets including forests, fisheries, pasture land
and water
• Nutrition and household food security through rural education and changes in
home production and diet
6• Building of decentralized public services in rural areas
• An enabling agricultural policy, which avoids distorting policies such as: heavy
government ownership and control of agricultural marketing, processing and
input supply; agricultural price controls; suppression of private-sector agricultural
investment; agricultural export controls; and disproportionately large fertilizer
subsidies
The question that arises is: if agricultural growth is so effective in reducing poverty, and
we know how to get such growth, why are agricultural production growth and rural
development so problematic in most developing countries? The countries that have
performed poorly in agriculture represent the majority, and they are not listed in the
above table because their agriculture sectors are not growing at 4 per cent annually or
higher. Why is the global rural poverty and nutrition problem not being resolved in
these countries, while it is being resolved in the countries shown in the table? Why are
known solutions, such as those listed above, not more widely applied?
One answer is that investment in agriculture, both by developing country
governments and aid donors, has declined since the 1980s. According to figures from
the Organisation for Economic Co-operation and Development, the share of agriculture
in total bilateral and multilateral aid hit a peak of 22.5 per cent in 1979-1981 and has
since declined, falling to a low of 5.4 per cent in 2003-2005, before increasing to 6 per
cent in the most recent figures.4 In addition to declining official development assistance
(ODA), few governments have allocated sufficient public resources to agriculture. So the
combination of declining aid to agriculture and low public agricultural investment by
developing countries has resulted in a huge public investment gap between what is
needed to get agriculture moving and what is supplied in terms of investment. For
example, nearly all African governments still spend less than 10 per cent of public
budgets on agriculture, despite the commitments made in the Maputo Declaration of
2003 (IFAD 2010b, 27).
Though donors are generally not as critical to scaling up as are developing country
governments, they can be helpful, or harmful, to this agenda. One possible source of
harm is that there are so many donors. The Brookings Institution evaluated 132 aid
agencies, which provide aid (to all sectors) through thousands of projects (Birdsal and
Kharas 2010). In other words, the aid business is generally characterized by
innumerable small projects. Aid data provide information on 924,000 projects covering
322 donor agencies (ibid., 17). An example given for Africa is that of Ethiopia, where
the World Bank documented 20 donors supporting 100 agricultural projects in 2005
(World Bank 2007, 257). Donors are operating agricultural projects in all developing
countries, and for those developing countries with poor agricultural performance (all
those not listed in Table 1), this aid – fragmented as it is and placed in a poor policy
environment – often has little to show in terms of impact on significant numbers of
people or higher agricultural growth rates for the country. Combining aid-financed
projects in support of larger government programmes, or convincing governments and
other donors to scale up successful projects, would appear to be the direction to take.
4 See Islam 2011. Aid to agriculture averaged US$6.3 billion in 2006-2008 out of total aid to all sectors of about
US$104.8 billion, or 6 per cent.
7IFAD Occasional Paper Series
Looking back on the longer period of the 1990s and 2000s, large-scale investment
in agriculture in large-scale programmes by the governments of Brazil, China, the Lao
People’s Democratic Republic, Morocco, Mozambique, Peru, the United Republic of
Tanzania and Viet Nam – all countries that were star agricultural performers over this
longer period – helped them achieve their excellent agricultural growth and good
poverty reduction. Unfortunately, there is no good measure for scaling up, preventing
an empirical investigation of the relationship between scaling up and agricultural
performance. The proxy used in Table 2 is the size of public agricultural investment
compared with gross domestic product (GDP). This assumes that governments that
allocate a larger part of their budgets to agriculture relative to GDP will be those scaling
up public investments into larger-scale projects and programmes. The problem with
this assumption is that governments with large agricultural investment programmes
could conceivably be dividing the programmes into many small projects. One could
argue that even in this situation, the scale of the agricultural investment is high. But
clearly a better measure is needed. Table 2 shows a comparison of the agricultural
growth rates in the 1990s and 2000s, for the strong agricultural performers only, with
public agricultural investment as a percentage of GDP.
Table 3 shows a second set of countries whose investment in agriculture was above
average, but which did not achieve such spectacular agricultural growth rates, and in a
few cases performed unimpressively (Bhutan, Sri Lanka and Thailand). Other factors
TABLE 2
Countries with greatest Agricultural growth rate in Average public expenditure
agricultural GDP growth 1990s and 2000s on agriculture as a percentage
rates in 1990s and 2000s (per cent per annum) of GDP 1995-2007 (per cent)
Average for developing
world as a whole 3.3 0.81
Algeria 5.2 -
Belize 4.8 -
Benin 5.2 -
Brazil 4.0 0.31
Burkina Faso 6.7 -
Cambodia 4.6 -
Chile 4.3 -
China 4.0 1.25
Ethiopia 4.8 1.94
Lao People’s Democratic Republic 4.0 -
Malawi 5.7 1.60
Morocco 5.7 0.96
Mozambique 5.6 -
Paraguay 4.4 -
Peru 4.4 -
Rwanda 4.4 -
Syrian Arab Republic 5.6 2.30
United Republic of Tanzania 4.0 -
Viet Nam 4.9 -
8intervened in these countries so that good agricultural growth was not obtained, in spite
of strong investment. Sri Lanka had a civil war; Bhutan is landlocked, mountainous and
has limited agricultural potential. India has shown satisfactory performance, with an
agricultural growth rate consistently above 3 per cent, but it is not a star performer
despite the high level of public and donor investment in agriculture. High expenditure
by India on farm subsidies and a poor agricultural marketing policy have held its
agriculture back from achieving the Chinese level of agricultural growth.
It is also instructive to look at those African countries meeting the 10 per cent
Maputo declaration target for public investment in agriculture. The idea was that, at
such a level, significant public investment at scale would be possible. Of course, the
10 per cent figure is highly arbitrary, but at the time it reflected a consensus among
African leaders. Very few countries in Africa have achieved this level of agricultural
public investment – only Ethiopia, Madagascar, Malawi, Mali, Niger and Senegal).5
Several of these countries had large public-sector investment programmes, on a
national scale and nearly always assisted by donors. This succeeded in stimulating
the agriculture sector in Ethiopia (agricultural growth from 2000 to 2008 of 7 per cent
per annum), Mali (5.2 per cent) and Niger (7.1 per cent), but not in Madagascar
(2.1 per cent), Malawi (1.1 per cent) or Senegal (1.5 per cent). In these latter cases,
other factors worked against the positive effects of large public investment programmes
in agriculture. These factors included poor agricultural price and marketing policies
(Malawi and Senegal), which can erode or negate the benefit of investment in
agriculture even if the government devotes more than 10 per cent of its public
expenditure to the sector. Madagascar has gone through considerable civil strife and
international isolation, which has undone its economy, including the agriculture sector.
A tentative conclusion is that bigger public expenditure programmes for agriculture,
combined with bigger allocations of ODA for the sector, permit public agricultural
programmes on a larger scale (often nationwide). This appears to stimulate faster
agricultural growth – unless poor policy, civil strife or other variables (such as
inadequate rains) intervene. Operating at large scale is no panacea, but when combined
with good policy and adequate governance, the experience of Africa has shown that
agricultural growth can exceed that of the benchmark Chinese agricultural growth rate
TABLE 3
Other countries with Agricultural growth Public investment in
high agricultural rate in the 1990s and 2000s agriculture as a percentage
expenditure, but lower (% per annum) of GDP (1995-2007)
agricultural growth
Bhutan 2.0 4.05
Egypt 3.3 1.36
India 3.1 0.80
Philippines 2.9 0.90
Sri Lanka 2.2 1.10
Thailand 2.4 1.47
Tunisia 3.1 2.28
5 Data on the percentage of a country’s government budget going to agriculture among African countries in the
2000s are courtesy of the Independent Office of Evaluation of IFAD (IFAD 2010b, 27). Agricultural growth rates
are for the 2000s and do not include the 1990s due to the absence of data in that decade for most
African countries.
9IFAD Occasional Paper Series
of 4 per cent per annum – for example in Ethiopia, Mali and Niger in the 2000s. Good
performers also receive much donor aid to agriculture, including from IFAD (which has
a performance-based system for allocating its resources to countries). And this donor
aid comes to the larger-scale programmes in these countries precisely because their
governments have set up large-scale programmes into which both donors and
governments can channel their resources. Yet high public investment in agriculture is
not enough, as shown by the bottom group of countries in the table – having
high investment but low agricultural growth. Good policy, reasonable agricultural
potential, marketing and infrastructure, and the absence of civil strife also play a role.
Problems in these areas can offset the positive impact of high public expenditure and
larger-scale programmes.
What about the countries that invest little in agriculture, which are absent from the
tables? The kinds of investments listed above, which work to stimulate agricultural
growth, are sometimes undertaken in these countries (which we should remember
make up the majority), but in small projects, with small amounts of financial aid and
small amounts of developing country government resources. With small public-sector
budgets, these investments in agriculture are rarely at a sufficient scale to have an impact
on large numbers of people. There is little scaling up. Low public investment and lack
of investment at scale, combined with poor policy environments, lead to low
agricultural growth and contribute to the hunger and rural poverty problems
characteristic of (but not limited to) such countries.
IFAD’s experience is relevant here. Its ongoing projects are estimated to have directly
brought 60 million people out of poverty over the 2008-2012 period – a relatively small
number compared with the problem (there are nearly 900 million people living in
extreme poverty worldwide). Given the size of this problem and the fact that the
numbers of rural poor and hungry are decreasing only very slowly in absolute terms, it
is apparent that no donor is having a significant enough impact on a large scale. The
thesis presented above is that countries doing well in terms of rural poverty reduction
have invested their own public resources in agriculture, in combination with aid, at a
sufficient volume to enable them to do well when combined with good agricultural
policy and the absence of civil strife. The challenge, then, is to convince governments in
the developing world and their cooperating donors to scale up those agricultural
investments that are working and to introduce the conducive policies listed previously.
10III. The role of scaling up
in IFAD operations
IFAD’s approach to agricultural and rural development is to provide funding, technical
advice and partnership-building to assist governments and national organizations (civil
society, farmers’ groups, non-governmental organizations [NGOs] and the private
sector) in sustainably increasing rural incomes and food security. In doing so, it
contributes to building local capacity in countries. IFAD focuses exclusively on rural
areas and rural development. It provides assistance for farm input supply, marketing,
processing of agricultural products and support to farmers’ organizations in order to
reduce rural poverty and hunger and enhance food security. IFAD’s financial and
technical inputs complement and increasingly catalyse those of governments, other
local institutions and other donors.
From 2010 to 2012, IFAD provided about US$1 billion in loans and grants for these
purposes to developing country governments, civil society groups and NGOs. It
anticipates providing about US$1 billion per annum for the next five years. In addition,
it mobilizes cofinancing from other donors, recipient governments, NGOs and the
private sector. In 2012, IFAD raised about US$1.5 billion in cofinancing from these
sources. Despite these numbers, as mentioned earlier, IFAD brought only an estimated
60 million people out of poverty over the 2008-2012 period.
Recognizing the need to have an impact on a much larger number of poor people,
the IFAD Strategic Framework 2011-2015 identifies the scaling up of impact to reach a
much larger number of poor people as ‘mission critical’. In the pursuit of this objective,
a Brookings Institution review of scaling up by IFAD was undertaken in 2010-2011. It
showed that IFAD has good examples of scaling-up solutions, but needs a more-
systematic approach (Linn et al. 2011). The case of rural development in the Peruvian
Highlands was found to be a good example of how IFAD has scaled up successful
projects in the past (although, as is the case with other donors, most projects are not
scaled up, even when successful).6
The Peru case began with relatively small, area-based rural development projects in
the 1980s (the Alto Mayo and Cuzco Arequipa Highlands Rural Development Projects).
Based on the mixed results of these projects, IFAD developed a new project in the Andes
in the extreme south of Peru. It was called the Promotion of Technology Transfer Project
to Peasant Communities in the Highlands (FEAS) and targeted poor indigenous
populations in the Andean highlands. Starting up in 1993, the project’s basic idea was
that local people in rural communities would organize themselves to submit
investment projects affecting their communities. The investments involved small
businesses in agriculture, tourism and agriculture-related endeavours. Local
communities created project selection committees that evaluated the proposals,
6 Based on internal IFAD documents and information provided by Barbara Massler of AGEG Consultants eG (for
the Brookings Institution and IFAD).
11IFAD Occasional Paper Series
choosing the best ones to be financed. A competition was thus established among
communities, and selection of winners was done publicly. The project provided
technical assistance on demand to help prepare and supervise proposals. Local
communities shared in the costs.
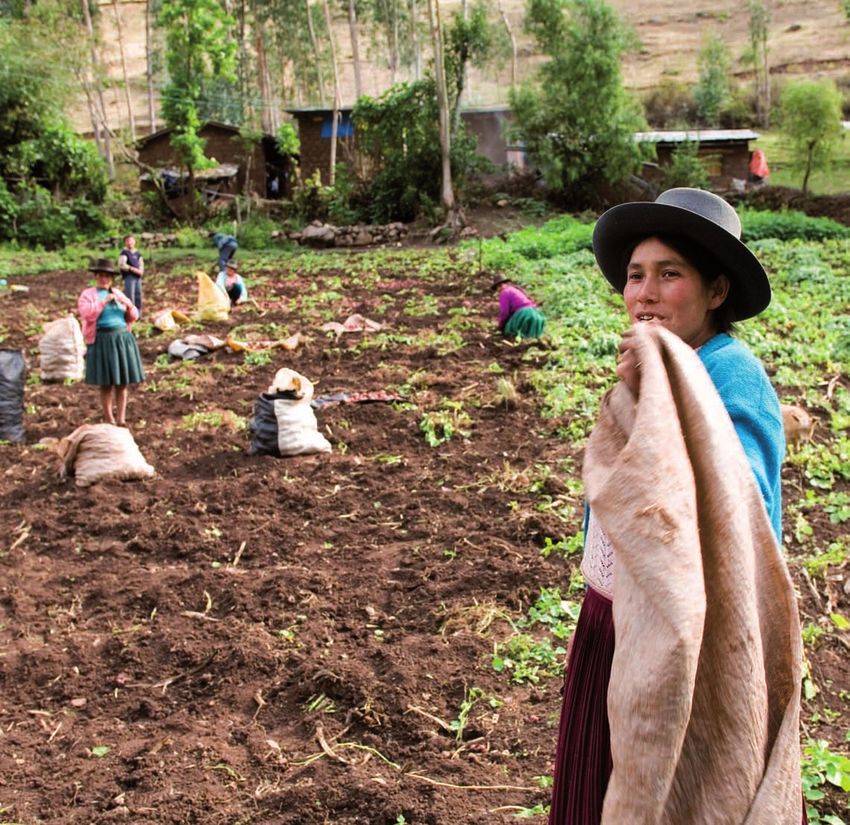
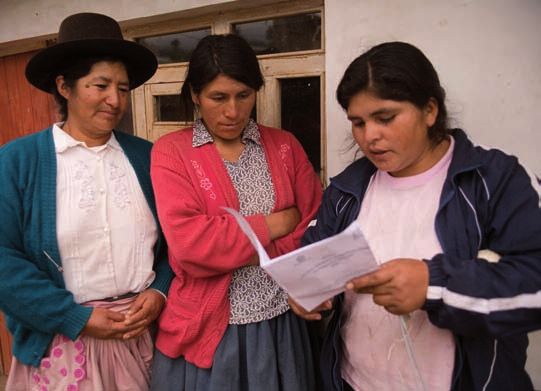
Peru: key innovations being scaled up
• Competitions among beneficiaries for NRM and small businesses
• Local resource allocation committees (LARC)
• Local talent mobilized
• Direct transfer of public funds to community organizations
• Women’s saving accounts
Note: NRM = natural resource management (of water, land, soils, forests, wildlife).
©IFAD/Susan Beccio
©IFAD/Elisa Finocchiaro
©IFAD/Pablo Coral Vega
12A strong monitoring and evaluation (M&E) system and strong local management
were key ingredients. Relying on local organizations to provide ideas and management
was also important. Project implementation spanned the period 1993-1999.
The second phase expanded on FEAS by extending the project to a larger area of
southern Peru, as shown in the map below. Management of natural resources (land,
water, forest and soil) became an added focus, but the process of intensive community
management, assisted by a government project management unit, was maintained.
This project was called Management of Natural Resources in the Southern Highlands
Project (MARENASS).
PHASE 1
Ecuador Colombia
Tumbes
Loreto
Piura Amazonas
Lambayeque
Cajamarca Brazil
San
Martin
La Libertad
Ancash
Huanuco Ucayali
Pasco
Callao, Lima
Junin
Prov.Constitucion Madre De Dios
Lima Huancavelica Cuzco
Ica Apurimac
Ayacucho Puno
Arequipa
Moquegua
0 100 200 Tacna FEAS: 40,000 households benefited
Miles
Chile
PHASE 2
Ecuador Colombia
Tumbes
Loreto
Piura Amazonas
Lambayeque
Cajamarca
Brazil
San
Martin
La Libertad
Ancash
Huanuco Ucayali
Pasco
Callao, Lima
Junin
Prov.Constitucion Madre De Dios
Lima Huancavelica Cuzco
Ica Apurimac
Ayacucho Puno MARENASS: 28% of households out of
Arequipa extreme poverty and 8.3% out of poverty
Moquegua
0 100 200 Tacna FEAS: 40,000 households benefited
Miles
Chile
B
13IFAD Occasional Paper Series
The third phase (2000-2008) made adjustments to strengthen local management
and participation, reinforced the technical assistance provided to local communities by
the project, and promoted market initiatives and business plans. It expanded the
number of people benefiting and the territory served. The new project was called
Development of the Puno-Cuzco Corridor Project (CORREDOR).
The fourth phase extended the area even further, and added a nutrition element.
This was called the Market Strengthening and Livelihood Diversification in the
Southern Highlands Project (Sierra Sur) and ran from 2005 to 2011.
PHASE 3
Ecuador Colombia
Tumbes
Loreto
Piura Amazonas
Lambayeque
Cajamarca Brazil
San
Martin
La Libertad
Ancash
Huanuco Ucayali
Pasco
Callao, Lima CORREDOR: It takes 30 cents to deliver
Junin
Prov.Constitucion Madre De Dios US$1 of loan investments. Each dollar
Lima Huancavelica invested is leveraged 5 times by beneficiaries
Cuzco
Ica Apurimac
Ayacucho Puno MARENASS: 28% of households out of
Arequipa extreme poverty and 8.3% out of poverty
Moquegua
0 100 200 Tacna FEAS: 40,000 households benefited
Miles
Chile
PHASE 4
Ecuador Colombia
Tumbes
Loreto
Piura Amazonas
Lambayeque
Cajamarca Brazil
San
Martin
La Libertad SIERRA SUR: 16,000 households out of
poverty (37% of households benefited),
Ancash reduction of chronic malnutrition
Huanuco Ucayali from 36% to 22%
Pasco
Callao, Lima CORREDOR: It takes 30 cents to deliver
Junin
Prov.Constitucion Madre De Dios US$1 of loan investments. Each dollar
Lima Huancavelica invested is leveraged 5 times by beneficiaries
Cuzco
Ica Apurimac
Ayacucho Puno MARENASS: 28% of households out of
Arequipa extreme poverty and 8.3% out of poverty
Moquegua
0 100 200 Tacna FEAS: 40,000 households benefited
Miles
Chile
B
14In phase five (the current phase), two projects were added: one in the Northern
Highlands – Project for Strengthening Assets, Markets and Rural Development Policies
in the Northern Highlands (Sierra Norte, 2009-2015) – and a follow-up project in the
south (Sierra Sur II, 2011-2013). The approach described above has now become the
national programme for the development of the Andean highlands of Peru, supported
by the Government, the World Bank and Kreditanstalt für Wiederaufbau (KfW) (the
German government-owned development bank). Peru is now one of the good
agricultural performers identified in Tables 1 and 2.
The driver in the Peru case was the novel idea, especially during the 1980s, of rural
development being led by local, often indigenous people. IFAD provided a vision and
an external catalyst. This was helped by external funding from IFAD, along with
government funding. Incentives for local participation included competitions among
local farmer groups for the resources provided under the project. The local groups
themselves managed the winning subprojects. M&E was strong, so donors, governments
and local communities had good knowledge of activities and evidence of impact.
Knowledge management components were designed into the projects. Local
communities contributed financially. Government provided the policy space by
formally stating that this project (now programme) was the government’s programme
for agricultural and rural development in the Andes. Government and local
communities developed the capacity to manage, and learning was built into the process.
Institution-building is an important part of scaling up. The Government and IFAD
committed resources and staff over the long term, about a 20-year period that is still
ongoing. The objective was to have impact at scale, not just to have a large-scale
programme. A very long-term focus was key, as this has ensured sustainability. Other
donors are copying the model, for example the World Bank’s Sierra rural development
project (Productive Rural Alliances in the Highlands Support Program, or Aliados,
2007-2013), covering 43 provinces. KfW’s agroenvironmental programme (2003) has
PHASE 5
Ecuador Colombia
Tumbes
Loreto SIERRA NORTE (ongoing): Territorial development
Piura Amazonas as innovation, municipalities match IFAD funds
Lambayeque
Cajamarca Brazil
San
Martin
La Libertad SIERRA SUR: 16,000 households out of
poverty (37% of households benefited),
Ancash reduction of chronic malnutrition
Huanuco Ucayali from 36% to 22%
Pasco
Callao, Lima CORREDOR: It takes 30 cents to deliver
Junin
Prov.Constitucion Madre De Dios US$1 of loan investments. Each dollar
Lima Huancavelica invested is leveraged 5 times by beneficiaries
Cuzco
Ica Apurimac
Ayacucho Puno MARENASS: 28% of households out of
Arequipa extreme poverty and 8.3% out of poverty
Moquegua
0 100 200 Tacna FEAS: 40,000 households benefited
Miles
Chile
B
15IFAD Occasional Paper Series
also incorporated parts of the model. One key aspect related to knowledge
management, known as ‘learning routes’, is being replicated in several African and
Asian countries.
Impact has been independently assessed by the Peruvian Government, and
separately by the Independent Office of Evaluation of IFAD. The evaluations concluded
that this interconnected chain of projects has been highly successful, having
significantly improved food security, reduced malnutrition and poverty, and
empowered local communities.
The lesson is that IFAD, as with other donors, needs to work so as to have a much
greater impact, on a greater number of people, per dollar loaned or granted. The current
IFAD target is to decrease the cost per person brought out of poverty by IFAD resources
from the current figure of about US$83 to US$40. With more beneficiaries per dollar of
investment, the economics of the programme improve as well. But the analysis also
suggests that IFAD can scale up successful projects most effectively when governments
are supportive, as was the case in Peru.
16IV. Conclusions
Evidence appears strong that in the early stages of development and where agriculture
contributes a significant part of GDP, rapid agricultural growth is an effective tool in
reducing poverty. Also relatively solid is the evidence on the types of private and public
investment and policy that stimulate agricultural growth. Conversely, there are policies
and investments that inhibit agricultural growth or have negative impacts on natural
resources, making agriculture less sustainable (massive fertilizer subsidies, export
restrictions, severe farm price controls). A country’s intrinsic agricultural potential is
important. In addition, very poor governance and civil unrest curtail agricultural
growth; good governance and stability help it. Public investment programmes in
agriculture, combined with aid, in large-scale projects focused on proven, successful
approaches can generate very high agricultural growth rates, which in turn contribute to
poverty reduction.
Operating on a large scale, with substantial resources, is no panacea. If policies are
not enabling, or governance very bad, big programmes at scale are much less likely to
work. Scaling up successful projects and policies is effective in generating growth and
poverty reduction, but it will be successful only in countries with good policy
environments under reasonably good governance regimes, and where government is
committed to the programmes.
Though donors are generally not as critical to scaling up as are developing country
governments themselves, they can be helpful, or harmful, to this agenda. The Brookings
Institution analysis regarding the small size of the average project suggests that, on
average, aid agencies are not contributing to the scaling-up agenda. Donors can help by
cofinancing scaled-up projects and programmes that support national programmes.
Brazil, China, the Lao People’s Democratic Republic and Morocco, and more recently
Burkina Faso, Ethiopia, Mali and Peru provide good models. On the other hand, it
seems that scaling up with large donor and public expenditures in poor policy
environments will lead to little growth and little poverty reduction. In these latter
situations, it seems more reasonable to maintain low levels of expenditure on
manageable projects and pilots, while working to improve the policy and governance
environment, laying the groundwork for later scaling up.
17IFAD Occasional Paper Series
References
Birdsal, N., and H. Kharas. 2010. Quality of Official Development Assistance Assessment.
Washington, DC: Global Economy and Development program, Brookings Institution;
Center for Global Development.
De Janvry, A., and E. Sadoulet. 2009. Agricultural Growth and Poverty Reduction: Additional
Evidence. The World Research Observer 25 (1): 1-20.
Diao, X., P. Hazell, D. Resnick and J. Thurlow. 2007. The Role of Agriculture in Development:
Implications for Sub-Saharan Africa. Research Report 153. Washington, DC: International
Food Policy Research Institute (IFPRI).
FAO. 2013. FAO Statistical Yearbook 2013. Rome.
IFAD. 2010a. Rural Poverty Report 2011. Rome.
IFAD. 2010b. Towards Purposeful Partnerships in African Agriculture. Independent Office of
Evaluation of IFAD. Rome.
Islam, N. 2011. Foreign Aid to Agriculture: Review of Facts and Analysis. Washington, DC:
International Food Policy Research Institute (IFPRI).
Linn, J., A. Hartmann, H. Kharas, R. Kohl and B. Massler. 2011. Scaling up the Fight against
Rural Poverty: An Institutional Review of IFAD’s Approach. Working Paper No. 43.
Washington, DC: Global Economy and Development program, Brookings Institution.
World Bank. 2007. World Development Report 2008: Agriculture for Development.
Washington, DC.
18Contacts: Kevin Cleaver Josefina Stubbs Associate Vice-President Director Programme Management Department Latin America and the Caribbean Division IFAD IFAD k.cleaver@ifad.org j.stubbs@ifad.org
International Fund for Agricultural Development
Via Paolo di Dono, 44 - 00142 Rome, Italy
Tel: +39 06 54591 - Fax: +39 06 5043463
E-mail: ifad@ifad.org
www.ifad.org
www.ruralpovertyportal.org
   ifad-un.blogspot.com
   www.facebook.com/ifad
   www.twitter.com/ifadnews
   www.youtube.com/user/ifadTV
You can also read