Investor Presentation - Hersha Hospitality Trust
←
→
Page content transcription
If your browser does not render page correctly, please read the page content below
Investor Presentation

Table of Contents

                                Page
  Hersha Today                    3

  Hersha’s Growth Strategy        6

  HT Markets                     17

  Financials & Sustainability    28

                                       | Page 2
Hersha Today
  HT owns 48 high quality, rooms-oriented, transient hotels in Boston, New York, Philadelphia,
  Washington, DC, South Florida, and the West Coast

  HT’s upgraded portfolio consists of high RevPAR hotels in dense coastal gateway markets and select
  resort locations with strong EBITDA growth potential

  Our unique clusters provide immediate operational advantage and local knowledge to drive
  outperformance in each of our markets

                               Sector Leading                                                     Long-Term Residual
High Absolute RevPAR                                            Income Growth and
                              Margins and Cash                                                        Real Estate
 and EBITDA Per Key                                               Dividend Safety
                                    Flow                                                             Appreciation

  The Envoy, Boston Seaport   The Cadillac Hotel & Beach Club    The St. Gregory, Dupont Circle   The Ritz-Carlton, Coconut Grove

                                                                                                                              | Page 3
Bi-Coastal Portfolio, Clustered for Advantage

                                                                                                       Boston (5 hotels, 801 rooms)
                                                                                                       The Envoy, Boston Seaport
                                                                                                       The Boxer, Boston
                                                                                                       Courtyard by Marriott Brookline                                             New York City (10 hotels, 1,493 rooms)
                                                                                                       Holiday Inn Express Cambridge                                               Hyatt Union Square
                                                                                                       Mystic Marriott Hotel & Spa, CT                                             Duane Street Hotel
                                                                                                                                                                                   NU Hotel, Brooklyn
                                                                West Coast (8 hotels, 1,156 rooms)                                                                                 Hilton Garden Inn Manhattan Midtown East
                                                                                                                                                                                   Hilton Garden Inn Tribeca
                                                                Seattle (1 hotel, 153 rooms)                                                                                       Holiday Inn Express Madison Square Garden
                                                                The Pan Pacific Hotel Seattle                                                                                      Hampton Inn Seaport
                                                                                                                                                                                   Gate Hotel JFK International Airport
                                                                California (7 hotels, 1,003 rooms)                                                                                 Hilton Garden Inn JFK International Airport
                                                                Courtyard by Marriott Sunnyvale                                                                                    Hyatt House White Plains
                                                                TownePlace Suites Sunnyvale
                                                                The Sanctuary Beach Resort, Monterey
                                                                The Hotel Milo, Santa Barbara
                                                                The Ambrose Hotel, Santa Monica                                                                                  Philadelphia (4 hotels, 854 rooms)
                                                                Courtyard by Marriott Los Angeles Westside                                                                       The Rittenhouse
                                                                Courtyard by Marriott Downtown San Diego                                                                         Philadelphia Westin
                                                                                                                                                                                 Hampton Inn Center City/Convention Center
                                                                                                                                                                                 Sheraton Wilmington South

                                                                                                                                                                         Washington, DC (6 hotels, 1,010 rooms)
                                                                                                                                                                         The Ritz-Carlton, Georgetown
                                                                                                                                                                         The St. Gregory, Dupont Circle
                                                                           Miami & Key West (6 hotels, 905 rooms)                                                        The Capitol Hill Hotel
                                                                           The Cadillac Hotel & Beach Club                                                               Hilton Garden Inn M Street
                                                                           The Winter Haven Hotel, Miami Beach                                                           Hampton Inn Washington DC
                                                                           The Blue Moon Hotel, Miami Beach                                                              Annapolis Waterfront Hotel
                                                                           The Ritz-Carlton, Coconut Grove
                                                                           Residence Inn Miami Coconut Grove
                                                                           Parrot Key Hotel & Villas, Key West

*Map excludes HT’s 9 unconsolidated joint venture properties totaling 1,425 rooms; Highlighted hotels represent hotels that underwent significant capital renovations as well as acquisitions
from proceeds of 2015-2018 Capital Recycling program
                                                                                                                                                                                                                         | Page 4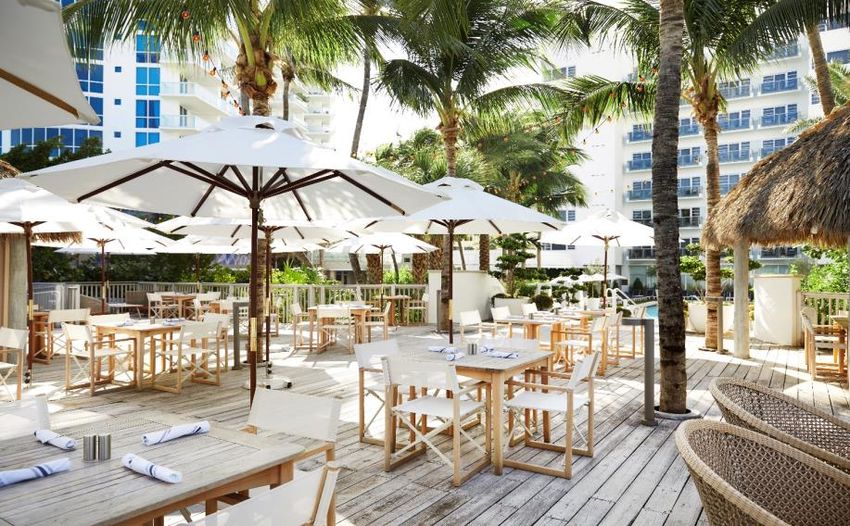
Balanced Portfolio
          HT’s differentiated portfolio provides:                                                                     By Market
                   Exceptional locations and enduring real estate                            West Coast, 20%                             New York City, 24%
                   in the most valuable markets in the U.S.
                   Unique combination of category-killing branded
                   hotels
                   Independent lifestyle                     hotels   with   unique
                   restaurants & bars                                                  Philadelphia, 13%

                                                                                                                                                                      2019F EBITDA Contribution
                                                                                                                                                Washington DC,
                   Purpose-built clusters in each market leverage                                                                                    14%
                   local knowledge and scale/scope to outperform
                                                                                                     Boston, 12%
                                                                                                                    Other, 5%   South Florida, 12%

                                        By Category                                                                   By Chainscale

                                                                                                      Upscale
                                                                       Independent &                   32%
                                                                         Collections
                                                                            38%

                                                                                                                                                         Upper
                                                                                                                                                     Upscale/Luxury
                                                                                                                                                          54%
                  Branded
                    62%

                                                                                                   Upper Midscale
                                                                                                       14%

*Pie charts reflect FY 2019 Forecasted Consolidated EBITDA                                                                                                                       | Page 5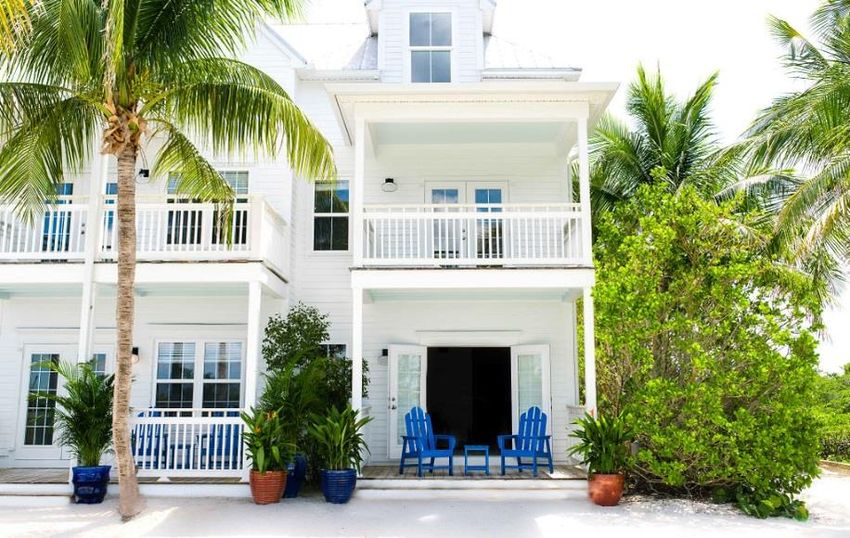
Hersha’s Growth Strategy

Hersha’s Growth Drivers
▪       HT Investment Thesis: Sector Leading, Organic EBITDA Growth
           ▪        Our recent acquisitions, significant investment in CapEx projects and the re-opening of our two
                    largest EBITDA-generating hotels in South Florida are forecast to lead to $200 million of EBITDA

          Ramp-Up of The
                                                                         Growth of ROI-                         Stabilization of Newly
       Cadillac and Parrot Key
                                                                      Generating Renovations                       Acquired Hotels
                Hotels

             $20-25M                                                       $8-10M                                    $4-6M
      ▪        Forecasted EBITDA Generation                           ▪   Forecasted Incremental EBITDA     ▪      Forecasted Incremental EBITDA
               Upon Stabilization                                         Growth of the 7 Hotels                   Growth of the 7 Hotels
                                                                          Renovated in 2018*                       Acquired After June 2016

                     ~10%                                                     ~15%                                    ~20%
      ▪        Contribution to Total Portfolio                        ▪   Contribution to Total Portfolio   ▪     Contribution to Total Portfolio
               EBITDA Upon Stabilization                                  EBITDA Upon Stabilization               EBITDA Upon Stabilization

*Excludes Cadillac Hotel & Beach Club and Parrot Key Hotel & Villas                                                                                 | Page 7
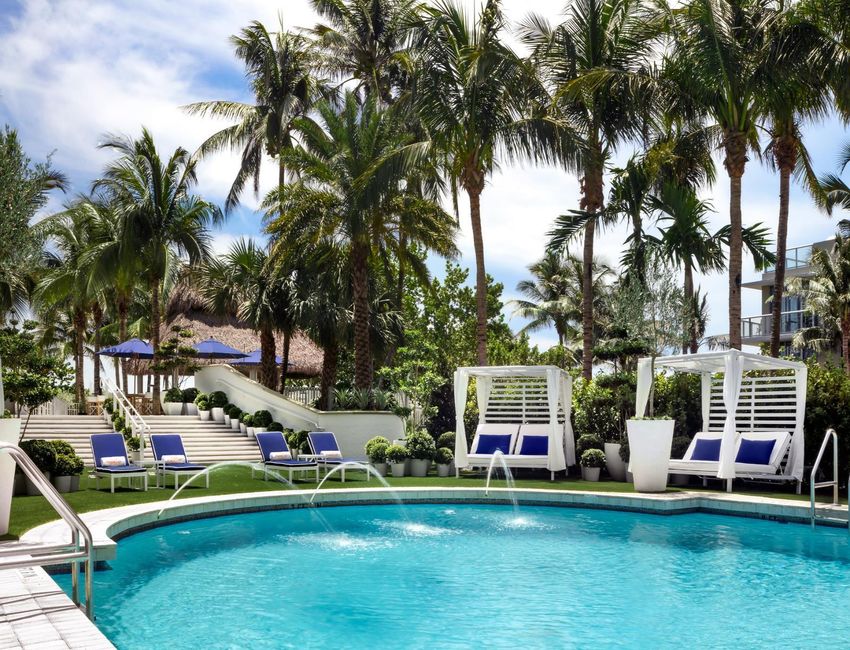
Cadillac Hotel & Beach Club
  Conversion Summary
    Hersha Hospitality Trust (“HT”) converted
    the 357-room Cadillac Hotel & Beach Club
    on Miami Beach from a Courtyard by
    Marriott to an Autograph Collection Hotel

    HT’s total renovation investment was
    $47.3 million, inclusive of the lease
    buyout of the former restaurant tenant

    The lifestyle resort reopened after a
    holistic renovation including all guest
    rooms, F&B outlets and meeting spaces,
    the lobby, both pools and all landscaping

    The opening coincides with the ramp-up
    of the Miami Beach Convention Center
    expansion, expected to drive meaningful
    room night growth over the next several
    years
                                                | Page 8
Cadillac Hotel & Beach Club
  Asset Summary
    Operating at a similar occupancy, the enhanced
    property is forecast to register ADR-driven RevPAR
    growth of over 25% due to the enhanced product
    offering and up‐branding to the Autograph
    Collection

    At stabilization, The Cadillac is forecast to generate
    RevPAR exceeding $200 versus pre-transformation
    RevPAR of $150

    In addition to increased room revenues, the
    restaurants & bars and daily resort fee will generate
    over $3 million of additional revenue

    In 2015, the Miami market‘s peak year, the Cadillac                  Miami Beach Comparable Sales 2014 - Present
    generated approximately $9.5 million in EBITDA.                                                           Price       Per Key
    HT expects The Cadillac to stabilize at close to $15      Date            Property Name             Keys (000's)      (000's)
    million in EBITDA                                        Apr-16         The Sagamore Hotel           93 $63,000        $677
                                                             Mar-16   Confidante Hotel (frm Thompson)   380 $235,000      $618
    Total invested capital of $474K/key remains well
                                                             Jun-15        SLS Hotel South Beach        142 $125,000      $880
    below the replacement cost and comparable sales
                                                             Mar-15        The James Royal Palm         393 $278,000      $707
    which average $719/key
                                                             Feb-15        Miami Beach EDITION          294 $230,000      $782
    Host’s recent acquisition of the 1 Hotel South Beach     Nov-14         Dream South Beach           108   $70,000     $648
    for $1.4M/key showcases the high value and                                        Average Comparable Price per Key:   $719
    desirability of real estate on Miami Beach

                                                                                                                             | Page 9
Parrot Key Hotel & Villas
   Enhancement Summary
    Hersha Hospitality Trust (“HT”) enhanced the
    148-room Parrot Key Hotel & Villas in Key
    West following the hotel’s closure after
    Hurricane Irma

    The total cost of the renovation investment
    was $25 million, the majority of which will
    be covered by insurance recoveries

    The lifestyle resort reopened after a holistic
    renovation including all guest rooms & villas,
    the lobby, all four pools and our award-
    winning landscaping

    The Company converted the café to a full
    service restaurant and bar, The Grove, which
    will serve cocktails and fresh food offerings
    in its newly designed space

    Hersha also took measures to strengthen the
    asset in preparation for any future potential
    weather events including the renovation and
    reinforcement of the retaining seawall

                                                     | Page 10
Parrot Key Hotel & Villas
Asset Summary
Parrot Key is forecast to register ADR-
driven RevPAR growth due to the
enhanced product offering and revenue
management initiatives
Along with increased room revenues,
the addition of The Grove will generate
over $600K of additional F&B revenue
at stabilization
In 2015, the prior peak for the Key West
market, the Parrot Key Resort
generated approximately $7.5 million in Key West Comparable Sales 2013 - Present
EBITDA. At stabilization, we expect to Price Per Key
Date Property Name Keys (000's) (000's)
the hotel to operate at 15% RevPAR Jul-17 Oceans Edge Hotel & Marina 175 $175,000 $1,000
premium and 15% EBITDA premium to Jun-15 Sheraton Suites 180 $94,000 $522
the prior resort Mar-15 The Marker Resort Key West 96 $96,183 $1,002
Feb-14 Pier House Resort & Caribbean Spa 142 $92,700 $653
Total invested capital remains below Nov-13 Hyatt Key West Resort & Spa 118 $76,000 $644
comparable sales which average Aug-13 Southernmost Hotel in the USA 118 $103,788 $880
$783K/key$675K/key Average Comparable Price per Key: $783
| Page 11Hersha’s Growth Drivers
Growth of ROI-Generating
Renovations
$8-10M
▪ Forecasted Incremental EBITDA Growth
of the 7 Hotels Renovated in 2018*
~15%
▪ Contribution to Total Portfolio EBITDA
Upon Stabilization
*Excludes Cadillac Hotel & Beach Club and Parrot Key Hotel & Villas | Page 12Strategic Capital Allocation
CAPEX ENHANCEMENTS DISCIPLINED BUYBACKS
$160M ✓ Total allocated to capital
expenditures from 2017-2018 $241M ✓ Total common stock
repurchased since 2014
✓ Allocated to 7 ROI-generating ✓
24%
Percentage of total float
$77M projects, excluding The Cadillac
and Parrot Key hotels
repurchased since 2014
✓ Weighted average price of
✓ Incremental EBITDA generation shares repurchased from 2017
$8-10M from these 7 hotels following
their transformation $17.44 to 2019
✓ Forecasted capex spend on our ✓
25-30%
Targeted discount to NAV range
$32M portfolio in 2019, inclusive of
maintenance capex, leading to
less portfolio disruption
for repurchasing common stock
✓ Shares purchased by executive
$25M+ ✓ Forecasted Free Cash Flow
generated in 2019 to allocate
$1.9M management and board of
trustees since 2016
towards debt repayment
| Page 13Hersha’s Growth Drivers
Stabilization of Newly
Acquired Hotels
$4-6M
▪ Forecasted Incremental EBITDA Growth
of the 7 Hotels Acquired After June 2016
~20%
▪ Contribution to Total Portfolio EBITDA
Upon Stabilization
| Page 14Portfolio Recycling Campaign
FOCUSED ACQUISITIONS CALCULATED DISPOSITIONS
✓ Total acquisition of 13 assets
$857M from 2015-2018
$920M ✓ Total sale of 20 non-core assets
from 2016-2018
3.5X ✓ YoY Growth in RevPAR and
EBITDA vs. Dispositions 13.7% ✓ Unlevered IRR at Sale
28% ✓ Increase in Absolute RevPAR
compared to hotels sold $270M ✓ Taxable gains deferred
Northeast Dispositions
West Coast Recycling Massachusetts
Residence Inn Framingham
Acquisitions Residence Inn Norwood
The Pan Pacific Hotel Seattle Hawthorn Suites Franklin
Courtyard by Marriott Sunnyvale
TownePlace Suites Sunnyvale New York City
The Sanctuary Beach Resort, Monterey Cindat JV Portfolio (7)
The Ambrose Hotel, Santa Monica Hampton Inn Financial District
Holiday Inn Express Chester
Dispositions
Hyatt House Pleasanton, CA Pennsylvania
Hyatt House Pleasant Hill, CA Hyatt House King of Prussia, PA
Hyatt House Scottsdale, AZ
Maryland/Virginia
Residence Inn Greenbelt, MD
Hyatt House Gaithersburg, MD
Residence Inn Tysons Corner, VA
Courtyard Alexandria, VA
Acquisitions
Dispositions | Page 15Acquisition Case Study: Annapolis Waterfront Hotel
Acquired at a trailing LTM cap rate of 8.7% and
EBITDA multiple of 10.4x, the Annapolis Waterfront
is immediately accretive to our portfolio
The Annapolis Waterfront Hotel features a diverse,
stable cash flow profile, including more than $1.2
million of third‐party income from the restaurant
lease, slip rental fees and various antenna leases(1)
The Hotel is situated on the Harbor adjacent to the
town square, the Annapolis Yacht Basin and the
Annapolis Yacht Club, at the base of Main Street’s
restaurant and bars. It is a short 3-block walk from
the Main Gate of the United States Naval Academy,
all local tourism attractions and demand generators
In addition to the hotel’s 150 rooms, the Annapolis
Waterfront Hotel features 15,000 sq. feet of total
indoor/outdoor space, including the city’s only Annapolis Waterfront Comp Set
Key Hotel Keys Opening Date
waterfront ballroom, a leased waterside restaurant 1 Annapolis Waterfront Hotel 150 Jun-1969
2 Historic Inns Of Annapolis 124 Jun-1772
& bar and 8,500 sq. foot patio overlooking the 3 Loews Annapolis Hotel 215 Jun-1985
Chesapeake Bay 4 Hilton Garden Inn Annapolis (Former O'Callaghan) 121
5 Westin Annapolis 225
Apr-2018
Jul-2007
Total 835
(1)Based on 2017 Actual Results | Page 16HT Markets
Philadelphia
            Our Philadelphia portfolio was aided by
            performance from our recently renovated assets
            resulting in 16.4% RevPAR growth in Q1 2019,
            outperforming the market by over 2,500 basis points

            We completed significant capex projects at The
            Rittenhouse and Hampton Inn Center City during the
            first half of 2018 and these renovations helped drive
            revenue and margin growth during the first quarter

            We strategically timed our renovations to take
            advantage of one of Philadelphia’s strongest
            convention calendar years in its history(1)
                                                                                                                                 The Philadelphia     Hampton Inn
                                                                                                           The Rittenhouse
                                                                                                                                     Westin         Convention Center

                                                                                                               At the Philadelphia Westin, our strategy of growing
                                                                                                               corporate base while diminishing the reliance on
                                                                                                               OTA-driven business has yielded strong results
                                                                                                               since our acquisition(2)

                                                                                                                       12% ADR Growth
                                                                                                                       13% RevPAR Growth
                                                                                                                       200 bps of EBITDA margin improvement
                                                                                         The Rittenhouse
(1)   Philadelphia Convention & Visitors Bureau (2) Based on consensus estimates or Company estimates
                                                                                                                                                                 | Page 18
Boston
The Boxer, Boston
Boston Portfolio
1 The Envoy, Boston Seaport
2 The Boxer, Boston
3 Courtyard by Marriott Brookline
4 Holiday Inn Express Cambridge
5 Mystic Marriott Hotel & Spa, CT
Our comparable Boston portfolio generated 3.8%
RevPAR growth in Q1 2019, aided by a 3.1% ADR
increase
The Boston market experienced soft demand in the
The Envoy, Boston Seaport
first quarter, but performance from The Envoy
allowed our cluster to outperform the market by 590
basis points
We remain confident in the city’s demand
fundamentals for years to come with its world class
universities, top-rated hospitals, and a leading R&D
sector
Our Envoy Hotel has performed exceptionally well
with RevPAR forecasted at 24% above our 2016
acquisition year levels and we believe the hotel’s
market leading stance will support continued growth
| Page 19West Coast
The Ambrose Hotel, Santa Monica
West Coast Portfolio
1 The Pan Pacific Hotel, Seattle
2 The Ambrose Hotel, Santa Monica
3 The Sanctuary Beach Resort, Monterey
4 The Hotel Milo, Santa Barbara
5 Courtyard by Marriott Sunnyvale
6 TownePlace Suites Sunnyvale
7 Courtyard by Marriott Los Angeles Westside
8 Courtyard by Marriott Downtown San Diego
Robust performance at our Sunnyvale and San Diego assets
was offset by supply growth in Seattle and Los Angeles along
with severe weather impacting demand along the coast
The Sanctuary Beach Resort, Monterey
Lodging fundamentals on the West Coast are expected to
remain compelling in 2019, driven by strong demand from
domestic and international leisure travelers and growth in
technology and life sciences companies in the regions
Our Sunnyvale hotels reported weighted average RevPAR
growth of 7.4% as they captured increased demand from
large corporate accounts such as Amazon, Google and Apple.
Large Google and Apple events in Q2 will help to continue to
drive growth at these properties
Our resort destinations in Santa Barbara and Monterey are
poised to rebound in the second quarter with more suitable
travel weather on the horizon and the U.S. Open taking place
at Pebble Beach in June
| Page 20South Florida
The Ritz-Carlton, Coconut Grove
South Florida Portfolio
1 The Cadillac Hotel & Beach Club
2 The Winter Haven Hotel, Miami Beach
3 The Blue Moon Hotel, Miami Beach
4 The Ritz-Carlton, Coconut Grove
5 Residence Inn, Coconut Grove
6 Parrot Key Hotel & Villas, Key West
In Q1 2019, our comparable South Florida portfolio
faced a difficult Hurricane Irma-relief comp, but was
able to generate positive RevPAR growth
The reacceleration of Miami remains intact, but near-
term growth will continue to face headwinds from the The Cadillac Hotel & Beach Club, Miami Beach
re-opening of hurricane-damaged hotels in Puerto
Rico and the Caribbean along with the ramp up of the
Miami Beach Convention Center
Our Cadillac Hotel & Beach Club and Parrot Key Hotel
& Villas are currently ramping with Q1 2019 ADR
performance comparable to prior peak periods for the
market
Despite revenues tracking towards prior peak,
operating margins are in ramp-up mode and we
remain confident in our ability to progressively close
this gap as we track towards stabilization
| Page 21Washington, DC
The Capitol Hill Hotel
Washington, DC Portfolio
1 The Ritz-Carlton, Georgetown
2 The St. Gregory, Dupont Circle
3 Annapolis Waterfront Hotel
4 The Capitol Hill Hotel
5 Hilton Garden Inn M Street
6 Hampton Inn Washington, DC
Despite continued market headwinds in the first quarter,
our comparable portfolio generated slightly positive
RevPAR growth and outperformed the market by 330 basis
points The St. Gregory, Dupont Circle
Our growth was driven by performance at our St. Gregory
in Dupont Circle, which is ramping following its holistic
renovation in 2018
The second quarter will remain soft for the market with
the Easter shift to April resulting in Congress out of session
while the city has just 1 major convention versus 3 last
year and new supply continues to enter the market
We remain confident in the long-term fundamentals of DC
and our positioning in the market with our market leading
cluster of hotels
| Page 22Manhattan
Manhattan Portfolio Duane Street Hotel
1 Hyatt Union Square
2 Duane Street Hotel
3 Hilton Garden Inn Manhattan Midtown East
4 Hilton Garden Inn Tribeca
5 Holiday Inn Express Madison Square Garden
6 Hampton Inn Seaport
Demand fundamentals were especially soft in New York
City during the first quarter as the market was impacted
by
The government shutdown
Easter holiday shift Hyatt Union Square
Fewer group conventions
No major mid-week snowstorms in March
Despite a weak first quarter, we remain positive in the
long-term fundamentals of New York as it remains the
most dynamic lodging market in the country and is a
global business hub for all industries
HT’s purpose-built cluster and unique operational
alignment offers us the capability to outperform and
maintain market-leading margins in the market’s current
low-single-digit RevPAR environment
| Page 23Manhattan Demand – Diversified and Expanding
Increased Demand: NYC demand for hotel rooms has grown at a 4.9% CAGR since 2015(1)
Visitation to New York City reached a record 62.8 million in 2017, and grew by 3.8% to 65.2 million in 2018, which includes 13.5
million international visitors(2)
In 2018, there were 1.1 million visitors from China, the second-leading source of foreign visitors to the city behind the UK (1.24
million)(2)
Additional demand generators include Hudson Yards, the largest private real estate development in the U.S., the corporate
footprint growth in life sciences, the continued transformation of Lower Manhattan, Silicon Alley, and the expansion of other
Midtown corridors
Midtown East Transformation: New zoning regulations in Midtown East are leading to revamped office
development to compete with Hudson Yards
The 1,200-room Grand Hyatt Hotel will be demolished and redeveloped into 2 million square feet of office and retail space along
with a smaller hotel
Increased Capacity: From 2018 – 2020, the New York Building Congress anticipates $177 billion in Total
Construction Spending, driven by strong demand for office space and industrial development, as well as a rebound in
government infrastructure investment(3)
LaGuardia Airport’s $4 billion expansion scheduled for completion in 2021 is expected to drive passenger growth of 23% within the
next 5 years, equivalent to 5.5 million travelers(4)
Additional expansions planned in Manhattan to drive visitation with $1.6 billion allocated to renovating Moynihan Train Hall and
$1.2 billion allocated to the Javits Convention Center expansion
(1)CBRE; (2) NYC and Company ; (3) NY Building Congress; (4) Cushman & Wakefield
| Page 24HT Manhattan Supply Forecast Accuracy
HT’s estimate of 3.0% supply growth in Manhattan for 2018 was just 10 basis points higher
than the actual growth whereas the consultant forecasts missed the mark by 530 basis
points and 290 basis points, respectively
Over the past 5 years, HT’s forecasts have been markedly more accurate in comparison to
other industry forecasts when forecasting supply growth in Manhattan
Consultant’s forecasts tend to be higher than the supply actually delivered as supply tends
to decrease due to delays and natural attrition that push projects into subsequent years
Manhattan New Supply Forecast
HT PwC STR/Citi Manhattan Supply
2019 3.8% 4.4% 5.9% HT Var vs. PwC Var vs. STR Var vs.
Actual HT Actual (bps) PwC Actual (bps) STR Actual (bps)
3,784 4,607 6,186
2018 2.9% 3.0% (10) 8.2% (530) 5.8% (290)
2020 3.6% 3.4% 1.8%
2017 2.7% 2.9% (20) 7.5% (480) 12.1% (940)
3,663 3,691 1,815
2016 5.0% 4.5% 50 10.6% (560) 7.3% (230)
2021 2.5% 3.1% 1.3%
2015 2.7% 4.1% (140) 9.6% (690) 8.1% (540)
2,620 3,296 1,291
2022+ 2.0% 1.5% 0.3% 2014 3.1% 6.4% (330) 7.6% (450) 8.3% (520)
1,594 1,566 250 2013 4.1% 4.5% (40) 6.9% (280) 6.7% (260)
Apr-19 Feb-19 Jan-19
*Historical forecasts from beginning of stated year; HT estimates as of April 2019 site visits
| Page 25Manhattan Supply
HT estimates above average supply growth in 2019 and 2020 as construction delays have pushed back delivery
times. Demand remains robust in Manhattan and is forecasted to offset this growth
Approximately 78% of rooms expected to be delivered through 2021 are located in Midtown(1)
HT forecasts new supply to return to more normalized levels of 2.0% in 2022 and beyond
M1 Zoning Impact on New Construction
New York City Department of City Planning passed an amendment to establish a special permit for new hotels in M1 zoning
districts. ~30% of the hotel rooms in the pipeline are slated to be built in M1 zones and currently there have been zero
applications filed for hotel special permits. City Council provided final approval on December 20, 2018(2)
Manhattan Supply and RevPAR Growth
15.0%
12.6%
10.0%
5.8% 5.9% 5.5%
5.3% 5.6%
4.9%
5.0% 3.9% 3.8% 3.6%
2.5% 2.6% 2.6% 2.9% 2.9% 2.5% 2.5%
1.9% 2.3%
1.5%
0.5%
0.0%
-1.3%
-2.9% -2.8%
-5.0%
2010 2011 2012 2013 2014 2015 2016 2017 2018 2019(F) 2020(F) 2021(F)
Manhattan Supply Growth Market RevPAR Growth
(1)STR 2019-2021; Supply reflects HT’s internal estimates per April 2019 site visits; 2019 -2021(F) Manhattan RevPAR growth per CBRE February 2019; (2) NYC.Gov | Page 26Airbnb: Shadow Supply Decelerating
Over the past two years, Airbnb has evolved from a significant disruptor to Lodging to a diminishing threat
with the rate of growth decelerating
Growth in Airbnb units has declined across the U.S. as a result of legislations in major cities leveling the
playing field versus its hotel competition
Each of our core markets have enacted legislation to heavily tax or eliminate illegal listings on home-
sharing sites with a focus on eliminating commercial landlords. These legislations have resulted in a
decrease in listings
Regulations passed in New York City and Boston are currently being contested in court after Airbnb filed a lawsuit
claiming the bills are unconstitutional
Home & Villas by Marriott’s bespoke offering is geared towards the higher-end leisure traveler with longer
stay requirements in markets where Marriott has less of a footprint. The program’s target locations are in
unique, high-end destinations and not urban centers where are our portfolio is primarily focused
Home & Villas is kicking off with 2,000 homes internationally which compares to more than 7,000 hotels and over
1.3 million rooms in the current Marriott system(1)
(1) Marriott International SEC Filing and Press Release
| Page 27Financials and Sustainability
Capitalization
          Debt                                                                                          $ Millions
                                                                                                                                                                Pro Forma Capitalization as of
                                                                                                                                                                        3/31/2019

                                                                                                        Share Price as of 05/02/2019                                                      $19.32
                   Historic and target leverage of 4.0x-
                                                                                                        Common Shares + Units                                                               43.5
                   5.0x
                                                                                                        Equity Market Capitalization                                                      $840.4

                   Weighted average interest rate of                                                    Mortgages & Notes Payable                                                          384.5
                                                                                                        Unsecured Term Loan                                                                698.4
                   4.4% across all borrowings with an                                                   Line of Credit                                                                      37.0
                   approximately 3.0 year life to maturity                                              Total Consolidated Debt                                                         $1,119.9

                                                                                                        Preferred Stock Series C                                                            75.0
                   86% of debt is either fixed, capped or                                               Preferred Stock Series D
                                                                                                        Preferred Stock Series E
                                                                                                                                                                                           192.5
                                                                                                                                                                                           100.0
                   swapped                                                                              Total Consolidated Debt + Preferred Equity                                      $1,487.4

                                                                                                        Consolidated Equity & Debt Capitalization                                       $2,327.8

          Preferred Equity                                                                              HT Pro Rata Share of Unconsolidated Joint Venture
                                                                                                                                                                                           141.5
                                                                                                        Debt

                   Historically low 6.6% weighted
                                                                                                        Total Capitalization                                                            $2,469.3
                   average coupon
                                                                                                        Cash & Cash Equivalents                                                             33.5
                                                                                                        Deposits                                                                                 8.7

          Common Dividend Secure                                                                        Total Enterprise Value (TEV)                                                    $2,427.1

                                                                                                        Net Consolidated Debt / TEV                                                        44.4%
                   2019 payout reflects an approximate                                                  Net Consolidated Debt + Pref / TEV                                                 59.5%
                                                                                                                                                  (*)
                   50% AFFO payout                                                                      Net Consolidated Debt / 2019E EBITDA
                                                                                                                                                          (*)
                                                                                                                                                                                             6.0x
                                                                                                        Net Consolidated Debt + Pref / 2019E EBITDA                                          8.0x
                                                                                                                                                   (*)
                                                                                                        2019E EBITDA / 2019E Interest Expense                                                3.5x

(*) EBITDA reflects consensus estimates or Company estimate. Net Consolidated Debt above = Consolidated Debt less Cash & Cash Equivalents and Deposits.                                           | Page 29
2019 Guidance
Following a challenging Q1’19 operating environment we are maintaining our 2019 operating
outlook. We remain constructive regarding the growth prospects of our portfolio of newly
renovated and acquired assets without significant headwinds such as difficult comps, the
government shutdown and exogenous impacts in New York City
Q2'19 Outlook 2019 Outlook
($’s in millions except per share amounts) Low High Low High
Net Income Applicable to Common Shareholders ($1.00) $1.00 ($22.0) ($16.0)
Net Income per share ($0.03) $0.02 ($0.56) ($0.41)
Comparable Property RevPAR Growth 2.5% 3.5% 1.5% 3.0%
Comparable Property EBITDA Margin Growth 0.0% 0.5% -0.25% 0.25%
Adjusted EBITDA $54.0 $56.0 $178.0 $184.0
Adjusted FFO $34.0 $36.0 $96.0 $102.0
Adjusted FFO per share $0.79 $0.83 $2.22 $2.35
| Page 30HT Debt Maturities
The Company is actively refinancing all near-term debt maturities and our capital
structure has significant flexibility to take advantage of an extremely liquid debt
environment
Consolidated Debt Maturities
$500.0
$450.0
$400.0 Total 2020:
$355.8
Total 2022:
$350.0 $323.3
$55.8
Debt ($ Millions)
$300.0 $37.0
Line of Credit
Total 2021: Trust Preferreds
$250.0 $217.3 $79.3
Mortgage Debt
$200.0 $23.4
Term Loan
Total Thereafter:
$150.0 $300.0 $134.8
$207.0 $51.5
$100.0 $193.9
Total 2019: Total 2023:
$45.1 $47.6
$50.0
$83.3
$45.1 $47.6
$.0
2019 2020 2021 2022 2023 Thereafter
* As of March 31, 2019, Excludes OID/OIP
** Assumes exercise of extensions
| Page 31Sustainability & Financial Impact
EarthView® was strategically created to positively impact Financial Impact and Achievements
our hotels’ bottom lines while simultaneously improving
the well-being of our guests, employees, communities, $65 Million increase in portfolio value
and our planet attributed to energy efficiency initiatives
Founded in 2010, EarthView demonstrates Hersha’s 2.5 year average payback period for our
leadership in sustainable hospitality efficiency investments
Aligned with investors’ growing interest in material $11 Million in savings since inception
environmental, social, and governance (ESG) topics through initiatives implemented across our
portfolio
NAREIT Leader in the Light
Hersha is a 4-time winner of NAREIT’s
Lodging and Resorts Leader in the Light award
Global Real Estate Sustainability Benchmark
(GRESB) Score: 86 Ranks HT in the top 10%
of all participants globally across all real estate
asset classes
* More information on Hersha’s ESG and Sustainability Program can be found on our website and in Hersha’s annual Sustainability Report | Page 32Environmental Impact
Our buildings and operations run efficiently through the Environmental Impact
implementation of initiatives that reduce our energy and
water usage 15% reduced
2010
energy usage per sqft vs
LED Lighting: More efficient than incandescent and fluorescent
lighting, installed at 95% + of our hotels
Guestroom Energy Management Systems (EMS): Programmed to
41% reduced greenhouse gas emissions
per sqft vs 2010
reduce energy consumption while rooms are unoccupied, saving our
hotels 25-30% in heating and cooling costs reduced water usage per sqft vs
Laundry Water Reuse System: Reduces water consumption from
3% 2010
laundry cycles by 65-80%
Discontinued use of Single Use Plastic Straws and Stirrers: Our hotels 25% diversion rate in 2018
avoid using over 4 million pieces of plastic straws and stirrers a year
We plan to expand our renewable energy mix to include Resiliency
additional on-site installations and explore off-site We recognize climate phenomenon may have an
options impact on our portfolio and regularly review the
prevalence of environmental risk
Flood Risk NOAA Average Score of Hersha
Hazard Score portfolio is 1.3 vs 2.8 average
(1-10, 1=low risk)
risk for US Lodging REITs*
*NOAA = National Oceanic Atmospheric Administration,
Morgan Stanley Flood Risk Report 3/2019
Greenroof at Hersha’s Hilton 336-panel solar photovoltaic system on the
Garden Inn M Street, DC, a LEED roof of Residence Inn Coconut Grove, FL
Certified hotel | Page 33Social and Governance Initiatives
EarthView embodies HT’s core values and A strong corporate governance foundation is
reflects our long tradition of social essential to our company’s goal of continuing
responsibility, impacting all of our stakeholders to operate at the highest level of
performance
Through a strong presence in our communities,
we help to drive positive change on a local and Our Risk Sub-Committee promotes active and
global scale focused discussion of risk and risk oversight
Social Metrics Governance Metrics
17,150 hours volunteered in our local communities Board Independence: 6 out of 8 Board Members are
since 2015 Independent Trustees
$440,000 raised for autism awareness since 2015 Board Diversity: 50% Women and Minority Board Members
$200,000+ raised from the sale of EarthView Water Leadership Structure: Separate Board Chair and CEO
since 2014, providing clean water for communities in
need around the world
Strong Alignment: Short-term and long-term incentives
500,000 new bars of soap sent to developing nations 100% based on performance; 83% NEO pay in Equity
since 2011
| Page 34Forward Looking Statements
Certain matters within this presentation are discussed using “forward-looking statements” within the meaning of the safe
harbor provisions of the Private Securities Litigation Reform Act of 1995, and, as such, may involve known and unknown risks,
uncertainties and other factors that may cause the actual results or performance to differ from those projected in the forward-
looking statements. These forward-looking statements may include statements related to, among other things: the Company’s
2019 outlook for net income attributable to common shareholders, net income per weighted average common share and OP
Units outstanding, Adjusted EBITDA, AFFO, AFFO per weighted average common share and OP Unit outstanding, consolidated
and comparable RevPAR growth and consolidated and comparable Hotel EBITDA margin growth, economic and other
assumptions underlying the Company’s 2019 outlook and assumptions regarding economic growth, labor markets, real estate
values and the economic vibrancy of our target markets, the Company’s ability to grow operating cash flow, leverage rate-
driven revenue growth, return capital to its shareholders, whether in the form of increased dividends or otherwise, the
Company’s ability to match or outperform its competitors’ performance, the ability of the Company’s hotels to achieve
stabilized or projected revenue consistent with our expectations, the stability of the lodging industry and the markets in which
the Company’s hotel properties are located, the Company’s ability to generate internal and external growth, the Company’s
ability to increase margins, including hotel EBITDA margins. Forward-looking statements are neither historical facts nor
assurances of future performance. Instead, they are based only on the Company’s current beliefs, expectations and
assumptions regarding the future of its business, future plans and strategies, projections, anticipated events and trends, the
economy and other future conditions. Because forward-looking statements relate to the future, they are subject to inherent
uncertainties, risks and changes in circumstances that are difficult to predict and many of which are outside of the Company’s
control. The Company’s actual results and financial condition may differ materially from those indicated in the forward-looking
statements contained in this press release. Therefore, you should not rely on any of these forward-looking statements. For a
description of factors that may cause the Company’s actual results or performance to differ from its forward-looking
statements, please review the information under the heading “Risk Factors” included in the Company’s Annual Report on Form
10-K for the year ended December 31, 2018 filed by the Company with the Securities and Exchange Commission (“SEC”) and
other documents filed by the Company with the SEC from time to time.
| Page 35You can also read