COMPANY PRESENTATION - Mar 2019 - Minor International
←
→
Page content transcription
If your browser does not render page correctly, please read the page content below

COMPANY PRESENTATION – Mar 2019
Forward Looking Statement
Statements included or incorporated in these materials that use the words "believe", "anticipate", "estimate", "target", or "hope", or that otherwise
relate to objectives, strategies, plans, intentions, beliefs or expectations or that have been constructed as statements as to future performance or
events, are "forward-looking statements" within the meaning are not guarantees of future performance and involve risks and uncertainties that could
cause actual results to differ materially from historical results or those anticipated at the time the forward-looking statements are made. MINT
undertakes no obligation to publicly update or revise any forward-looking statement, whether as a result of new information, future events or
otherwise. MINT makes no representation whatsoever about the opinion or statements of any analyst or other third party. MINT does not monitor or
control the content of third party opinions or statements and does not endorse or accept any responsibility for the content or the use of any such
opinion or statement.

                                                                                                                                                        2
AGENDA
 2018 Performance
 Recap
 Minor Hotels
 Minor Food
 Minor Lifestyle
 Corporate Information
 & Five-Year Strategy
NH Collectiion Grand Hotel Convento di Amalfi

                                                PERFORMANCE RECAP
2018 Performance Recap
In 2018, MINT successfully completed the investment in NH Hotel Group (NHH), which was immediately accretive. As a result, MINT reported core
net profit growth of 10% for the year, primarily attributable to the core organic hotel business and contribution from NHH, despite the headwinds
of the weak macro backdrop, which resulted in soft performance of the restaurant business.

                                                    REVENUE                                             2018 REVENUE CONTRIBUTION
THB million                                                         +34%                 +35%
                                                                                                            Minor Lifestyle
  80,000                                                            78,499               79,328                  6%
                                                                                                                                  Minor Food
                                                                                                                                     30%

  60,000        58,644

                                                                                                   Minor Hotels
  40,000                                                                                              64%
                2017           Minor        Minor        Minor      2018     Non-core     2018
                               Hotels       Food        Lifestyle   Core      Items     Reported                               * Excludes non-core items

                                                NET PROFIT                                             2018 NET PROFIT CONTRIBUTION
 THB million                                                        +10%                 +1%                 Minor Lifestyle
                                                                                                                  2%
                                                                    5,957
   6,000        5,415                                                                                                             Minor Food
                                                                                         5,445
                                                                                                                                     26%

   4,000

   2,000                                                                                            Minor Hotels
                2017           Minor        Minor        Minor      2018     Non-core     2018         72%
                               Hotels       Food        Lifestyle   Core      Items     Reported                               * Excludes non-core items

* Non-core items are detailed on page 40.                                                                                                                  5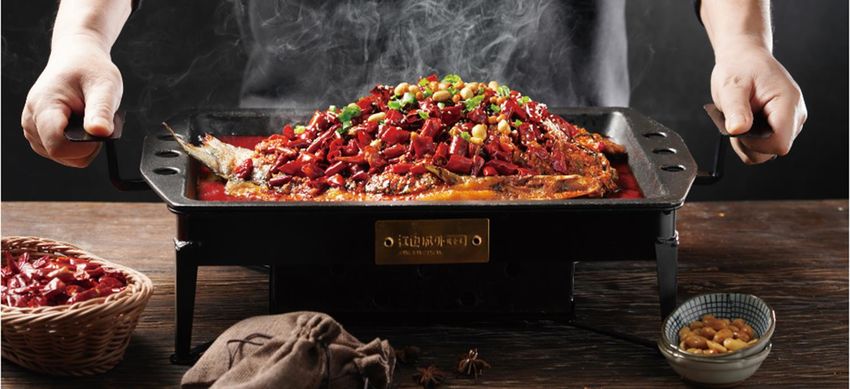
International Presence
With solid diversification strategy, MINT’s footprint was in 62 countries at the end of 2018 across its hospitality and restaurant businesses.

              Minor Hotels
              Minor Food
              Combination

                 REVENUE CONTRIBUTION

100%
           13%
 75%                 49%                     International
                             61%     72%
 50%                                         Thailand
           87%
 25%                 51%
                             39%     28%
  0%
          2008      2017     2018*   2023F
 * Excludes non-core items
                                                                                                                                                 6
Dividends and Warrants
MINT Board of Directors announced the resolution for dividend payment and warrant issuance, both of which are subject to shareholders’
approval. The Annual General Meeting of Shareholders will be held on 22 April 2019.

                                   DIVIDEND PAYMENT                                                                     WARRANT ISSUANCE

 • Cash dividend of THB 0.40 per share                                                       • Issuance of warrants on ordinary shares (MINT-W6)
 • Total cash not exceeding THB 1,848 million                                                • Offering to existing shareholders at no cost, at the ratio of 20 ordinary
                                                                                               shares to one unit of warrant, pro rata to existing shareholders
 • XD on 26 April 2019
                                                                                             • Dilution of 4.76%
 • Record date to determine the rights of shareholders on 29 April 2019
                                                                                             • Tenor: Approx 2 years 4 months
 • Dividend payment date on 15 May 2019
                                                                                             • Exercise ratio of 1 unit of warrant per 1 ordinary share
   THB                                                                                       • Exercise price of THB 43 per share
   0.40        35.6%                          33.7%                                    40%   • Record date on 29 April 2019 to determine the shareholders entitled to
                              32.8%                         32.8%
                                                                               31.0%           receive MINT-W6
   0.30         0.10                                                                   30%
                                                                                             • Assuming all warrants are converted, total cash received will be approx.
   0.20                                                                                20%     THB 9.9 billion
                                                             0.40              0.40
                               0.35           0.35
   0.10         0.25                                                                   10%   MINT WARRNT HISTORY
                                                                                                1999                          2006              2010            2014
      -                                                                                0%
                2014           2015           2016           2017              2018
                                                                                              MINT-W2                       MINT-W3           MINT-W4         MINT-W5
                    Cash              Stock              Payout Ratio
                                                                                               5-years                       2-years           3-years         3-years
   * EPS calculation based on core operations, excluding non-recurring items                 10% Dilution                  10% Dilution      10% Dilution    5% Dilution
                                                                                                                                                                           7
Update on NHH Integration
  MINT has already started to work with NHH to identify, formulate and quantify the potential synergistic benefits. The process is expected to take 6
  months. Task force from both Minor Hotels & NHH have already been assigned to collaborate across various functions and below are the key initial
  findings that have been identified and pursued.
        Dec                                 Jan                                Feb                               Mar                                 Apr                           May
        2018                               2019                               2019                               2019                               2019                           2019
                                                         NHH Budget & Standalone 5-Year Plan
                                                                       Identification of Integration Initiatives
                                                                                                                                     Finalization & Market Release
                                                                             Implementation of Integration

                                                              NEGOTIATION WITH                        COMBINATION OF                      LEVERAGE ON
  TIVOLI INTEGRATION              BRAND STREAMLINE                                                                                                                    LOYALTY INTERFACE
                                                                TRADE PARTNERS                         GLOBAL SALES                     HUMAN CAPITAL
• Transfer of Portugal &        • Joint brand positioning • Both Minor Hotels &                  • NHH hotel portfolio has          • Initial movements are         • Respective database
  Brazil Tivoli operations        has been agreed.           NHH uniformly reached                 been incorporated in               planned:                        analysis has been
  is in process.                • Over 5 hotels have         out to partners for                   MINT websites.                     ‒ GM from Minor                 completed.
• NHH is in the process           been identified as         improved and win-win                • Vision has been defined               Hotels to NHH;             • Both parties are
  of identifying                  potential accretive        pricing scheme based                  for websites at both               ‒ Operations &                  analyzing terms and
  synergies through               rebrand so far, of which   on enlarged portfolio.                group and brand levels.               revenue                      benefits.
  efficiencies across             3 to Anantara.           • Partners include OTAs,              • Cross-selling has started;            management from            • Global loyalty vision
  sales & marketing,            • Strong interests for new travel agents and                       China office for Spanish              NHH to Minor                 and roadmap to be
  procurement & back              expansion have been        procurement suppliers.                hotels, Thailand office for           Hotels.                      defined by 3Q19,
  office.                         identified for both           • Proposals are being              German hotels, Madrid            • Further employee                including assessment
                                  MINT and NHH brands             discussed with                   office for Oaks.                   mobility policy is in           on merger, cross
                                  across geographies.             suppliers to include the                                            process.                        redemption and cross
                                                                                                 • Joint-salesforce roadmap
                                                                  combined portfolio.              has been agreed.                                                   accumulation.
* Note that transactions and agreements are conducted in arms-length manner under MINT and NHH approved protocols (Governance Framework signed 7th February 2019)                             8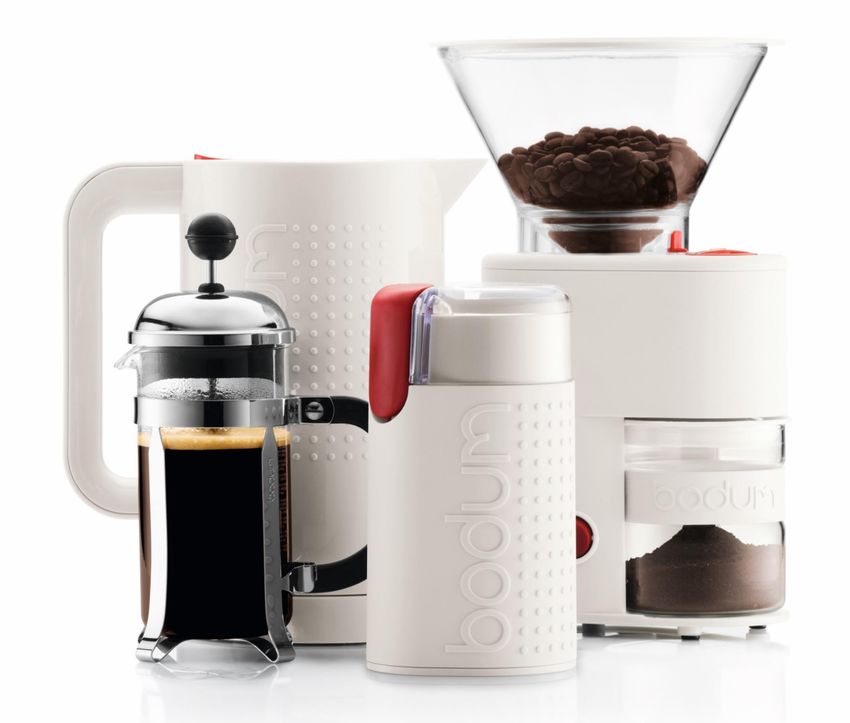
MINOR HOTELS

Anantara Quy Nhon Villas
Minor Hotels – Financial Highlights
2018 revenue of Minor Hotels grew by 63%, as a result of owned & leased and management hotels from both organic operations and consolidation
of NHH. 2018 EBITDA increased by 60%, with robust NHH profitability partially offset by the higher personnel-related expenses of Australian
operation and lower profitability of mixed-use business. Net profit grew by 28%, at a slower rate than revenue and EBITDA because of higher
interest expenses to finance the acquisition of NHH, higher minority interest and tax rate of NHH.
                                                                         +63%                                                          KEY HIGHLIGHTS
 THB million
                                                                         50,577             Owned & leased hotels                • Revenue grew by 117%, as a result of:
                                                           30,970                           75%                                     ‒ Organic growth of 24% from all key markets; i.e.
                                              27,758                                                                                  Thailand, Brazil, Portugal and Africa, and
                                23,547                                                      of 2018 Minor Hotels’
                   19,243
  Revenue                                                                                                                           ‒ Consolidation of NH Hotel Group
                                                                                            revenue

                                                                                            Management letting rights • Revenue in THB term was flat. Although RevPar was
                                                                         +60%                                           up by 2% in AUD term, revenue in THB term was
                                                                         12,290
                                                                                            12%
                                                                                            of 2018 Minor Hotels’       impacted by the weakening of the AUD.
                                               7,146        7,685
                   5,561         6,146                                                      revenue
   EBITDA
                                                                                            Management contracts                 • Revenue (excl NHH) increased by 19%, primarily
 EBITDA            28.9%        26.1%         25.7%        24.8%         24.3%                                                     attributable to higher income of managed hotels,
 Margin                                                                                     3%                                     especially in Thailand, together with contribution of
                                                                         +28%               of 2018 Minor Hotels’                  newly added hotels and additional technical service
                                                                         4,307              revenue                                and termination fees.
                                                            3,375
                                 3,009
                   2,600                      2,811
                                                                                            Mixed-use business                   • Revenue declined by 13%, from:
    NPAT                                                                                                                            ‒ Mismatch of sales of residential development in
                                                                                            10%                                       2018; and
 Net               13.5%        12.8%         10.1%        10.9%         8.5%               of 2018 Minor Hotels’                   ‒ Adverse impact on Anantara Vacation Club’s
 Margin                                                                                     revenue                                   revenue from the strengthening of the THB
                  2014          2015          2016          2017         2018                                                         against USD resulting in only 4% revenue growth.
* The financials above reflect performance from operation, and therefore exclude non-core items in 2014-2016 and 2018 as detailed on page 40.                                              10
Minor Hotels – International Presence
In recent years, MINT has implemented a solid diversification strategy. With the investment in NHH, MINT operates hotels and spas under a
combination of investment, joint-venture and management business models in 53 countries.
Investment
Management
Combination
New Destinations in Pipeline
Hubs
REVENUE CONTRIBUTION
100% 6%
75% International
63%
78% 89%
50% Thailand
94%
25%
37%
22% 11%
0%
2008 2017 2018* 2023F
* Excludes non-core items
11System-wide Hotel Portfolio
Excluding new hotels and FX impact, organic RevPar of the entire portfolio increased by 5% in 2018, driven primarily by owned and joint-venture
hotels portfolio. 2018 system-wide RevPar declined by 15%, primarily from the change in room type mix with the consolidation of the NHH
portfolio.
NUMBER OF HOTEL ROOMS ADR
No of +272%
Rooms Organic excl FX System-wide
THB
80,000 75,241 +2% -16%
6,110 5,830 5,744 5,816
60,000 6,000 5,705
MLR 4,765
40,000 Managed
4,000
17,714 19,797 20,209 Joint-venture
20,000 14,721
Owned & Leased
0 2,000
2014 2015 2016 2017 2018 2014
2014 2015
2015 2016
2016 2017
2017 2018
OCCUPANCY REVPAR
80% Organic excl FX System-wide
THB
+5% -15%
4,024 3,964 4,013
System-wide 4,000 3,821 3,837
+2%
70% 68% 69% 3,278
66% 67% 67% Organic
69% +2% 3,000
60% 2,000
2014 2015 2016 2017 2018 2014
2014 2015
2015 2016
2016 2017
2017 2018
12Owned & Leased Hotels
With the acquisition of NHH, owned & leased hotels contributed three-fourths of hotel & mixed-use revenue in
2018
MINOR HOTELS 2018. 2018 organic RevPar excluding FX impact of owned & leased hotels increased by 10%, from the strong
75%
REVENUE Owned & performance of organic overseas hotels. System-wide RevPar of owned & leased portfolio declined by 19%,
CONTRIBUTION Leased primarily from the dilution of ADR with the consolidation of different room type mix of NHH. Revenue of owned &
leased hotels more than doubled in 2018, both from organic operations and the consolidation of NHH.
NUMBER OF HOTEL ROOMS ADR
No of +653% THB Organic excl FX System-wide
Rooms +5% -27%
60,000
20,000 52,969 8,000 7,028 6,553 6,535
5,811 6,228
15,000 6,000
4,575
10,000 4,000
7,118 7,039
5,387
5,000 3,112 2,000
0 0
2014 2015 2016 2017 2018 2014
2014 2015
2015 2016
2016 2017
2017 2018
2018
OCCUPANCY REVPAR
80% System-wide THB Organic excl FX System-wide
+6% +10% -19%
5,000
70% 66% 68%
4,168 4,293 4,269
63% 62% 3,865
59% 4,000
60% 65% 3,653
Organic 3,117
50% +3% 3,000
40% 2,000
2014 2015 2016 2017 2018 2014
2014 2015
2015 2016
2016 2017
2017 2018
13Owned Hotels – Thailand
NHH, Thailand, While Thailand remained the largest single country contributor, its contribution is now smaller than all of
42% 24%
2018 OWNED NHH hotels combined. The momentum of RevPar growth of hotels in Thailand slowed in 2H18 primarily
HOTEL REVENUE
BY GEOGRAPHY MLR Overseas from the temporary slowdown of the Chinese tourists. Nevertheless, Thailand will remain an attractive
excl NHH, destination for tourism with its diverse attractions, well-developed infrastructure and strategic location.
34%
BANGKOK KEY HIGHLIGHTS
RevPar Growth Organic
(y-y) -25% +40% -4% +14% +8% • Despite the slowdown in Chinese tourists in 2H18, international
tourist arrivals into Thailand grew by 7.5% in 2018.
THB
4,830 4,874 4,964
5,000 4,943 4,722 • Number of room nights in Thailand sold by Minor Hotels grew by
83%
70% 71% 78% 4,105 Thailand 4% in 2018.
4,000 3,473 3,794
51% 3,337 • Organic RevPar of Minor Hotels’ owned Thailand portfolio grew
3,000 by 5% in 2018, driven by 1H18 performance, and primarily by
2,473
hotels in Bangkok.
2,000
2014 2015 2016 2017 2018
• The 8% RevPar growth of owned hotels in Bangkok in 2018 was
THAILAND PROVINCES primarily from higher occupancy and a slight increase in ADR.
RevPar Growth Organic Bangkok • The Riverside hotels, both Anantara Riverside Bangkok and AVANI
(y-y) -2% +10% +6% +6% +3%
Riverside Bangkok performed exceptionally well with double-digit
THB
7,581 7,815 RevPar growth throughout the year.
8,000 6,937 7,060 7,443 5,746
70% 71% 74% 74%
6,000 65% 5,600 • RevPar of hotels in the provinces increased by 3% in 2018, from
4,974 5,272
4,526
4,000 Thailand higher ADR.
Provinces • Both Anantara’s in Phuket and hotels in Chiang Mai and Hua Hin
2,000
2014 2015 2016 2017 2018
performed well.
% Occupancy ADR RevPar 14Owned Hotels – Overseas (Excl NHH)
NHH, Thailand, RevPar of owned overseas hotels (excl NHH) increased by 9% in 2018, driven by hotels in all key markets.
42% 24%
2018 OWNED Excluding FX impact, organic RevPar of owned overseas hotels increased by even higher rate of 16%.
HOTEL REVENUE
BY GEOGRAPHY MLR Overseas Favorable tourism environment in key markets, selective asset refreshments, together with Minor Hotels’
excl NHH, ongoing sales & marketing efforts, contributed to the strong performance.
34%
OVERSEAS EXCL NHH KEY HIGHLIGHTS
RevPar Growth Organic
(y-y) +8% -43% -24% +3% +9% • The Portugal portfolio’s RevPar increased by 10% in THB (11% in
EUR).
THB
12,177 • With the completion of the renovations in 2Q18, the RevPar
12,000 Portugal
increase, in particular in 2H18, was from both occupancy and rate
8,000 7,452 7,265 6,297 (vs previous RevPar increases mainly from rates), signifying the
4,236 5,5673,220 6,239 3,331 3,621
4,000 61% 58% 58% 53% 58% traction of the hotels’ operating performance.
0 • Brazil’s RevPar increased by 5% in THB (25% in BRL) with the
2014 2015 2016 2017 2018 Brazil weakening of the Brazilian real by 15%.
% Occupancy ADR RevPar • RevPar of both hotels grew by over 20% in BRL.
2018 ORGANIC REVPAR GROWTH (THB) • The Maldives portfolio performed well throughout the year, with
RevPar growth of 9% in THB (+16% in USD).
10% Maldives
Others, 31% Portugal, 33% 9% • The RevPar growth was driven by occupancy increase, from the
7% continued targeted marketing efforts.
5%
• RevPar of the African portfolio increased by 7% in THB (19% in
Africa, 13% Brazil, 13% local currencies).
Africa
Maldives, 10% • Hotels in Botswana and Zambia saw RevPar growth of over 20% in
Portugal Brazil Maldives Africa local currencies.
15Owned & Leased Hotels – NH Hotel Group
NHH, Thailand, NHH was the largest contributor to the owned & leased hotel portfolio in 2018. 4Q18 RevPar of NHH
42% 24%
2018 OWNED increased by 9%, driven by all key markets. The RevPar increase in 4Q18 was both from occupancy (across
HOTEL REVENUE
BY GEOGRAPHY MLR Overseas all regions, with Latin America and Spain as highlights) and ADR (primarily from Spain and Central Europe).
excl NHH,
34%
NH HOTEL GROUP KEY HIGHLIGHTS
RevPar
+9% Y-Y * Notes:
• Remarkable growth in Madrid from relevant congress in Oct 2018
EUR Spain
94 98
(1) ADR & RevPar in THB terms are THB 3,675 • Improving comps in Barcelona since 4Q18, recovering from slow
100 and THB 2,580 respectively
(2) For the time being, stats are given in EURs leisure domestic market in 2Q18-3Q18
80 63 69
for performance comparisons.
60 (3) The stats are different than NHH’s public • Good performance of Rome & secondary cities
40 67% 70%
disclosure as MINT’s version is organic
20 (one-year in operation) whereas NHH’s is Italy • However, Milan reported flat RevPar growth, as the city was
LFL (24 months full cycle of operations)
0 negatively affected by the trade fair calendar
4Q17 4Q18
% Occupancy ADR RevPar • Outstanding performance in Brussels due to continued recovery
Benelux since the terrorist attack in 4Q16
4Q18 ORGANIC REVPAR GROWTH (EUR)
• Dutch secondary cities also performed well
America, 10% Spain , 27% 12% 12%
Central
• Munich & Berlin up strongly due to favorable trade fair calendar
8% 7% Europe
Central Europe, 5%
24%
• RevPar up even higher (+18%) in local currencies
Latin
Benelux , 22% Italy, 17%
Spain Italy Benelux Central Latin America • Buenos Aires & Bogota saw double-digit RevPar growth even with
Europe America FX depreciation
* Note that only 4Q stats are shown as consolidation of NHH is only in 4Q18. 16NH Hotel Group – Financial Highlights
NH Hotel Group reported recurring EBITDA of EUR 263 million in 2018, above its announced target. EBITDA increase of 13% in 2018 was a result of
sound revenue growth and constant focus on efficiency. 4Q18 recurring performance showed a stronger momentum compared to the full year.
EUR million +8% y-y +4% y-y KEY HIGHLIGHTS
1,553 1,620 • 2018 revenue growth of 4%
397 430 ‒ RevPar up 3.8% (Occupancy +1.5% & ADR +2.3%)
Revenue
Revenues ‒ Strong performance of Benelux and Italy
+24% y-y +13% y-y ‒ Relative RevPar outperformed comp sets in top cities with focus on
263 quality (measured through STR / MKG Competitive Set average growth)
78 233
Recurring
EBITDA
63 • 2018 recurring EBITDA growth of 13%, with margin improvement of 1.3%
Recurring
‒ 45% EBITDA conversion rate
EBITDA 15.8% 18.1% 15.0% 16.3% EBITDA
Margin ‒ Effective cost control, both payroll and operating expenses
+250% y-y +146% y-y
86 • 2018 NPAT up significantly
Recurring
NPAT 28 35 ‒ Business improvement
8
NPAT ‒ Lower financial costs, from both refinancing and full redemption of
Recurring 1.9% 6.6% 2.2% 5.3%
NPAT Margin corporate bond and convertible bond
+1% y-y +228% y-y ‒ Higher contribution of net capital gains from asset rotation
118
Reported
NPAT 11 11 36 • Successful debt reduction
‒ Decline in net financial debt to EUR 171 million as of end of 2018 from
NPAT Margin 2.8% 2.6% 2.3% 7.3% Leverage
EUR 655 million as of end of 2017
4Q17 4Q18 2017 2018 ‒ Early redemption of convertible bond (EUR 250 million) in June 2018
Note: (1) As per NH Hotel Group’s report, the numbers include hyperinflation accounting effect (IAS 29) (implemented since 1 Jan 2018), and
(2) Recurring NPAT exclude capital gains and related taxes from asset rotation.
Source: NH Hotel Group’s 2018 Results Presentation & Sales and Results 17Management Letting Rights
Management letting rights (MLR) business which manages serviced-suites, mainly under the Oaks brand, is the
2018
MINOR HOTELS 12% second largest segment in the hotel and mixed-use business. MLR provides Minor Hotels with stable performance
REVENUE MLR throughout the year, compared to hotel operations which are more seasonal. While 2018 MLR’s revenue increased
CONTRIBUTION by 5% in AUD term, primarily from the increase in RevPar, revenue in THB term slightly declined by 1% because of
the weakening of the AUD.
NUMBER OF HOTEL ROOMS ADR
No of THB AUD
Rooms +8% THB -6%
6,000 200
7,000 6,935 4,795 4,557 4,588
6,339 6,418 4,271 4,297
6,223 6,232 190
6,000 4,000
180
5,000 177 179
174 170
2,000
4,000 AUD +1%
164 166 160
3,000 0 150
2014 2015 2016 2017 2018 2014 2015 2016 2017 2018
OCCUPANCY REVPAR
THB AUD
90%
+1% 5,000 THB -6% 160
79% 4,000 3,643 3,495 3,596 3,391 150
80% 77% 78% 3,258
76% 76%
3,000 140
141
2,000 138 130
70% 133 AUD +2%
1,000 124 127 120
60% 0 110
2014 2015 2016 2017 2018 2014 2015 2016 2017 2018
18Managed Hotels
In 2018, managed hotels contributed approximately 3% of hotel & mixed-use revenue. Organic RevPar excluding FX
2018
MINOR HOTELS 3% impact of managed hotels portfolio decreased by 1%. System-wide RevPar declined by 14%, with the addition of
Management NHH portfolio. Because of higher income of managed hotels, especially in Thailand, together with contribution of
REVENUE Contracts
CONTRIBUTION newly added hotels and additional technical service and termination fees, revenue from management service
(excluding NHH) increased by 19% in 2018.
NUMBER OF HOTEL ROOMS ADR
No of THB Organic excl FX System-wide
Rooms +184%
-1% -13%
8,000
15,000 13,311
7,038 6,724
12,000 6,748
9,000 6,108 6,048
6,000
6,000 4,533 4,692 5,309
3,453 3,910
3,000
0 4,000
2014 2015 2016 2017 2018 2014
2014 2015
2015 2016
2016 2017
2017 2018
2018
OCCUPANCY REVPAR
Organic excl FX System-wide
Organic THB -1% -14%
80%
Flat
5,000
70% 4,400 4,241
63% 63% 64% 64% 3,737 3,917 3,894
3,378
60% 55% 64%
3,000
System-wide
50% Flat
40% 1,000
2014 2015 2016 2017 2018 2014
2014 2015
2015 2016
2016 2017
2017 2018
19Hotel Expansion Pipeline
2019F 2020F 2021F 2022F
• Desaru, Malaysia 103 rms • Fares Island, Maldives* 200 rms • Khao Lak, Thailand 328 rms
• Ubud, Bali, Indonesia*
HOTEL INVESTMENT
71 rms • Milan, Italy 185 rms
• Antwerp, Belgium • Frankfurt, Germany 428 rms
180 rms • Santander, Spain 64 rms
• Paseo de Montejo, Mexico 120 rms • Monterey La Esfera, Mexico 120 rms • Hamburg, Germany 261 rms
• Mannheim, Germany 225 rms • Cancun, Mexico 140 rms • Frankfurt, Germany 375 rms
• Leipzig, Germany 197 rms • Milan, Italy 100 rms
• Warangi, Serengeti • Hannover, Germany 89 rms
National Park, Tanzania* 12 rms • Amsterdam, Netherlands 650 rms
7 Hotels / 908 Rooms 8 Hotels / 1,548 Rooms 4 Hotels / 1,392 Rooms
19 Hotels / 3,848 Rooms
* Note: Joint-ventured properties
• Bahia, Brazil 50 rms • Libo Country, China 173 rms • Chengdu, China 150 rms • Sifah, Oman 198 rms
• Le Chaland, Mauritius 164 rms • Phi Phi Island, Thailand 107 rms • Nanjing, China 120 rms
• Tozeur, Tunisia 93 rms
• Victoria, Australia 170 rms
• Ras Al Khaimah, UAE 140 rms • Zhuhai, China 160 rms • Kota Kinabalu, Malaysia 386 rms
• Angkor, Cambodia 80 rms • Accra, Ghana 155 rms • Ho Chi Minh City, Vietnam 217 rms
• Seminyak, Bali, Indonesia 37 rms • Dubai, UAE 528 rms • Sharjah, UAE 233 rms
• Busan, Korea 289 rms & 570 rms • Ras Al Khaimah, UAE 225 rms • Guadalajara, Mexico 120 rms
MANAGEMENT CONTRACTS / MLRS
• Bangkok, Thailand 382 rms • Zhuhai, China 300 rms • Panama 83 rms
• Tunis, Tunisia 41 rms
• Dubai, UAE 372 rms • Hangzhou, China 166 rms • Savanne, Mauritius 156 rms
• Vũng Tàu, Vietnam 149 rms • Muscat, Oman 150 rms
• Recife, Brazil 200 rms • Queensland, Australia 50 rms • Gammarth, Tunisia 232 rms
• Brasilia, Brazil 395 rms • Daegu, Korea 144 rms • Dubai, UAE 528 rms
• South Australia, Australia 278 rms • Cam Ranh, Vietnam 595 rms
• Hangzhou, China 132 rms • Venice, Italy 150 rms
• Busan, Korea 436 rms
• Beirut, Lebanon 110 rms • Fortaleza, Brazil 130 rms
• Wellington, New Zealand 226 rms • Iquique, Chile 135 rms
• Khon Kaen, Thailand 79 rms • Mexico City, Mexico 144 rms • Phuket, Thailand 500 rms
• Santiago, Chile 86 rms • Lima, Peru 164 rms
• Valencia, Spain 47 rms • Zhuhai, China 100 rms
• Bahia, Brazil 207 rms Others
• Porto, Portugal 79 rms
• Santiago, Chile 146 rms • Hangzhou, China 54 rms
• Lima, Peru 265 rms
• London, UK 190 rms
• Laikipia, Kenya 7 rms
27 Hotels / 5,134 Rooms 13 Hotels / 2,272 Rooms 15 Hotels / 3,563 Rooms 5 Hotels / 1,004 Rooms
60 Hotels / 11,973 Rooms
20Mixed-use Business – Residential
10% MINT’s residential projects are part of Minor Hotels’ mixed-use business. The developments are within or
2018 Mixed-use
MINOR HOTELS adjacent to MINT’s hotels and are usually branded MINT’s hotel brands. In addition to the current projects, MINT
REVENUE has prepared a pipeline in order to ensure the continuity of revenue stream from residential sales in the coming
CONTRIBUTION years. Other residential projects will be selectively considered in various hotel destinations in order to increase
returns of the overall project.
CURRENT PROJECTS PIPELINE PROJECTS
Layan Residences Avadina Hills Anantara Chiang Anantara Desaru Anantara Ubud
The Estates Torres Rani,
by Anantara, by Anantara, Mai Serviced Residences, Residences, Silom Office
Samui Maputo
Phuket Phuket Suites Malaysia Indonesia
15 luxury pool 16 luxury pool 14 luxury pool 44 units in 181 keys for rent 20 residential 15 residential NA
villas villas villas 7-storey & 6 penthouses villas villas
condominium for sale;
building 21-storey office
tower
Launched 2015 Launched 2018 Launched 2006 Launched 2016 Launched 2015 To launch 2019 To launch 2019 To launch 2023
100%-owned 50% JV 100%-owned 50% JV 49% JV 60% JV 50% JV 40% JV
21Mixed-Use Business – Anantara Vacation Club
10% Part of the mixed-use business, Anantara Vacation Club is another important contributor to Minor Hotels. Growth
2018 Mixed-use
MINOR HOTELS of members are driven by four main markets – China, Thailand, Hong Kong and Singapore. In 2018, while AVC
REVENUE revenue increased by 9% in USD term, because of the strengthening of the THB, AVC revenue in THB term
CONTRIBUTION increased by 4%.
TOTAL NUMBER OF MEMBERS MEMBERS PRIMARILY IN ASIA
Growth +41% +28% +15% +27% +21% UAE, 1% Others, 12%
No. of USA, 2%
Members Philippines, 2%
12,347 Australia, 2% China, 38%
12,000 10,193 Taiwan, 4%
9,000 8,000
6,928 Japan, 4%
6,000 5,431
Malaysia, 7%
3,000
0 Singapore, 8%
2014 2015 2016 2017 2018 Hong Kong, 8% Thailand, 12% As at Dec 2018
INVENTORY TO ACCOMMODATE GROWING MEMBERS GROWTH DRIVEN BY FOUR MARKETS
No. of Units 7 Destinations: >12 Destinations
Queenstown, > 500 CAGR 2013-2018 2018 Growth Y-Y
500 Bali, Sanya,
Samui, 41%
400 Phuket, Bangkok
Chiang Mai
300 29% 26%
229 21%
200 160 186 18%
119 137 13% 12% 11%
100
0
2014 2015 2016 2017 2018 2023F China Thailand Hong Kong Singapore
22MINOR FOOD
Minor Food – Financial Highlights
2018 revenue of Minor Food was flat, primarily because of the outlet expansion, which offset the slowdown of the same-store-sales from the weak
macro backdrop. With spending on the product and promotional campaigns to drive traffic, the ramping up of the newly opened stores, and the
contraction of same-store-sales, EBITDA and net profit declined by 15% and 21% respectively.

                                                                                                                                       KEY HIGHLIGHTS
 THB million                                                              Flat
                                                           23,582        23,484                                            • The Pizza Company, Burger King, Dairy Queen and
                                             23,022
                                18,626                                                                                       Riverside reported positive total-system-sales growth as
                  16,754
                                                                                                                             the brands continued to open new outlets.
                                                                                             Total-system-sales
  Revenue                                                                                    growth of                     • Total-system-sales growth turned positive since Aug with
                                                                                                                             the accelerated expansion in China and Thailand.
                                                                                             0.2%                            However, full year 2018 growth was pulled down in 1H18
                                                                         -15%                in 2018                         because of the outlet rationalization in Singapore and
                                              3,843        4,285                                                             Australia and divestment of The Groove Train portfolio in
                                                                         3,647
                                 3,127
                   2,817                                                                                                     late 2017.
   EBITDA
                                                                                             Outlet expansion              • The drivers of outlet expansion during the year were The
 EBITDA           16.8%         16.8%        16.7%         18.2%         15.5%               10%                             Pizza Company, Dairy Queen, The Coffee Club and
 Margin                                                                                      in 2018                         Benihana through the acquisition in April 2018.
                                                                         -21%
                   1,550                      1,684
                                                            1,913                                                          • Soft macro conditions in countries that the three hubs
                                 1,572                                   1,521
                                                                                                                             operate continued to put pressure on the group’s same-
                                                                                             Same-store-sales
                                                                                                                             store-sales growth.
    NPAT                                                                                     growth of
                                                                                                                           • Minor Food will continue to strengthen its multi-brand
 Net                9.3%         8.4%          7.3%         8.1%          6.5%               -3.3%                           portfolio through product innovations and operational
 Margin                                                                                      in 2018                         excellence, together with focus on technology in order to
                   2014          2015         2016          2017         2018                                                maintain its competitiveness.
* The financials above reflect performance from operation, and therefore exclude non-core items in 2014-2016 and 2018 as detailed on page 40.                                            24
Minor Food – International Presence
MINT operates three restaurant hubs: Thailand, China and Australia. MINT’s restaurant presence is now in 27 countries across the region, operating
owned, franchised and a combination of both business models. MINT continues to look for opportunities to expand, especially in these existing
markets.
Owned
Franchised
Combination
Hubs
REVENUE CONTRIBUTION
100%
19%
75% 40% 35% 40%
International
50%
81% Thailand
60% 65% 60%
25%
0%
2008 2017 2018* 2023F
* Excludes non-core items
25Minor Food – Operational Performance
2018 total-system-sales of the restaurant business grew by 0.2%, driven mainly by outlet increase of 10%, primarily from Thailand and China hubs.
As all three hubs faced challenges of the economic slowdown and increased competition, same-store-sales declined by 3.3% in 2018.
SSS & TSS GROWTH RESTAURANT OUTLETS BY GEOGRAPHY
International 4,462
Same-Store-Sales Growth Total-System-Sales Growth Thailand
+10% 37%
20%
2,064 2,270
35% 34%
15% 1,043 63%
13.1% 33% 65% 66%
11.2% 67%
10% 9.1% 2008 2017 2018 2023F
5.1% RESTAURANT OUTLETS BY OWNERSHIP
5%
Franchised 4,462
1.3% 0.2%
0.4% -0.2% Owned
0% -0.8%
+10% 51%
-3.3%
2,270
2,064
-5% 49%
1,043 48%
2014 2015 2016 2017 2018 59%49%
38%
53%
52% 50%
51%
62% 82%
No. of
1,708 1,851 1,996 2,064 2,270 2008 2017 2018 2023F
Outlets
26Minor Food – Thailand Hub
Revenue from domestic operations accounted for over 60% of total restaurant revenue in 2018. The Pizza
2018
MINOR FOOD Company, Dairy Queen, Burger King and The Coffee Club expanded the number of outlets, which resulted in
65%
REVENUE Thailand
Thailand positive total-system-sales growth in 2018.
CONTRIBUTION
THAILAND’S SSS & TSS GROWTH KEY HIGHLIGHTS
Same-Store-Sales Growth Total-System-Sales Growth • Same-store-sales: Thailand’s SSS declined by 3.1% in 2018:
‒ Consumer confidence remained challenging throughout the year,
20%
especially in the rural areas, with weak commodity prices;
‒ Bangkok has been impacted by high competition and delivery service
15% disruption; and
‒ The brands that have high exposure to tourists; i.e. Burger King and The
10% Coffee Club, were impacted by the tourist slowdown in 2H18.
• Total-system-sales: With outlet expansion of 12% during 2018, Thailand’s
5% TSSG was 5.4%.
• 2019 Strategies:
0%
‒ Focus on customer accessibility, both through physical and digital
channels;
-5% ‒ Continue with product innovations, ensuring that the brands remain
2014 2015 2016 2017 2018 relevant for customers; and
‒ Leverage on digital technology, including areas of operations, customer
service and ordering, loyalty and e-payment and big data analytics.
27Minor Food – 1112Delivery
Anticipating the emerging dine-at-home trend and leveraging on one of the country’s best delivery platform and driver fleet, Minor Food launched
1112Delivery Project to capture such growing trend in February 2019.
Thailand
1112DELIVERY
Thailand Food Delivery Market
• Food delivery market is expected to represent 20% of total food service market in Thailand by 2023.
• Customers are switching to online from offline ordering.
• By 2023, the delivery market size is expected to grow by over 6 times, with almost 60% of online food delivery
continuing to be concentrated in Bangkok and metropolitan area, and another 20% in tier 2 cities.
Repeat Accessibility
• Customer feedback collected • Multiple channels, including:
through all channels ‒ Website
‒ Mobile application
‒ 1112 call center
Delivery Selection
• Single delivery through • All Minor Food brands available
professional 1112 delivery team for delivery
• All products delivered timely • Multiple brands, single payment
28Minor Food – China Hub
China hub is expected to remain one of MINT’s growth drivers as MINT is confident in the strong growth
2018
MINOR FOOD prospect of the country, supported by growing middle class and increased urbanization trend. Riverside
REVENUE 13% continues to be the main driver of China hub.
CONTRIBUTION China
CHINA’S SSS & TSS GROWTH KEY HIGHLIGHTS
• Same-store-sales: China’s SSS declined by 5.9% in 2018, primarily from soft
Same-Store-Sales Growth Total-System-Sales Growth performance of outlets in Tier 3 cities and natural cannibalization from rapid
expansion of outlets in Beijing and Shanghai.
30% • Total-system-sales: With rapid outlet expansion of 18%, the TSSG was 4.4% for
the year 2018, with a monthly improving trend.
20% 15% TSSG
10%
5%
10% 0%
-5% SSSG
-10%
0% -15%
Jan-18 Apr-18 Jul-18 Oct-18
-10% • 2019 Strategies:
‒ Continue to expand Riverside outlets, with the aim to dominate the grilled
-20% fish segment in Beijing and Shanghai and surrounding areas (Tier 2);
2014 2015 2016 2017 2018
‒ Improve customer experience for Riverside brand, both through store
uplift and food traceability programs; and
‒ Grow the delivery business.
29Minor Food – Australia Hub
In 2018, Australia hub’s revenue contributed 10% of total restaurant business. Revenue in AUD declined by 11%
2018
MINOR FOOD 10% as a result of negative same-store-sales growth, but declined at a higher rate in THB term because of the
REVENUE Australia weakening of the AUD.
CONTRIBUTION
AUSTRALIA’S SSS & TSS GROWTH KEY HIGHLIGHTS
• Same-store-sales: Australia’s SSS declined by 2.6% in 2018, as the country’s
Same-Store-Sales Growth Total-System-Sales Growth economy continued to be challenging.
20% • Total-system-sales: As part of its rationalization program, the hub divested
The Groove Train portfolio at the end of 2017, resulting in Australia’s TSSG
15% to remain negative throughout 2018, and ending the year with TSS decline
of 13.3%.
10%
• 4Q18 New Market Expansion: The Coffee Club entered three new markets
5%
in late 2018: China, Qatar and Cambodia. JV has also been signed in
0% Vietnam to operate The Coffee Club franchise.
-5% • 2019 Strategies:
‒ Grow The Coffee Club business in Australia through brand relevance,
-10% such as convenience through delivery channel and differentiation
through hero products and loyalty program;
-15%
‒ Drive international expansion of The Coffee Club brand in both existing
2014 2015 2016 2017 2018
and new markets; and
‒ Expand coffee roasting business through all channels: retail channel
through The Coffee Club and white label business, and wholesale
channel through supermarkets.
30MINOR LIFESTYLE
Minor Lifestyle – Financial Highlights
2018 revenue of Minor Lifestyle was up 9%, driven by the retail trading business. EBITDA and net profit increased at a much slower rate as discount
campaigns were implemented to drive sales during the weak domestic consumption sentiment and intensified competition, which put pressure on
margins. In 4Q18, Minor Lifestyle launched a new brand, Save My Bag, a handbag and accessories brand from Italy.
                                                                                                      KEY HIGHLIGHTS
 THB million                                          +9%
                                                                    Retail trading               • 2018 revenue from retail trading increased by 9%,
                                                     4,439
                                            4,091                                                  mainly from Charles & Keith, Anello, Etam, Radley,
                3,703   3,505     3,505                             78%                            Henckels and Joseph Joseph, together with sales from
                                                                    of 2018 Minor Lifestyle        recently-added brands, OVS, Bodum and Save My
  Revenue                                                           revenue                        Bag.
                                                                    Contract manufacturing
                                                      +1%           22%                          • 2018 revenue from contract manufacturing increased
                384                                                 of 2018 Minor Lifestyle        by 1% as a result of weak consumption environment.
                         300       267       304      307
                                                                    revenue
  EBITDA
                                                                                                      SSS & TSS GROWTH
 EBITDA        10.4%    8.6%      7.6%      7.4%      6.9%                                                                19.3%
 Margin
                                                      +2%                                                   8.4%                        9.0%
                                                                                                                                                TSSG
                183                                                                 3.8%
                         124                 127      130
   NPAT                            81                                                         -3.3%
                                                                                                                          2.3%
                                                                                   -8.1%                    -0.1%                               SSSG
 Net           4.9%     3.5%      2.3%      3.1%      2.9%                                    -6.3%                                     -3.9%
 Margin
                                                                                   2014        2015          2016         2017          2018
               2014     2015     2016      2017      2018           No. of Shops    297        307           327           398          490

                                                                                                                                                          32
Minor Lifestyle – Scomadi
With the growing premium motorcycle and scooter segment, Minor Lifestyle is taking the opportunity to enter the market to operate the
manufacturing and distribution of Scomadi.
Thailand
WHO IS SCOMADI? WHY SCOMADI?
• Scomadi is a British brand established in 2005 • Opportunity to grow a potential global lifestyle
• The founders are two partners with over 60 years brand
of experience combined in the scooter industry • Diversification into another segment of Thai
‒ Frank Sanderson of Scooter Innovation Ltd. lifestyle market
‒ Pal Melici of PM Tuning Ltd. • High growth of the modern classic scooters
segment
• Scomadi is a modern classic scooter brand
• Brand with strong fan base and following with
proven concept
SCOMADI ROADMAP
ORGANIZATION PRODUCTION MARKET EXPANSION BRAND AWARENESS NEW PRODUCT
• Placement of key positions • Ensuring production • Expansion of the brand, both • Target world-wide recognition • New model development, such
capabilities to meet current domestically and through: as electric models
• Planning of business strategy,
market demand internationally. ‒ motor sport events
operations, systems and
financials • Key international markets ‒ community-related events,
identified are UK, Europe, such as road trips, digital
Australia, Malaysia and India spaces, scooter fashion
shows
• Engagement activities with
distributors in all key markets ‒ celebrity endorsement
33Corporate Information & Five-Year Plan
CAPEX & Balance Sheet Strength
CAPEX plans include committed CAPEX of projects in the pipeline. Following the acquisition of NHH, 2018 interest bearing debt to equity ratio rose
to 1.53x, which is within its debt covenant of 1.75x. MINT and its senior unsecured debentures have “A” rating by TRIS. MINT plans to bring the debt
to equity ratio down to its internal policy of 1.3x by the end of 2019. Going forward, source of fund for the committed CAPEX requirement will
primarily be internal cash flow and debt financing.
                                      CAPEX PLANS                                                                             LEVERAGE RATIOS
                                                                                               X
  THB million                                                                         X       1.6                                                        1.53x
   100,000
    30,000                                                                           6.0      1.4                                                        1.37x
                                                                                                                                                                                Internal
                                                                                              1.2                                                                       1.30x    Policy
    25,000                                                                           5.0
                                                                                              1.0
    20,000                                                                           4.0      0.8
                                                                                                        2014         2015         2016        2017       2018         2019
    15,000                                                                           3.0                                                                             Target
                                                                                                      Interest Bearing Debt to Equity            Net Interest Bearing Debt to Equity
    10,000                                                                           2.0
                                                                                                                             BACK-UP FINANCING
     5,000                                                                           1.0      THB million                                Note: Cash on hand as at end of
                                                                                                200,000                                        2018 is THB 12,760 million
                                                                                                                     Shareholders’
          0                                                                          0.0                                Equity
                                                                                                150,000                 83,074
                 2018      2019F       2020F       2021F      2022F       2023F
                                                                                                100,000
                  Minor Food             Minor Hotels            Minor Lifestyle                                         Debt
                                                                                                    50,000              126,894                         Debt
                            EBITDA coverage on committed CAPEX                                                                                         42,367
                                                                                                        0
   * 2018 CAPEX includes investments in Benihana, Riverside, Food Theory and NH Hotel Group                  Outstanding Borrowing & Equity      Un-Utilized Facility
                                                                                                                                                                                           35
Refinance & Balance Sheet Management Plans
MINT has a plan in place to refinance the current bridge loans to long-term bonds and/or loans within 2019. In addition, MINT targets to bring its
debt-to-equity ratio back down to the internal policy of 1.3x by the end of 2019. Some of the initiatives, including asset rotation, is already being
pursued.
REFINANCING PLANS BALANCE SHEET MANAGEMENT
THB 88 bn THB 88 bn
2018 Performance
94.1% stake All funding swapped to EUR • 2018 net profit has been added to the equity base.
Target blended financing cost < 3%
Issuance of Perpetual Bonds
Completed • Two tranches of perpetual bonds have been
18-mths bridge loans: in 2018 successfully issued, to help strengthen the equity base:
• To be refinanced to a
combination of bonds
‒ THB 15 billion perpetual bonds;
47.7% stake
THB 45 bn THB 55 bn and loans, or DE = 1.53x ‒ USD 300 million perpetual bonds.
Oct 2018
• To be partially repaid
Revaluation of NHH Assets
with proceeds from asset
rotation • The revaluation exercise has been completed, which
helped uplift the equity base by THB 708 million.
EUR 139 mn
16.6% stake 5-yr loans 2019 Performance
THB 15 bn
Aug 2018 EUR 80 mn
THB 5 bn • 2019 net profit will further add to the equity base.
THB 3 bn 15-yr corporate bonds 2019
USD 300 mn Asset Rotation Strategy
THB 10 bn Plan
THB 28 bn 29.8% stake 3-yr callable perpetual bonds • Cash received can be used to repay debt, while asset
Jun 2018 sale may result in gain from sale of assets, which will
THB 15 bn THB 15 bn
5-yr callable perpetual bonds DE >= 1.3x improve the equity base.
• MINT is already exploring the sales-and-lease-back
Acquisition Funding option for selected Tivoli assets.
36MINT’s Five-Year Strategy
Revenue Growth NPAT Growth
ROIC = 12%
2023 > 10% CAGR 15-20%
Goals
Employer of Choice Sustainable Business
Investments,
Winning Brand Value Capture & Innovation & Empowered Sustainable
Partnerships &
Portfolio Productivity Digital People & Team Framework
Acquisitions
Brands & value chains Ensure Good Corporate
monetization 1 commitment Superior Sustainable Governance
workforce leadership
Growth Margin enhancement 2 Set clear targets People Customers
Pillars through integration
& shared operations Leverage
3 ecosystem
Capital optimization partners Partners Environment
with asset right
Engaging work
strategy & mixed-use Promote digital Social Responsibility
business 4 environment
culture Mindset
37Five-Year Aspiration
2023F
2023
• > 630 hotels
2018 • > 250 residences built
• 513 hotels • > 500 vacation club units
• 132 residences built to date 2018 • > 4,400 restaurants
• 229 vacation club units REVENUE THB 78.5 bn
• > 600 retail shops & POS
• 2,270 restaurants
• 490 retail shops & POS (>46,000 sq.m.)
(31,776 sq.m.)
2013
REVENUE THB 36.9 bn 2009
• 30 hotels
• 1,112 restaurants
• 292 retail shops & POS
(14,275 sq.m.)
38APPENDIX
Non-Core Items
             AMOUNT
  PERIOD   (THB million)   BUSINESS UNIT                                         NON-CORE ITEMS
                 708        Minor Hotels   • Gain on fair value adjustment of investment in NH Hotel Group
                -800        Minor Hotels   • Loss from changing status of investment in NH Hotel Group
                 -96        Minor Hotels   • Impairment charge of investment in Oaks Gladstone
  4Q18      -280 pre-tax
           -232 post-tax    Minor Hotels   • Impairment of investment in Rani (Mozambique)
                -125        Minor Food     • Impairment of investment in GrabThai in UK
                 -87        Minor Hotels   • FX loss on unmatched USD cross-currency swap
  2Q18          -121         Minor Food    • Gain on fair value adjustment of investment in Benihana
                490         Minor Hotels   • Gain from bargain purchase of hotels in Zambia
                 38         Minor Hotels   • Gain from bargain purchase of Tivoli hotels in Portugal
  4Q16          -359        Minor Hotels   • Anantara Vacation Club’s (AVC) provision of doubtful account (recorded in SG&A), MINT’s
                                             prudent measures to conservatively provide for potential bad debts of Phase I
                -223        Minor Hotels   • Oaks’ general administrative expenses and provision (recorded in SG&A)
                  92        Minor Hotels   • Gain from changing status of investment in some of the Oaks properties
  3Q16
                -136        Minor Hotels   • Impairment charges of certain Oaks properties (recorded in SG&A, pre-tax)
  2Q16          136          Minor Food    • Gain from changing status of investment in BreadTalk Group in Singapore
  1Q16        1,932         Minor Hotels   • Gain from bargain purchase of the Tivoli Hotels & Resorts
              1,665          Minor Food    • Gain on fair value adjustment of change in status of investments in Minor DKL
  4Q15
                 -49        Minor Hotels   • Reduction of gain from bargain purchase of Oaks Elan Darwin recorded in 3Q15
  3Q15            70        Minor Hotels   • Gain from bargain purchase of Oaks Elan Darwin
  1Q15          650         Minor Hotels   • Gain from bargain purchase of Sun International hotels in Africa
            87 pre-tax      Minor Hotels   • Gain from changing status of investments in Seredib Hotels PLC
  2Q14     69 post-tax                                                                                                                 40
You can also read