Investor Presentation - September Conferences September 2018 CEVA Logistics AG
←
→
Page content transcription
If your browser does not render page correctly, please read the page content below
CEVA Logistics AG

Investor Presentation
September Conferences
September 2018

  1   CEVA Logistics AG – Q2 2018
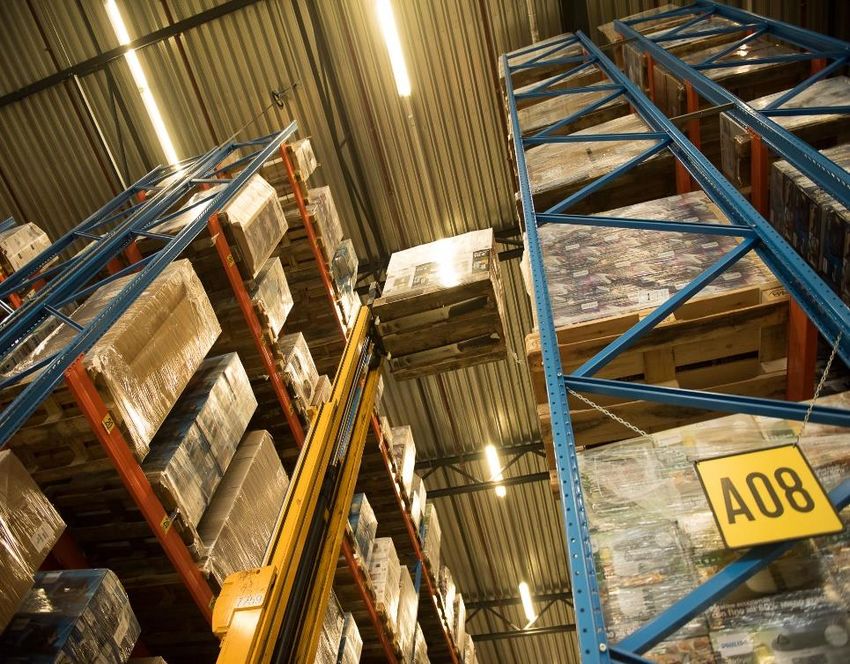
CEVA Logistics – A Leading Global Logistics Company

                                       Global Player                                                         Blue-Chip Customer Base     Broad Service Range

                                                                                                                                             Manages c. 9 MM sqm
                                                                                                                                                warehouse space

                      $                                                                                                  57%
                                                                                                                                             across c. 750 locations

                                                                                                         of Gross Revenue with top 100
                                                                Present in over                                    customers
              c.7.0   Bn
                 Revenue                                              160                                                                        480,000 Tons
                                                                                                                                                   Air Freight
                                                                    countries1

                                                                                                                                                729,000 TEUs
                                                                                                                                                  Ocean Freight
                                                                                                              Average relationship of

                   More than
                                                                                                                   15 years
              56,000                                       #5                    #10                        with the top 30 customers
                                                                                                                                                 1.9 MM Tons
     employees and temporary                           in Contract           in Freight                                                              Ground
            workers2                                    Logistics3          Management4

1 Direct presence in more than 60 countries and exclusive agents in more than 100
2 As of 31 December 2017
3 Transport Intelligence report, Global Contract Logistics 2017
4 Transport Intelligence report, Global Freight Forwarding 2017, #7 in Air ranked by Revenue, #12 in Ocean ranked by Volume

    2       CEVA Logistics AG – Q2 2018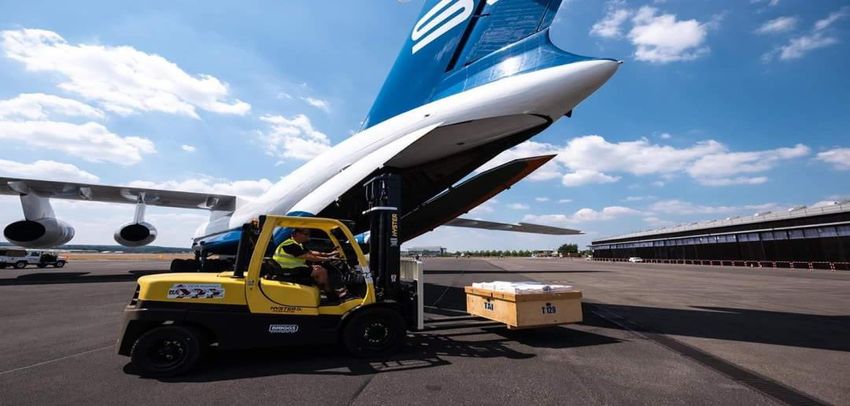
Agenda

                                   1   Business Update Q2 / H1 Results

                                   2   Strategic Progress / Margin Improvement

                                   3   Refinancing

                                   4   Targets

 3   CEVA Logistics AG – Q2 2018
Highlights Q2

     ▪ Revenue up 5.1% year on year in constant currency
          − Good Ocean volumes, Air picking up after softer Q1
          − CL growth accelerated to 4.7%
          − Limited (if any) impact from tariffs so far
     ▪ Excellence program continues to deliver margin improvement
     ▪ Adjusted EBITDA up $8* million year on year, EBITDA margin up 30 bps*
          − FM with improved margins despite driver shortages in US
          − CL progress offset by issues at limited number of contracts in Italy and
            US, largely addressed, less impact expected in coming quarters
     ▪ Good new business pipeline, early signs of IPO benefits
     ▪ Progress in partnership with CMA CGM, regulatory approvals obtained
     ▪ Refinancing completed early August ($ 1.4bn in total)

 ▪    * In constant currency

 4     CEVA Logistics AG – Q2 2018
Key figures

              Quarter Ending 30 June 2018               Q2 2018           Delta
                                                                     at constant FX
                                                       ($ million)   (%/$ million)
              Revenue                                    1,848           +5.1%
              Adjusted EBITDA1                             77             +8
              EBITDA Margin                              3.6%          +30 bps

              Half Year Ending 30 June 2018             H1 2018           Delta
                                                                     at constant FX
                                                       ($ million)   (%/$ million)
              Revenue                                    3,638           +5.2%
              Adjusted EBITDA1                            143             +19
              EBITDA Margin                              3.3%          +30 bps

1 Before specific items and SBC; including Anji-CEVA

   5      CEVA Logistics AG – Q2 2018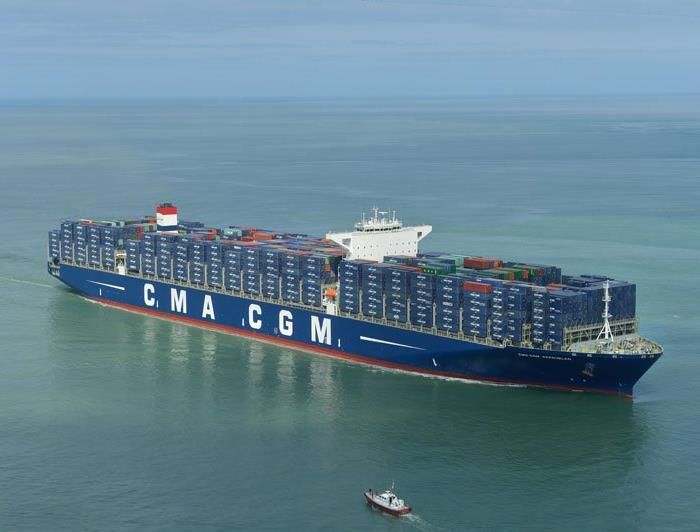
Business Development Momentum

     ▪ Continued positive momentum
     ▪ New business wins up approx. 10% yoy in H1, growth across all products
     ▪ Significant new contracts/extensions won in Q2, e.g.,
         − >$60m ocean supply-chain management contract in automotive
         − Large e-Commerce contracts both in North and South America
         − >$30m auto CL contract at Anji-CEVA
         − Several >$20m new Air freight contracts in industrials, technology, consumer
     ▪ New Business Development organisation in place with dedicated teams
         − “Farming”: key accounts
         − “Hunting”: multinational corporations
     ▪ Early signs, that IPO is showing positive impact
         − Client conversations have shifted markedly, many promising discussions
         − First wins and contract renewals secured with existing clients due to IPO
         − Invited into a number of RFQs at potentially new clients

 6     CEVA Logistics AG – Q2 2018
Business line overview: Freight Management

                                                           Q2 Highlights
                                                           ▪ Good volumes in Ocean, Air volumes picking up
                                                             after slower H1
                                                             ‒ Air with time lag between loss of customers
                                                               and onboarding new wins, as in Q1
                                                             ‒ Limited impact from tariffs so far
                                                           ▪ Strong yields in Air, broadly flat yields in Ocean
Key Figures                                                ▪ Further productivity improvements in Air and
                                       Q2 2018    YoY %
(in $m unless otherwise stated)                              Ocean supporting margin increase, conversion
Air tons (‘000)                         120.2     -1.3%      up in both products
Air NR/t ($)                            711      +10.9%    ▪ Ground in US significantly affected by driver
Ocean TEUs (‘000)                       194.9     +8.3%      shortages – mitigation underway: recruiting,
Ocean NR/TEU ($)                        274       -5.2%      price increases, network redesign
Revenue                                 853      +5.4%*    ▪ Much improved performance in Other FM,
EBITDA                                   27      +35%*       notably US VAS
EBITDA Margin                           3.2%     +70bp*
Conversion Rate                        11.7%     +270bp*
* At constant FX

   7     CEVA Logistics AG – Q2 2018                                                                      Source: CEVA
Business line overview: Contract Logistics

                                                             Q2 Highlights
                                                             ▪ Good volumes in existing contracts and
                                                               implementation of new businesses, e.g.,
                                                                ‒ Spare parts operation for Auto Alliance in ANZ
                                                                ‒ e-commerce for leading customer in Turkey
                                                                ‒ Important contracts in consumer, retail,
                                                                  technology
                                                             ▪ Productivity and margin at focus contracts
                                                               improved, double-digit productivity gains at some
                                                               contracts
                                                             ▪ Low margin contract initiative gaining traction
                                                             ▪ Margin improvements offset by issues in limited
Key Figures                                                    number of operations
                                         Q2 2018     YoY %
(in $ m)                                                        ‒ Certain US transport contracts
Revenue                                 995        +4.7%*       ‒ Large Italian contracts
EBITDA                                  39         +2.6%*    ▪ Shed a number of low-margin / high revenue
EBITDA Margin                           3.9%       -10bp*      contracts

* At constant FX

  8       CEVA Logistics AG – Q2 2018                                                                     Source: CEVA
Group P&L
All figures above EBITDA are before specific items and SBC1

 Half Year Ending 30 June 2018                H1 2018            H1 2017             Delta       Delta at               Comments
                                                                                               constant FX
                                             ($ million)       ($ million)      (%/$ million) (%/$ million)           ▪ Good revenue growth in both
                                                                                                                        FM and CL
Revenue                                         3,638             3,317             +9.7%             +5.2%
                                                                                                                      ▪ Further margin Improvement,
Net Revenue                                     1,840             1,690             +8.9%             +4.0%             up 30bps in quarter and half
Operating Expenses                             (1,721)           (1,586)            +8.5%             +3.4%             year
EBITDA before specific items & SBC               119               104             +14.4%             +15.5%          ▪ Specific Items: higher due to
                                                3.3%               3.1%            +20bps             +30bps            IPO / SBC whilst restructuring
EBITDA Margin
                                                                                                                        cost much reduced
   Specific items and SBC                        (37)              (14)              (23)
                                                                                                                      ▪ D&A : accelerated amortization
   Depreciation & Amortization                   (67)              (53)              (14)
                                                                                                                        of acquisition intangibles,
   Net Finance Expense                          (122)             (133)               11                                higher capex in ‘17
   Net Result from joint venture                   9                 9                 -                              ▪ Finance expense still reflects
   Tax                                           (14)              (15)                1                                pre IPO capital structure –
                                                                                                                        higher debt and interest rates
Net Income                                      (112)             (102)              (10)               (6)
                                                                                                                        yoy; debt breakage cost but
   Share in Anji-CEVA EBITDA                      24                20                 4                                benefit from FX
Adjusted EBITDA2                                 143               124             +15.3%             +15.3%

1 SBC: Share-based compensation cost
2 Adjusted EBITDA includes the Group’s share of EBITDA from the Anji-CEVA joint venture, and excludes specific items and SBC

   9     CEVA Logistics AG – Q2 2018
Cash Flow

                                        H1 2018       H1 2017         Delta
                                       ($ million)   ($ million)   ($ million)   Comments
EBITDA before specific items and SBC      119           104            15
                                                                                 ▪ Specific items mainly timing
Specific Items                            (10)           2            (12)
                                                                                   effect, more outflows though
Retirement Benefit Obligations             (2)           (1)           (1)         in coming quarter
Provisions                                 7             (4)           11        ▪ Working Capital due to
Change in Working Capital                (135)          (81)          (54)         comparative, growth, lower
                                                                                   factoring and earlier payment
Other                                     (10)           (8)           (2)
                                                                                   terms, e.g., US payroll
Operating cash flow                       (31)           12           (43)       ▪ Finance expense increased due
Net finance expenses                     (117)          (81)          (36)         to higher debt and rates as
Tax                                       (13)          (17)           4           well as charges in context of
                                                                                   debt repayment (accelerated
Net Capital expenditure                   (47)          (48)           1
                                                                                   interest, breakage fees)
Finance Leases                             (6)           (3)           (3)
Free cash flow                           (214)         (137)          (77)
Share issuance                           1,183            -          1,183
Change in borrowings                     (939)           33          (972)
Other                                      1             3             (2)
Change in Cash                             31          (101)

 10     CEVA Logistics AG – Q2 2018
Results Anji-CEVA – not consolidated
Quarter ending 30 June 2018 Comments
Delta
Q2 2018 Q2 2017 at constant FX
($ million) ($ million) ( %/$ million) ▪ Strong revenue growth from
existing contracts, new
Revenue 387 293 +22.9%
implementations and transfer
EBITDA 22 21 - of CEVA CL business (July 2017)
EBITDA Margin 5.7% 7.2% -130bps ▪ Fee agreement entered into
Net Income 10 8 2 with Anji Logistics in June to
reflect adjusted distribution of
CEVA’s share of EBITDA 11 11 -
economics as per renewed JV
contract of 2017 – effect c.$4m
for CEVA in dividends
Half year Ending 30 June 2018 Delta
H1 2018 H1 2017 at constant FX ▪ $4m accrual booked in Q2 to
($ million) ($ million) ( %/$ million) reflect fee for first half,
Revenue 733 538 +26.4%
impacting EBITDA margin
▪ Expect stronger margins in
EBITDA 47 40 5
second half and continued
EBITDA Margin 6.4% 7.4% -100bps strong growth
Net Income 24 22 -1 ▪ >$10m gain from property sale
CEVA’s share of EBITDA 24 20 +11.1% additional in H2 anticipated
11 CEVA Logistics AG – Q2 2018IPO Benefits Starting To Materialise
▪ Very positive reactions from clients, engaged in promising
discussions
Customers ▪ First wins and renewals due to IPO
▪ Invited to tenders for new names and where previously blocked
▪ Expect stronger impact in H2 and in next tender season
▪ Renegotiating payment terms where limited or no credit, first
successes
Suppliers ▪ Selectively also seeking to negotiate lower cost where rates
impacted by credit quality
▪ Expect >$20m NWC opportunity medium term
▪ Have already lowered guarantees by c.$65m
Guarantees ,
▪ Also seeking to renegotiate certain operating and finance leases
leases etc.
▪ Targeting another $50m reduction in guarantees and deposits
12 CEVA Logistics AG – Q2 2018CMA CGM Partnership update
▪ Regulatory approvals obtained, securities
converted into registered shares
▪ Good dialogue over past weeks, key areas of
co-operation defined
▪ Working on providing end-to-end solutions
− First contracts for CEVA concluded at CMA
CGM clients, expected >$5m annual
revenue
− Jointly bidding on several important
tenders for CMA CGM clients
▪ Discussing further opportunities – joint geographic expansion, sharing of resources/services
▪ Expect higher benefits from co-operation than originally anticipated, impact over time
▪ Co-operation is structured at arm’s length
▪ CEVA will continue to work closely with all its ocean carriers
13 CEVA Logistics AG – Q2 2018Agenda
1 Business Update Q2 / H1 Results
2 Strategic Progress / Margin Improvement
3 Refinancing
4 Targets
14 CEVA Logistics AG – Q2 2018Recap: Strategic Targets
EBITDA
Margin1 3.3% > 4.0%
Margin Improvement Initiatives
Freight Management
1 Narrow Air & Ocean productivity gap with
peers ( process improvement and technology)
2 Improve Net revenue : procurement, pricing
$280 MM 3 Strengthen Ocean and grow through solutions
4 Address low margin/loss-making operations
▪ FM Margin: 2.3% to c.3.5% Contract Logistics
▪ CL Margin: 4.1% to 4.5% – 5.0% 1 Improve performance focus
2 Address low margin contracts and sites
3 Win new business more effectively/
standardized solutions
Adj. EBITDA Growth FM Margin2 CL Margin2 Anji JV Adj. EBITDA 4 Commercial acumen (discipline in pricing,
FY 17A Target capital employed)
Medium
Contribution to EBITDA improvement – illustrative Term
1 EBITDA margin excludes share of Anji-Ceva JV EBITDA and is before specific items and share-based compensation
2 Including SG&A
15 CEVA Logistics AG – Q2 2018Freight Management Margin Improvement
FM EBITDA Margin Progression, %
A
Narrow Air & Ocean Productivity Gap
Example: Ocean Freight Actions
c.3.5% Files / Operator
75
▪ Standardise processes
▪ Bolt-on technology
56 enhancements /
42 automation (CSP / RMS)
2.3%
▪ Station improvement
program (LEAP)
▪ Training
FY15A FY17A Benchmark1
Medium- Targeting > 20%
FY17A A B C D Term productivity increase
Aspiration
D
Address Low-margin / Loss-making Activities
Narrow Air and Ocean productivity gap through process
A improvements and technology Example: Other FM –VAS Actions
EBITDA, $MM
▪ Downsize real estate /
B Improve net revenue: procurement and pricing relocate
>0
▪ Re-pricing, portfolio
C Strengthen Ocean and grow through solutions review
Address our low margin / loss-making activities in ▪ Ops processes site-by-
D Other Services > -10 site apply CL
FY16A FY17A Target methodology
> 10 $ MM
1 Management estimates loss reduction
16 CEVA Logistics AG – Q2 2018Strong Margin Improvement in FM in H1
Productivity improvement - Air & Ocean
Files/operators growth, %
EBITDA margin growth FM
6
in bps 5
60
Air Ocean
35 - 40
Loss making activities – US VAS
EBITDA, US$ m
Target H1
improvement improvement
annually const. FX c. 5 m
H1 17 H1 18
17 CEVA Logistics AG – Q2 2018Contract Logistics Margin Improvement
CL EBITDA Margin Progression, %
A
Improve Performance in Focus CL Operations
Aftermarket contracts opportunity Actions
4.5-5.0% Lines per head per hour ▪ Opportunities identified
through benchmarking
Upper ▪ Focused improvements at
4.1% quartile
selected contracts
▪ Intensive BPE team on-site
Double-digit intervention to drive
$MM changes
improvement
just in
▪ More than 30% productivity
aftermarket delivered on certain
contracts
- 5 10 15 20 25 30
Medium-Term Double-digit $MM
FY17A A B C D opportunity
Target
B
Address Low-Margin Contracts and Sites
A Improve performance in focus CL operations
Contract distribution by EBITDA margin 1 Actions
Share of FY17A Gross Revenue (%)
▪ Contracts categorized by one
B Address low-margin contracts and sites Fully-costed view – key lever to focus action
79%
many low margin – Operational improvement
Win new business more effectively – Standardised contracts with
– Contract repricing
C solutions and showcases
positive gross
margin – Scope / service change
Commercial acumen – Discipline in pricing and – Termination
D capital employed 21%
▪ Centrally managed and
monitored, executed by
cluster
0%
> 10 $MM opportunity
1 Based on EBITDA margin. Excluding contracts below $2MM to average zero margin
18 CEVA Logistics AG – Q2 2018Underlying Improvements in CL, offset by issues in H1
Focus Contracts – example auto/industrials
Lines/hours, indexed
EBITDA margin growth CL Total focus contracts
117 in current wave (10%
in bps
100
of CL revenue) with
10% profit improve-
ment in H1 yoy
20 - 30 H1 17 H1 18
Low margin Contract Initiative
10
100% = 110 contracts
Target H1 Already terminated,
improvement improvement 30%
repriced, improved
annually const. FX
19 CEVA Logistics AG – Q2 2018We Have Achieved A Lot… And There Is More To Come
FM Productivity CL Productivity Indirect Cost
Example: Ocean Freight Example: Aftermarket Contracts Example: Finance Shared Service Center
Files / Operator Lines (‘000s) per Head per Hour FTE, Constant Scope
75 514
Upper quartile
388
56
42
c. 250
Double-digit $MM
improvement
opportunity
FY15A FY17A Benchmark1 0 10 20 30 Mar-17 Dec-17 Benchmark1
▪ >20% productivity potential from ▪ Double-digit $million potential on c.50 ▪ Headcount reduction achieved through
automation, process standardisation, auto / industrial aftermarket contracts process standardisation and automation –
training ▪ Focused contract approach is expected to working on further > 30% reduction,
▪ Further cost reduction in support yield results in other sectors also partially contractually guaranteed
functions ▪ Important opportunity also in retained
organisation – finance, general
management, HR, etc.
1 Management estimates
20 CEVA Logistics AG – Q2 2018Agenda
1 Business Update Q2 / H1 Results
2 Strategic Progress / Margin Improvement
3 Refinancing
4 Targets
21 CEVA Logistics AG – Q2 2018Refinancing
▪ We have repaid significant debt with proceeds from IPO – net debt down to
$1,132 million as of 30 June
▪ Comprehensive refinancing of bank debt and notes completed in early August:
− $475m Term Loan, upsized from original $400m in view of strong demand
− €300m Senior Secured Notes
− $585m Revolver and ancillary facility
▪ Tender Offer for remaining 9% PIK Notes with 34% acceptance; outstanding Notes
repaid early September
▪ Key benefits new facilities
− Higher flexibility to pursue strategy; public company style covenants
− Longer maturities – 5-7 year tenor
− Enhanced liquidity
− Much lower interest cost
▪ Currently reviewing asset-backed facilities
22 CEVA Logistics AG – Q2 2018New Financing Structure
Amount Comments
Facility Currency Maturity Rates
($ equivalent)
▪ One-tier senior secured
L+375 structure (except for ABS/ABL)
Term Loan B 475 USD 2025 (leverage step ▪ Instruments have received
down to L+350) same BB- / B1 credit rating as
company
350 ▪ Have achieved much lower
Notes EUR 2025 5.25% interest rates, pleased with
(EUR 300)
outcome
▪ >$100 m Finance expense
Revolving savings expected vs. old capital
585 multi currency 2023 L+237.5
Credit Facility structure, subject to base
rates, achieved margins and
drawings
TBD
ABS/ABL
400 multi currency 2020 (Existing:L+175
(Existing)
to L-250)
23 CEVA Logistics AG – Q2 2018Recap: Financial policy
▪ Deleveraging to current levels is transformative for CEVA
− Very positive reactions, will create opportunities and accelerate growth
− Company would have been cash flow positive in 2017, pro forma for new capital
structure
▪ CEVA has a strong strategic platform (service portfolio, geographic footprint,
competencies) – priority is to develop business organically; we have flexibility to do
selective, small M&A at later stage to strengthen in certain areas
▪ Target to pay a first small dividend in FY19 for FY18, larger payouts only once
further delevered
▪ Committed to further deleveraging towards 1.5x-2.0x Net debt / Adjusted EBITDA
over medium term
24 CEVA Logistics AG – Q2 2018Agenda
1 Business Update Q2 / H1 Results
2 Strategic Progress / Margin Improvement
3 Refinancing
4 Targets
25 CEVA Logistics AG – Q2 2018CEVA’s Targets
Vision: The provider of choice in selected segments through superior solutions and customer intimacy
Mid-Term Long-Term
Revenue 4.0% +,
Above Market
Growth Accelerating
EBITDA
> 4.0% > 5.0%
Margin1
▪ c.$100m improvement in adjusted EBITDA medium-term
▪ Continued progress towards targets this year
1 EBITDA margin excludes share of Anji JV EBITDA and is before specific items and share-based compensation
26 CEVA Logistics AG – Q2 2018Investment Highlights
Favourable industry dynamics – Poised to benefit from structural growth
1 and ongoing consolidation
Strong strategic platform – Uniquely positioned through broad service
☻2 offering, global presence, blue-chip customer base and solutions capabilities
Business much transformed – New management has strengthened the
3 business and improved results
Further important earnings upside – Clear plans and continued
4 disciplined execution of important cost and growth opportunities
Attractive financial profile – Flexible, asset-light business model and
5 deleveraging will support cash generation
27 CEVA Logistics AG – Q2 2018Appendix CEVA Logistics AG – Q2 2018
New CEVA since 2014

                                                                                       1      Rebuilding foundations                                 2   Executing improvements –
                                                                                                                                                              Growth, margin

                                                                                                        New management Excellence
          Creation of                                                            Xavier Urbain           and operating  Program
            CEVA1                                     Debt for Equity              new CEO                  model        started                                 IPO       More to come

                                                                                                                                                          …
                                         …                                                                                                               …

               2006                                             2013                     2014                    2015                     2016                2018

                                 “Old” CEVA                                                                                         “New” CEVA
         ▪    Poor organisational set-up, many layers,                             ▪    New operating model – matrix organisation with strong emphasis on
              no product focus                                                          business lines and products
         ▪    Leadership without industry experience                               ▪    Almost entirely new management team
         ▪    Underinvested, fragmented technology                                 ▪    IT and processes standardisation, upgrading of technology
         ▪    Not winning enough new businesses                                    ▪    New business development approach
         ▪    Weak performance management                                          ▪    Tight performance management
         ▪    Distracted by financial situation                                    ▪    Cost reductions, productivity, working capital and addressing legacy issues

1 Established through Apollo’s 2006 acquisition of TNT’s Contract Logistics business and its subsequent merger with Eagle Global Logistics in 2007

   29        CEVA Logistics AG – Q2 2018
Financial Performance 2014-2017
Total Revenue Adjusted EBITDA EBITDA Margin Progression vs Peers
$ MM in Constant FX1 $ MM in Constant FX1 %
3,3
2,6
6.914 6,994 280
6.735 6.634
254 249
213
5,7 6,2
2,6 +0 bps 2,6
FY14A FY15A FY16A FY 17A FY14A FY15A FY16A FY 17A FY14A FY17A
$MM in Reported FX $MM in Reported FX
7,8643 6,959 6,646 6,994 2423 273 254 280
1 Constant FX retranslates all years at 2017 FX rates for both revenue and Adjusted EBITDA
2 Operating Cash Flow post Dividends Received from Anji-JV, Tax and Capital Expenditure
3 Including S.I.T.T.A.M. S.r.l. operations ($107 MM Revenue, $ 3 MM EBITDA)
30 CEVA Logistics AG – Q2 2018Integrated Solutions Provider with Balanced Portfolio
Broad Service Offering, Comprehensive Solutions Balanced Product, Geographic and Industry Exposure2
Business Line Customer Segment
Freight Management Contract Logistics % Gross Revenue; FY17A % Gross Revenue; FY17A
Freight
▪ Air Freight ▪ Warehousing Management Other
47% 43%
▪ Ocean Freight ▪ Value added services Contract
Logistics
▪ Ground transportation ▪ Transportation and 53%
distribution Top 100
▪ Value added services, 57%
incl. customs
brokerage
Region Industry
% Gross Revenue; FY17A % Gross Revenue; FY17A
Integrated Supply Chain Solutions / SCS1 Energy, 3% Other,1%
Europe/MEA5 Americas3
Healthcare, 5% Consumer &
40% 33%
Technology Retail, 29%
Asia Pacific4 15%
26%
incl. Anji-
Industrial &
CEVA Automotive
Aerospace, 22%
32% 25%
Strong Strategic Platform
▪ Global presence, strong footprint in growth markets, notably Asia
▪ Blue-chip customer base
▪ Diversified industry sector mix
▪ Broad service offering, contract logistics / solutions capability
1 Reported in Contract Logistics
2 Excluding contribution from Anji-CEVA JV
3 Comprising North America, Central America, and South America clusters
4 Comprising South East Asia, Mekong, India, Australia and New Zealand, China, and North Asia clusters
5 Comprising UK, Ireland and Nordics, Benelux, France, Germany, Central and Eastern Europe, Italy, Iberia, and BAMECA (Balkans, Middle East and Africa) clusters
31 CEVA Logistics AG – Q2 2018Customer Portfolio – Blue Chip Customer Base,
Well Balanced across Industry Sectors
Customer Facts Industry Sector Coverage and Customer Examples
▪ Strong base of multi-national customers Share of
Up from 24% in FY14A
Revenue1
— 57% of Revenue with top 100 accounts
Consumer
29%
— 39% of Revenue with Fortune Global 500 Companies & Retail
▪ No customer greater than 3.5% of Revenue (FY17A)
Automotive 25%
▪ Top 30 customers:
— Represent 41% of Revenue
Industrial &
22%
— Average relationship of 15 years Aerospace
— 29 served in CL and FM ‒ cross-selling is working
— 29 served in more than 10 countries Technology 15%
▪ Substantial room for growth even with key accounts: CEVA’s
estimated share of wallet is 3.1% Healthcare 5%
▪ Margins of top accounts in line with average margins
▪ Differentiated go-to-market approach for key accounts, global Energy 3%
customers and medium-local customers
1 As of FY17A; 1% of Revenue in other / non-classified
32 CEVA Logistics AG – Q2 2018Why do Customers Choose CEVA?
Automotive1 Consumer & Retail1
▪ Long term relationship since ▪ Won significant contracts in
the 1980s with operations in ANZ and US after operating
26 countries DC in UK successfully
▪ Broad range of services: ▪ US contract is largest IKEA
inbound, outbound, operation in the States
manufacturing support ▪ Key success factors:
▪ Key success factors: — Globally deployable
— Capabilities, expertise solution
— Customer intimacy — Strong team, industry
— Flexibility expertise
— Team, executive — Leveraged IT to create
involvement value
Industrial1 Consumer & Retail1
▪ Global supply chain solution, ▪ Won landmark contract
sole provider for inbound and A Leading against DHL, Schenker,
aftermarket Kühne + Nagel
▪ Won significant contract from E-commerce ▪ First time customer
Kühne + Nagel Player outsourced such
▪ Key success factors: comprehensive services
— Solution design for ▪ Key success factors:
complex operation — Designed pragmatic,
— Strong global project scalable solutions in
management team complex context
— IT solutions and capability — Local management team
— Undertaking to optimise — CEVA as strategic partner
supply chain cost for RR in for further regions
years to come
1 Images are illustrative and not necessarily representative of the respective customer operations
33 CEVA Logistics AG – Q2 2018Freight Management at a Glance
Air Freight Ocean Freight Other Services
▪ Air Freight Services ▪ Full Container Load Additional
– Standard ▪ Less than Container Ground Services
expedited service Load ▪ Full and less-than-full ▪ Value Added Service
– Shipment with ▪ Freight Management truckload services (VAS) – complemen-
transit time 48 – ting services e.g.
Short Services ▪ Expedite network US cross-docking,
96 hours
Description ▪ Ocean Charter and ▪ Dedicated transport packing/repacking
of Activities
– Consolidation Project Solutions
through CFS ▪ Asset-light model ▪ Customs brokerage
▪ Air Charter and On- (standalone)
board Courier
Selected ▪ Global #71 with 480k ▪ Global #121 with 729k ▪ Total Ground shipments 2.4 MM
Facts tons of volume TEUs of volume ▪ 0.5% EBITDA margin
2017 – ▪ Gross revenues of ▪ Gross revenues of
Illustrative $1,384 MM $962 MM
▪ 2.9% EBITDA margin ▪ 3.2% EBITDA margin
▪ 13% conversion ratio ▪ 15% conversion ratio
1 Transport Intelligence report, Global Freight Forwarding 2017; ranking in Revenue for Air and TEU for Ocean
Note: Product financials based on management estimates and cost allocations not audited
34 CEVA Logistics AG – Q2 2018Contract Logistics at a Glance
Warehousing and Transportation and Supply chain
value added services distribution solutions
▪ Central & regional distribution ▪ Just-In-Time transportation & ▪ Supply chain design and
centers sequencing execution over multiple modes
and geographies
▪ Light manufacturing / ▪ Outbound / store delivery incl.
Description customization and other value mission-critical spares ▪ Controlling and monitoring
added services solutions
of Activities ▪ White Glove delivery and
▪ Returns and reverse logistics installation ▪ 4PL service offering integration
and management of other 3PL
▪ Quality control and export providers
services
#51 Global Player in CL specializing in end-to-end supply chain solutions
Selected
c. 28MM order lines and shipments per month
Facts
2017 –
c. 9MM sqm warehouse space, over 750 locations in >30 countries
Illustrative
Revenues of $3,724MM and EBITDA of $154MM (4.1% margin)
1 Transport Intelligence report, Global Contract Logistics 2017
35 CEVA Logistics AG – Q2 2018Further Margin Improvement Opportunity
Freight Management EBITDA Margin Example: Air Freight KPIs
%, FY17A1 Volume Growth, % YoY, FY17A
7,1 20
6,3
12 11
8 9
2,5 2,6 3.0
2.3
A&O2
Yield, Net Revenue / Ton, FY17A, $3
1.100
645 703 684
480
Contract Logistics EBITDA Margin
%, FY17A1
8,3
Conversion Rate, EBITDA / Net Revenue, FY17A, %
6,2 6,0
32 37
4.1 20 16
3,2 13
4 5
1 EBITDA before specific items
2 Air and Ocean, part of FM ▪ Good volumes
3 Converted to $ from local currency at spot exchange rate as of March 2018 ▪ Decent yields
4 Approximate, based on Global Forwarding results, breakdown into Air and Ocean not available
5 Air & Ocean Freight combined ▪ Conversion lower due to still too high cost base
SOURCE Company Reports
36 CEVA Logistics AG – Q2 2018Business Development – Accelerating Growth
A B C
Strengthen key account relations, Develop more multi-national
increase share of wallet customers, increase shares Grow field sales effectively
CEVA’s share of logistics spend, Share of logistics spent, % Field Sales Agents Added Value1
top c. 45 customers %
3,1
100% = $97bn 3.1% 3,3x
2,7x
0,6
Current Key Identified Hunting
Accounts Customers FY15A FY17A Target
Approach Approach Approach
▪ Dedicated senior account ▪ “Hunting” team set up in late ▪ Product training and coaching
managers for top c. 45 2017, led by senior executive ▪ Rigorous weekly performance
customers ▪ Targeted customer identification reviews
▪ Partnership emphasis – 400 “hunting” customers (of ▪ Highly attractive commissions for
▪ Executive sponsorship which 200 not yet served) top performers
▪ Proactiveness ▪ Willingness to invest in ▪ Terminating poor performers
customers
▪ Increasing headcount sales force
▪ Rigorous opportunity evaluation
Hypothetical impact
Sales opportunity More sales, higher
of +0.5% share =
c.$300m2 effectiveness
$500m revenue
1 Defined as Field Sales agents Net Revenue generated as multiplier of compensation
2 Management estimate based on 0.1% increase in share of wallet
37 CEVA Logistics AG – Q2 2018Robust, Standardized IT Platform to Support CEVA’s Global
Business and Future Aspirations
Overview Matrix solutions
Warehouse Transportation
One Freight System Supply Chain
Management System Management System
(OFS) Management (SCM)
(WMS) (TMS)
▪ Single global system ▪ Global standards ▪ Fully integrated with ▪ Comprehensive
(export to import) developed, being WMS and OFS supply chain tools,
▪ Manage freight across rolled-out (150+ in 2 ▪ Visibility, traceability including asset, order,
multiple carriers / years) of goods data transport, carrier
modes ▪ Still local / customer – ▪ Fleet monitoring, and disruption
▪ Optimize global specific systems mobile app, PoD1, etc. management
capacity allocation
In-House developed In-House developed
Breadth of services delivered
12 million Over 30,000 users 2 Petabytes $10 million
transactions per month globally operational storage in annual IT investment
processed
Approx. 3,000 servers across More than 1,000 EDI connections More than 850
5 global data centers with customers IT professionals globally
1 Proof of Delivery
38 CEVA Logistics AG – Q2 2018Results Freight Management - H1 2018
All figures are before specific items and SBC
Quarter ending 30 June 2018
Delta
Q2 2018 Q2 2017 Delta at constant FX
($ million) ($ million) ( %/$ million) ( %/$ million)
Revenue 853 789 +8.1% +5.4%
Net Revenue 230 216 +6.5% +3.1%
Operating Expenses 203 196 +3.6% +1.0%
EBITDA1 27 20 7 7
EBITDA Margin2 3.2% 2.5% +70bp +70bp
Conversion rate 11.7% 9.2% +240bp +270bp
Half year Ending 30 June 2018 Delta
H1 2018 H1 2017 Delta at constant FX
($ million) ($ million) ( %/$ million) ( %/$ million)
Revenue 1,656 1,491 +11.1% +7,0%
Net Revenue 454 420 +8.1% +4.4%
Operating Expenses 412 389 +5.9% +2.2%
1
EBITDA 42 30 12 12
EBITDA Margin2 2.5% 2.0% +50bp +60bp
Conversion rate 9.3% 7.1% +210bp +240bp
1 Before Specific Items and SBC
2 Conversion: EBITDA before Specific and SBC / Net revenue
39 CEVA Logistics AG – Q2 2018Quarterly Air and Ocean Volume and Yield Development
Air export volumes (t) quarterly growth (YoY, in %) Yield: Net Revenue/t ($)
15,6 772
659 657 711
11,8 641 626
10,2 + 10.9%
8,6
~4%
1,6
-1,3
Q1 17 Q2 17 Q3 17 Q4 17 Q1 18 Q2 18 Market Q1 17 Q2 17 Q3 17 Q4 17 Q1 18 Q2 18
Q2 18(1)
Volumes (thousand t)
105.6 121.8 122.9 129.6 107.3 120.2
Ocean volumes (TEU) quarterly growth (YoY, in %) Yield: Net Revenue/TEU ($)
286 289 282 285 274
266 - 5.2%
8,5 8,3
5,9 6,9
3,5 2,8 ~4%
Q1 17 Q2 17 Q3 17 Q4 17 Q1 18 Q2 18 Market Q1 17 Q2 17 Q3 17 Q4 17 Q1 18 Q2 18
Q2 18(1)
Volumes (thousand TEU)
167.4 180.0 192.4 189.1 181.6 194.9
1 Company’s estimate
40 CEVA Logistics AG – Q2 2018Revenue of Air, Ocean and other FM - H1 2018
Revenue of FM Products1
YoY Growth
Quarter ending 30 June 2018
Q2 2018 YoY Growth at constant FX
($ million) ( %) ( %)
Air 365 +9.6% +5.9%
Ocean 255 +8.7% +4.9%
Other FM 233 +5.2% +5.5%
Revenue of FM Products1 YoY Growth
Half year Ending 30 June 2018 H1 2018 YoY Growth at constant FX
($ million) ( %) ( %)
Air 700 +15.5% +9.9%
Ocean 503 +11.1% +5.5%
Other FM 453 +5.6% +4.8%
41 CEVA Logistics AG – Q2 2018Results Contract Logistics - H1 2018
All figures are before specific items and SBC
Quarter ending 30 June 2018
Delta
Q2 2018 Q2 2017 Delta at constant FX
($ million) ($ million) ( %/$ million) ( %/$ million)
Revenue 995 932 +6.8% +4.7%
Net Revenue 695 647 +7.4% +4.8%
Operating Expenses 656 608 +7.9% +4.8%
EBITDA1 39 39 - 1
EBITDA Margin 3.9% 4.2% -30bp -10bp
Half year Ending 30 June 2018 Delta
H1 2018 H1 2017 Delta at constant FX
($ million) ($ million) ( %/$ million) ( %/$ million)
Revenue 1,982 1,826 +8.5% +3.8%
Net Revenue 1,386 1,271 +9.0% +3.9%
Operating Expenses 1,309 1,197 +9.4% +3.7%
1
EBITDA 77 74 3 4
EBITDA Margin 3.9% 4.1% -20bp +10bp
1 Before Specific Items and SBC, including Anji-CEVA
42 CEVA Logistics AG – Q2 2018Specific Items- Historical Data 2014-2017
Historical Evolution of Specific Items Breakdown of Specific Items and SBC1
▪ Lower levels of specific items under new
$ MM, Reported FX management team
New
$ MM,
FY14A FY15A FY16A FY17A ▪ Still working through legacy issues
Reported FX – Legal (e.g. independent contractor claims,
Management
CIL litigation), Tax
101 Total Specific
64 23 59 45 – Certain restructurings (e.g. Italy)
Items and SBC
– Largest part is behind us
▪ SBC reflects current PE-type equity
SBC - 1 12 9 management plan, non-cash
76
74 ▪ Restructuring costs relating to:
64 Specific Items, – FY14: reorganisation/removal of regional
64 22 47 36
Thereof: management structure
58
– FY 16/17: Excellence Program
47
Litigation &
18 - 15 - ▪ $30 MM restructuring charges in FY17 with
Legacy Tax short paybacks and lasting improvements, key
36 items:
Write-offs - 6 - - – $10 MM US turnaround (>1,000
redundancies)
22
– $6 MM Italy restructuring (>200 people,
Advisory,
Other2
7 12 9 6 expected >$9 MM p.a. saving for total
expected cost of c.$15 MM)
– $5 MM Benelux delayering (>80 people, $4
Restructuring 40 4 23 30 MM p.a. savings)
FY10A FY12A FY14A FY16A
FY11A FY13A FY15A FY17A ▪ Some restructuring charges still in 2018, not
much anticipated for 2019
1 Due to changes in accounting policy, historical (FY10 – FY14 inclusive) Specific Items exclude Share Based Compensation (SBC)
2 Reflects advisor costs related to strategic project
43 CEVA Logistics AG – Q2 2018Specific Items affecting EBITDA - H1 2018
Half Year Ending 30 June 2018 Comments
H1 2018 H1 2017
($ million) ($ million) ▪ Much lower restructuring cost
than PY
Restructuring 7 15
▪ Litigation in PY had benefitted
Litigation & legacy tax (1) (7) from $10m cargo claim
Other - 1 compensation
▪ Total IPO and refinancing cost
Sub-Total 6 9 of $77m of which $43m
through P&L, $34m through
equity
IPO and related costs 20 –
▪ Share-based compensation
Share-based compensation 11 5 cost increase reflects one-time
option grant in context of IPO
44 CEVA Logistics AG – Q2 2018Net Working Capital
▪ NWC at similar levels than PY though weaker NWC Evolution (end of period)
performance relatively during first half year $ million
▪ NWC development in Q2 impacted particularly by 0 (0.4)%
− Comparative (1.1)%
(50) (1.2)%
− Growth
− Lower factoring (100)
− Certain earlier payment terms, e.g., US payroll (1.8)% (2.2)%
(2.4)%
(2.7)%
(150)
▪ Structural improvements delivered yoy (2.0)%
(2.4)%
− 1 day lower billing delays in FM and CL (200)
− Approx. $20m lower overdues (3.6)%
(250)
− Maintained customer terms but lengthened
supplier terms (300)
▪ Working on further structural improvements incl. Q1 Q2 Q3 Q4
realizing benefits from IPO 2018 2017 2016
as % of LTM as % of LTM as % of LTM
Revenue Revenue Revenue
1 Other WC includes accruals incl. for freight charges, tax, social security, interest and other liabilities
45 CEVA Logistics AG – Q2 2018Balance sheet
All figures in actual currency
$ million 30.06.2018 30.06.2017 $ million 30.06.2018 30.06.2017
Assets Liabilities and equity
Property, plant and equipment 167 160
Equity (parent company) 367
Goodwill 1,334 1,442 (608)
Other intangibles 75 91 Non-controlling interests 3 3
Others 268 165 Total equity 370 (605)
Non-current assets 1,948 1,858 Non-current liabilities 1,724 2,367
Trade receivables 1,113 1,051 Trade and other payables 1,398 1,367
Cash and cash equivalents 327 234 Borrowings 37 189
Others 263 282 Others 122 107
Current assets 1,703 1,567 Current liabilities 1,557 1,663
Total assets 3,651 3,425 Total liabilities and equity 3,651 3,425
46 CEVA Logistics AG – Q2 2018Financial Covenants New Facility
Comments
Dec. 2019 Dec. 2020
Maintenance Covenants RCF
2018 onwards onwards
▪ Certain add-backs / exclusions in
Leverage : leverage calculation, leverage in
Net Debt / Adjusted EBITDA covenant test lower than reported
>4.5x >4.0x >3.75x
leverage
Interest Cover: ▪ Much more financial flexibility, less
Adjusted EBITDA / Interest >2.0x >2.0x >2.0x onerous than previous facilities
47 CEVA Logistics AG – Q2 2018Cash Flow Overview - Historical Data 2014-2017
$ MM, Reported FX FY14A FY15A FY16A FY17A
EBITDA before Specific Items and SBC 206 234 212 230
Cash-Relevant Specific Items1 (64) (23) (31) (43)
Gain on Disposal of PP&E (2) (1) (17) (1)
Retirement Benefit Obligations (10) (5) (5) (8)
Provisions (11) (2) 11 (2)
Change in Working Capital - 11 (42) 33
Other (17) 2 15 -
Operating Cash Flow 102 216 143 209
Dividends Received (Anji JV) 18 - 27 15
Net Finance Expenses (229) (166) (170) (178)
Tax (29) (22) (39) (37)
Capital Expenditure (66) (91) (74) (102)
Free Cash Flow (204) (63) (113) (93)
▪ Management Normalisations
— Higher growth / NWC in Q4: $28 MM
— Asset financed within FCF: $15 MM
▪ Management Normalised FCF of ($50 MM)
1 Specific Items only categorised into Cash and Non-Cash from FY16; prior years assume all Specific Items are Cash Items
48 CEVA Logistics AG – Q2 2018Shareholder
1 Structure
25.04% CMA CGM*
Various institutional ~60%
and retail investors
~15%
Apollo, Franklin,
Capital Research
▪ Diversified, long-term shareholder base
▪ CMA CGM converted its securities into common shares in August
* Including shares owned by the Saadé family
49 CEVA Logistics AG – Q2 2018Safe harbor statement
This news release contains specific forward-looking statements. These forward-looking statements include, but are not
limited to, discussions regarding the proposed private offering of the Notes described above, its guidance for 2018 and
beyond, discussions regarding industry outlook, CEVA's expectations regarding the performance of its business or joint
ventures, its liquidity and capital resources, and other non-historical statements. These statements can be identified by the
use of words such as "believes" "anticipates," "expects," "intends," "plans," "continues," "estimates," "predicts," "projects,"
"forecasts," and similar expressions. All forward-looking statements are based on management's current expectations and
beliefs only as of the date of this news release and, in addition to the assumptions specifically mentioned in the above
paragraphs, there are a number of factors that could cause actual results and developments to differ materially from those
expressed or implied by these forward-looking statements, including the effect of local and national economic, credit and
capital market conditions, a downturn in the industries in which we operate (including the automotive industry and the air
freight business), risks associated with CEVA's global operations, fluctuations and increases in fuel prices, CEVA's substantial
indebtedness, restrictions contained in its debt agreements and risks that it will be unable to compete effectively. Further
information concerning CEVA and its business, including factors that potentially could materially affect CEVA's financial
results, is contained in the annual and quarterly reports of CEVA Logistics AG (and its predecessor CEVA Holdings LLC),
available on the Company's website, which investors are strongly encouraged to review. Should one or more of these risks or
uncertainties materialise or the consequences of such a development worsen, or should underlying assumptions prove
incorrect, actual outcomes may vary materially from those forecasted or expected. CEVA disclaims any intention or obligation
to update publicly or revise such statements, whether as a result of new information, future events or otherwise.
This presentation includes certain non-GAAP financial information. Because not all companies calculate non-IFRS financial
information identically (or at all), the presentations herein may not be comparable to other similarly titled measures used by
other companies. Further, such non-GAAP financial information of the Company should not be considered a substitute for the
information contained in the historical financial information of the Company, if any, prepared in accordance with IFRS
included herein.
50 CEVA Logistics AG – Q2 2018Contacts Investors: Pierre Bénaich SVP Investor Relations pierre.benaich@cevalogistics.com +41 41 547 00 48 Media: Matthias Hochuli SVP Corporate Development Matthias.hochuli@cevalogistics.com +41 41 547 00 52 51 CEVA Logistics AG – Q2 2018
You can also read