1Q21 Earnings Call Presentation - April 21, 2021

Page created by Elizabeth Bryant
 
CONTINUE READING
1Q21 Earnings Call Presentation - April 21, 2021
1Q21 Earnings Call Presentation
          April 21, 2021
1Q21 Earnings Call Presentation - April 21, 2021
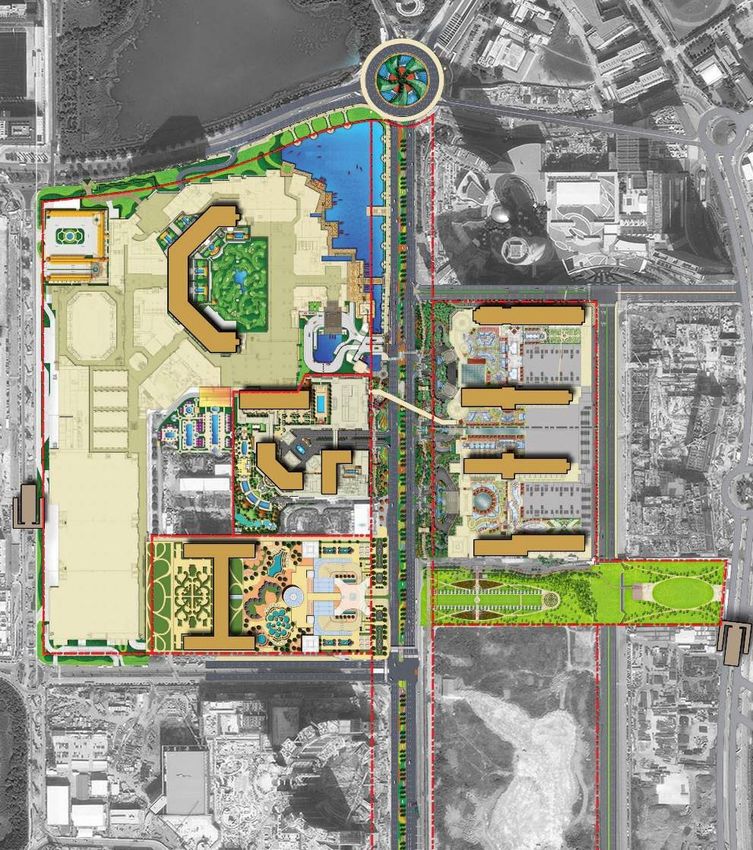
Forward Looking Statements
This press release contains forward-looking statements made pursuant to the Safe Harbor Provisions of the Private Securities Litigation Reform Act of
1995. Forward-looking statements involve a number of risks, uncertainties or other factors beyond the company’s control, which may cause material
differences in actual results, performance or other expectations. These factors include, but are not limited to: the uncertainty of the extent, duration and
effects of the COVID-19 pandemic and the response of governments and other third parties, including government-mandated property closures, increased
operational regulatory requirements or travel restrictions, on our business, results of operations, cash flows, liquidity and development prospects; general
economic conditions; disruptions or reductions in travel and our operations due to natural or man-made disasters, pandemics, epidemics, or outbreaks of
infectious or contagious diseases; our ability to invest in future growth opportunities; execute our previously announced capital expenditure programs in
both Macao and Singapore, and produce future returns; new development, construction and ventures; government regulation; risks relating to our gaming
licenses and subconcession; our subsidiaries’ ability to make distribution payments to us; substantial leverage and debt service; fluctuations in currency
exchange rates and interest rates; gaming promoters; competition; tax law changes; transportation infrastructure in Macao; political instability, civil unrest,
terrorist acts or war; legalization of gaming; insurance; the satisfaction of the conditions precedent to the consummation of the proposed sale of our Las
Vegas real property and operations, including the Venetian Resort Las Vegas and the Sands Expo and Convention Center (the “Proposed Transaction”),
including the receipt of regulatory approvals; unanticipated difficulties or expenditures relating to the Proposed Transaction; legal proceedings, judgments
or settlements that may be instituted in connection with the Proposed Transaction, including those against us, our board of directors and executive officers
and others; disruptions of current plans and operations caused by the announcement and pendency of the Proposed Transaction; potential difficulties in
employee retention due to the announcement and pendency of the Proposed Transaction; the response of customers, suppliers, business partners and
regulators to the announcement of the Proposed Transaction; and other factors detailed in the reports filed by Las Vegas Sands Corp. with the Securities
and Exchange Commission. Readers are cautioned not to place undue reliance on these forward-looking statements, which speak only as of the date
thereof. Las Vegas Sands Corp. assumes no obligation to update such information.

Within this presentation, the company may make reference to certain non-GAAP financial measures including “adjusted net income/loss,” “adjusted
earnings/loss per diluted share,” and “consolidated adjusted property EBITDA,” which have directly comparable financial measures presented in
accordance with accounting principles generally accepted in the United States of America ("GAAP"), along with “adjusted property EBITDA margin,” “hold-
normalized adjusted property EBITDA,” “hold-normalized adjusted property EBITDA margin,” “hold-normalized adjusted net income/loss,” and “hold-
normalized adjusted earnings/loss per diluted share,” as well as present these or other items on a constant currency basis. The specific reasons why the
company’s management believes the presentation of each of these non-GAAP financial measures provides useful information to investors regarding Las
Vegas Sands’ financial condition, results of operations and cash flows, as well as reconciliations of the non-GAAP measures to the most directly
comparable GAAP measures, are included in the company’s Form 8-K dated April 21, 2021, which is available on the company’s website at
www.sands.com. Reconciliations also are available in the Reconciliation of Non-GAAP Measures and Other Financial Information section of this
presentation.
                                                                                                                                                                  2
1Q21 Earnings Call Presentation - April 21, 2021
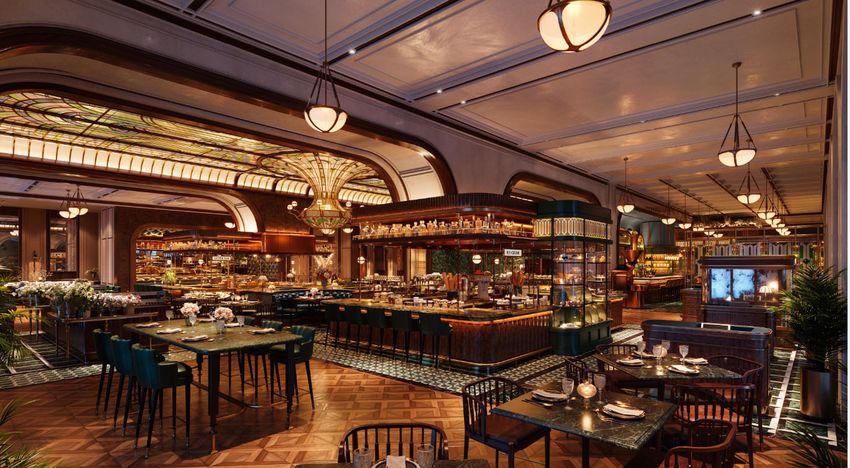
The Investment Case for Las Vegas Sands

    The global leader in Integrated Resort development and operation

    Investment grade balance sheet

    A unique MICE-based business model delivering industry-leading returns

    Unmatched development and operating track record creates competitive advantage as we pursue
     opportunities in new markets

    Proven history of delivering innovative growth in Asia

    A commitment to maximizing shareholder returns

    Disciplined, experienced leadership team dedicated to driving long-term shareholder value
Maximizing Return to Shareholders by:
1. Pursuing growth in Macao and Singapore through investments in capacity expansion and
   enhancement of our industry-leading property portfolio
2. Leveraging proven MICE-based Integrated Resort business model and balance sheet strength to
   pursue growth opportunities in new markets
3.   Maintaining strong balance sheet and liquidity to preserve ability to make investments in future
     growth

                                                                                                        3
1Q21 Earnings Call Presentation - April 21, 2021
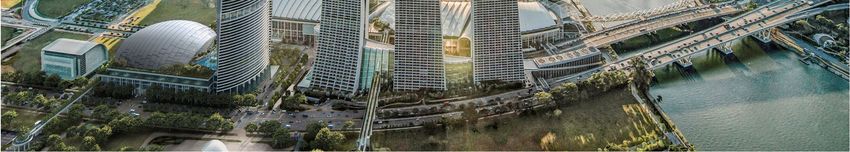
Highlights for the Quarter

   Visitation to our markets remains well below historical levels due to travel restrictions related to COVID-19

   Despite meaningfully reduced visitation, we are generating positive EBITDA in both Macao and Singapore

   Strong demand exhibited by customers who are able to visit our integrated resorts

          •    In Macao, with market visitation at approximately 16% of 2019 levels, 1Q21 mass gaming has
               recovered to approximately 38% of 1Q19 levels

          •    Luxury retail sales achieved records in Macao in the first quarter of 2021

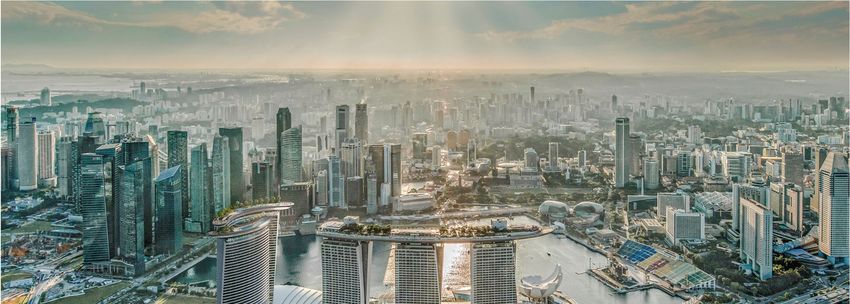
Our market-leading integrated resort offerings in Macao and Singapore position us for growth as
travel and tourism spending eventually recover

                                                                                                                    4
1Q21 Earnings Call Presentation - April 21, 2021
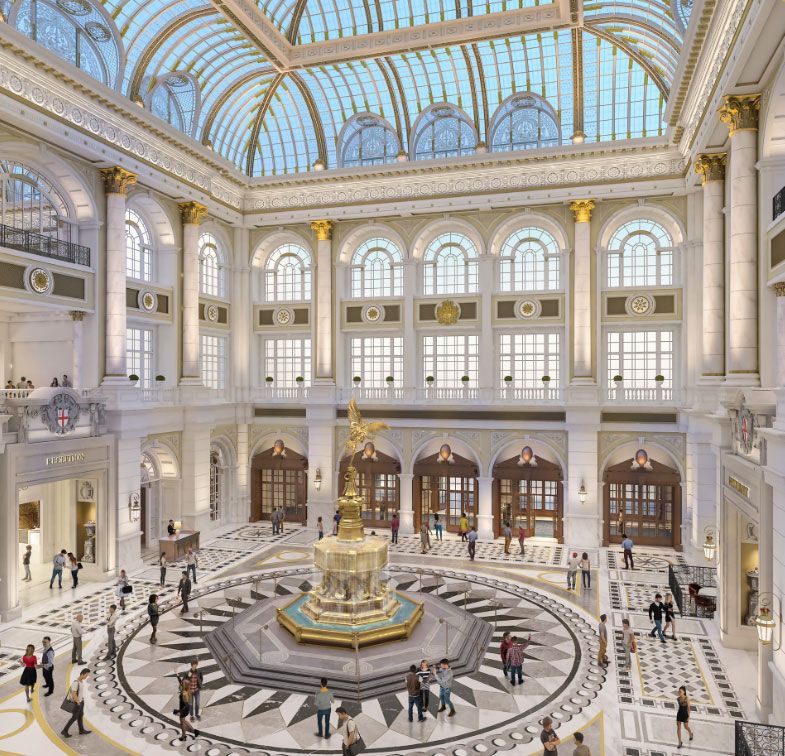
Macao Operating Environment

   Our gaming and non-gaming operations in Macao continue to be impacted by travel restrictions related to
    the COVID-19 pandemic; visitation remains well below 2019 levels

   Daily visitation in March 2021 increased approximately 40% from the levels seen in January and February
    of 2021

   An increase in the number of visas available through the IVS and other visa programs, and the easing of
    travel restrictions, will be important for the recovery

Indicators of strong demand:

   Despite limited growth in visitation to Macao

          •    Macao Market GGR increased sequentially 8.2% in 1Q21 versus 4Q20

          •    Sands China GGR increased sequentially 20.6% in 1Q21 versus 4Q20

          •    Sands China Premium Mass GGR increased 12% sequentially in 1Q21 versus 4Q20

          •    Total tenant sales in our Macao retail malls were up ~100% YoY in 1Q21; our Four Seasons
               luxury mall tenant sales were 16% above 1Q19 levels

                                                                                                              5
1Q21 Earnings Call Presentation - April 21, 2021
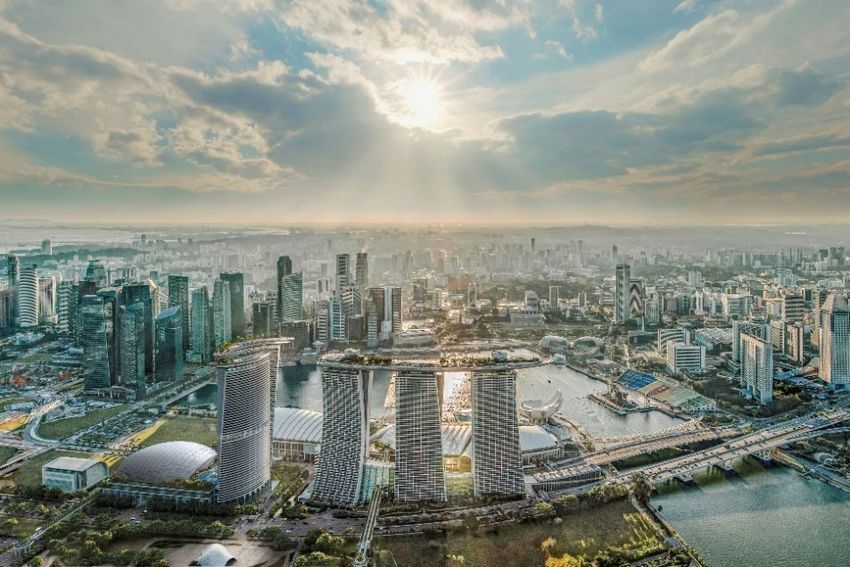
Singapore Operating Environment

   Pandemic related travel restrictions remain in place in Singapore

   Visitation to Marina Bay Sands has been limited principally to people residing within Singapore

   The opening up of international travel into Singapore will be important for the recovery

Indicators of strong demand:

   Customer demand indicators present within our existing operations in 1Q21:

          •    Total slot handle increased 13% sequentially compared to 4Q20

          •    Rolling volume increased 20% sequentially compared to 4Q20

          •    Non-rolling chip drop increased 21% sequentially compared to 4Q20

          •    Retail tenant sales strong, particularly in the luxury segment

                                                                                                      6
1Q21 Earnings Call Presentation - April 21, 2021
First Quarter 2021 Financial Results
Quarter Ended March 31, 2021 vs Quarters Ended March 31, 20201 and 2019
  Note: results for the first quarter of 2020 include a period before our operations were impacted by the COVID-19 pandemic, as well as a period when our operations were
  closed due to the pandemic; we are presenting the first quarter of 2019 to provide comparisons to a quarterly period prior to the impact of the COVID-19 pandemic.

  ($ in US millions, except per share information)                                                                               LVS Consolidated First Quarter Financial Results
                                                                                                                                                                                                          $ Change Versus
                                                                                                          1Q19                           1Q20                           1Q21                          1Q19                          1Q20

  Net Revenue2                                                                                            $3,093                         $1,417                        $1,196                       ($1,897)                          ($221)
                               2
  Net Income (Loss)                                                                                            678                             (92)                        (280)                         (958)                          (188)
  Net Income (Loss) - including Las Vegas, Sands Bethlehem                                                     744                             (51)                        (342)                      (1,086)                           (291)
                     2
  Diluted EPS                                                                                               $0.67                         ($0.05)                       ($0.28)                       ($0.95)                        ($0.23)
  Diluted EPS - including Las Vegas, Sands Bethlehem                                                        $0.75                              -                        ($0.36)                       ($1.11)                        ($0.36)
  Dividends per Common Share                                                                                $0.77                          $0.79                                 -                    ($0.77)                        ($0.79)

  Adjusted Net Income (Loss) Attributable to LVS2                                                              639                             (65)                        (192)                         (831)                          (127)
                                    2
  Adjusted Diluted EPS                                                                                      $0.82                         ($0.09)                       ($0.25)                       ($1.07)                        ($0.16)

  Adjusted Property EBITDA2                                                                                 1,281                             349                           244                       (1,037)                           (105)
                                                        2
  Adjusted Property EBITDA Margin                                                                           41.4%                          24.6%                         20.4%                   -2,100 bps                       -420 bps

  Hold-Normalized :
       Adjusted Property EBITDA2                                                                          $1,278                            $354                          $191                      ($1,087)                          ($163)
                                                             2
       Adjusted Property EBITDA Margin                                                                      41.3%                          24.7%                         17.0%                   -2,430 bps                       -770 bps
       Adjusted Diluted EPS2                                                                                $0.82                         ($0.08)                       ($0.30)                       ($1.12)                        ($0.22)

1. The COVID-19 pandemic and related travel restrictions began to impact our operations in Macao and Singapore during the first quarter of 2020.
2. Excludes the results of the Las Vegas Operating Properties, as they are classified as a discontinued operation held for sale. The operations of Sands Bethlehem, sold in May 2019, were excluded from the Company’s 1Q19 consolidated results for
   purposes of presenting information from continuing operations comparable to those presented in 1Q20 and 1Q21.

                                                                                                                                                                                                                                                       7
1Q21 Earnings Call Presentation - April 21, 2021
LVS Adjusted Property EBITDA Performance
Select Quarterly Results
  Note: results for the first quarter of 2020 include a period before our operations were impacted by the COVID-19 pandemic, as well as a period when our operations were
  closed due to the pandemic; we are presenting the first quarter of 2019 to provide comparisons to a quarterly period prior to the impact of the COVID-19 pandemic.

                                                                                                       LVS Adjusted Property EBITDA1
                      ($ in US millions)
                                                   Adjusted Property EBITDA                                                                                      Hold-Normalized Adj. Prop. EBITDA
    $1,800

    $1,500
                        $1,281                                                                                                                    $1,278
    $1,200

       $900

       $600
                                           $349                                                                                                                       $354
       $300                                                                                     $191             $244                                                                                           $216   $191

            $0

      -$300                                                                   -$163                                                                                                                     -$181

                                                            -$425                                                                                                                     -$397
      -$600
                         1Q19              1Q20             2Q20              3Q20             4Q20              1Q21                               1Q19             1Q20              2Q20             3Q20    4Q20   1Q21
1. Excludes the results of the Las Vegas Operating Properties, as they are classified as a discontinued operation held for sale, as well as the results of Sands Bethlehem which was sold on May 31, 2019.
Note: COVID-19 travel restrictions have been in place since the first quarter of 2020.

                                                                                                                                                                                                                              8
1Q21 Earnings Call Presentation - April 21, 2021
Sands China Ltd.
Market Recovering, But Reduced Visitation Impacting Financial Results
  Note: results for the first quarter of 2020 include a period before our operations were impacted by the COVID-19 pandemic, as well as a period when our operations were
  closed due to the pandemic; we are presenting the first quarter of 2019 to provide comparisons to a quarterly period prior to the impact of the COVID-19 pandemic.
                                                                                                                                      Adjusted Property EBITDA
        The Sands China property portfolio continues to be impacted by
                                                                                                           ($ in US millions)
         travel restrictions related to the COVID-19 pandemic which have                                                         Actual                                  Hold-Normalized
                                                                                                          $1,000
         meaningfully reduced visitation to Macao
                                                                                                                      $858                                            $845
                                                                                                            $800
        Adjusted property EBITDA: $100 million in 1Q21

          ─        $75 million on a Hold-Normalized basis                                                   $600

        Mass (non-Rolling tables and slots):                                                               $400

          ─        Non-Rolling table win: $487 million (32% of 1Q19 level)                                  $200
                                                                                                                                      $67       $100                           $84         $75

          ─        Slot win: $39 million (25% of 1Q19 level)                                                  $0
                                                                                                                     1Q19             1Q20      1Q21                  1Q19     1Q20     1Q21

        Occupancy was 43.4% with ADR of $168                                                                                   Non-Rolling Table and Slot Win
                                                                                                           ($ in US millions)
        Rolling volume was $3.8 billion while Rolling win % was 4.66%                                   $2,000                               ~31% of 1Q19
                                                                                                                             $1,673              Level
                                                                                                                             $154
                                                                                                         $1,500

                                                                                                         $1,000
                                                                                                                             $1,519                      $609
                                                                                                                                                                                 $526
                                                                                                          $500                                                  $61                     $39
                                                                                                                                                         $548                    $487
                                                                                                            $0
                                                                                                                             1Q19                        1Q20                    1Q21

                                                                                                                                       Slot Machines   Non-Rolling Tables
The Macao government suspended all casino operations for 15 days from February 5 to February 19, 2020.
Note: COVID-19 related travel restrictions have been in place since the first quarter of 2020.

                                                                                                                                                                                                 9
1Q21 Earnings Call Presentation - April 21, 2021
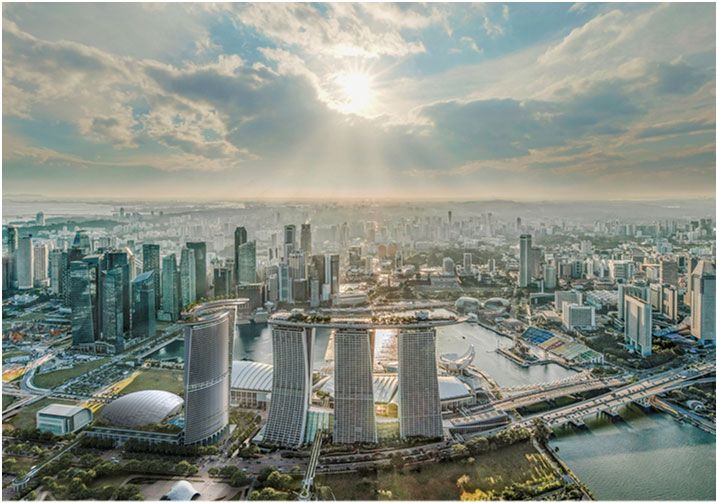
Sands China Mass Market Table Update
 Base Mass and Premium Mass Table Win by Quarter
  Note: results for the first quarter of 2020 include a period before our operations were impacted by the COVID-19 pandemic, as well as a period when our operations were
  closed due to the pandemic; we are presenting the first quarter of 2019 to provide comparisons to a quarterly period prior to the impact of the COVID-19 pandemic.
                     SCL Base Mass Table Win by Quarter                                                                                        SCL Premium Mass Table Win by Quarter
($ in US millions)                                                                                                           ($ in US millions)
  $800                                                                                                                         $800
                                                                                                                                                $774
  $700             $745                                                                                                        $700
                                                                       Avg. Win per Table per Day: $2,054                                                                                           Avg. Win per Table per Day: $5,657

  $600                                                                                                                         $600

  $500                                                                ~20% of                                                  $500                                                                 ~43% of
                                                                       1Q19                                                                                                                          1Q19
                                                                       level                                                                                                                         level
  $400                                                                                                                         $400

  $300                                                                                                                         $300                              $270                                                                  $336
                                    $278                                                                                                                                                                             $300
  $200                                                                                                                         $200
                                                                                        $188
                                                                                                         $151
  $100                                                                                                                         $100
                                                       $4               $23                                                                                                                          $32
                                                                                                                                                                                    $6
      $0                                                                                                                           $0
                                             1                                                                                                                            1
                  1Q19              1Q20             2Q20             3Q20             4Q20             1Q21                                   1Q19              1Q20             2Q20             3Q20              4Q20             1Q21
  Avg.                                                                                                                         Avg.
                     961             687              912               892              892              817                                    446               376              521              531               576              660
Tables                                                                                                                       Tables
  Premium mass revenue in 1Q21 reached ~43% of 1Q19 level; base mass revenue in 1Q21 was
  approximately 20% of 1Q19 level
1. On February 4, 2020, the Macao government announced the suspension of all casino operations for 15 days from February 5 to February 19, 2020.
Note: COVID-19 related travel restrictions have been in place since the first quarter of 2020. Sands China’s base mass and premium mass table revenues as presented above are based on the geographic position of non-rolling (mass) tables on the
gaming floor. Some high-end mass play occurs in the base mass geographic area.

                                                                                                                                                                                                                                                     10
Sands China Mass Market Table and Slots Update
 Total Table Win and Slots Win by Quarter
  Note: results for the first quarter of 2020 include a period before our operations were impacted by the COVID-19 pandemic, as well as a period when our operations were
  closed due to the pandemic; we are presenting the first quarter of 2019 to provide comparisons to a quarterly period prior to the impact of the COVID-19 pandemic.
                          SCL Mass Table1 Win by Quarter                                                                                                   SCL Slots2 Win by Quarter
($ in US millions)                                                                                                         ($ in US millions)
$1,600                                                                                                                       $160
                 $1,519                                                                                                                       $154
                                                                     Avg. Win per Table per Day: $3,664                                                                         Avg. Win per Unit per Day: $131

$1,200                                                                                                                       $120

                                                                   ~32% of                                                                                                      ~25% of
                                                                    1Q19                                                                                                         1Q19
                                                                    Level                                                                                                        Level
   $800                                                                                                                        $80

                                                                                                                                                            $61
                                   $548
   $400                                                                               $488             $487                    $40
                                                                                                                                                                                                          $39
                                                                                                                                                                                             $37

                                                                       $55                                                                                                      $10
                                                      $10                                                                                                              $5
      $0                                                                                                                         $0
                                            3                                                                                                                      3
                  1Q19             1Q20             2Q20             3Q20             4Q20            1Q21                                   1Q19           1Q20       2Q20     3Q20        4Q20         1Q21
  Avg.                                                                                                                       Avg.
Tables           1,407            1,063           1,433            1,423            1,468             1,477                  Units                 5,827     4,196      2,372    2,409        2,766       3,320

  Mass table revenue in 1Q21 was approximately 32% of the 1Q19 level, while slot revenue in 1Q21 was
  approximately 25% of the 1Q19 level
1. Excludes rolling play.
2. Includes slots and electronic table games.
3. On February 4, 2020, the Macao government announced the suspension of all casino operations for 15 days from February 5 to February 19, 2020.
Note: COVID-19 related travel restrictions have been in place since the first quarter of 2020.

                                                                                                                                                                                                                  11
Macao Market: Mass Gaming Segment
Mass GGR Tables & Slots
                                            Macao Market Mass Gaming Revenue (Tables & Slots) & Mass Win-per-Visit1
 ($ US in millions)
 $6,000                                                                                                                                                                                                                                               $1,800
                                                                                                                                                                                  $5,608
                                                                                                                                                                      $5,523
                                                                                                                                                 $5,440     $5,356
 $5,500                                                                                                                               $5,251
                                                                                                     $4,955                                                                                                                                           $1,600
 $5,000                                                                                                         $4,841     $4,864
                                                                                          $4,706                                                                                                   Average mass win
                                                                                                                                                                                                   per visit ~2x 1Q20                                 $1,400
 $4,500                                                             $4,017
                                                         $4,146                $4,169
                                                                                                                                                                                                                                          $1,210
                                              $3,989
 $4,000                            $3,816                                                                                                                                                                                                             $1,200
              $3,609
                        $3,508
 $3,500
                                                                                                                                                                                                                                                      $1,000
 $3,000
                                                                                                                                                                                              $2,180
                                                                                                                                                                                                                                                      $800
 $2,500                                                                                                                                                                                       $677
                                                                                                                                                                                   $609                                        $2,049 $2,067
                                                                                                      $580       $586
 $2,000                                                                                    $536                             $540                             $540       $557                                                                          $600
                                                          $527       $522       $504                                                   $526       $525
              $484                  $471       $494
 $1,500
                         $480                                                                                                                                                                                                                         $400
 $1,000

                                                                                                                                                                                                                    $363                              $200
   $500
                                                                                                                                                                                                         $212

      $0                                                                                                                                                                                                                                              $0
              1Q16       2Q16       3Q16       4Q16       1Q17       2Q17       3Q17       4Q17       1Q18       2Q18       3Q18       4Q18       1Q19       2Q19       3Q19       4Q19       1Q20       2Q20       3Q20       4Q20       1Q21
                                                                                           Mass Win (Tables & Slots)                               Mass Win per Visit

  We estimate Macao market-wide mass win in 1Q21 reached approximately 38% of the level recorded
  in 1Q19
1. Market-wide mass GGR for all periods through 4Q20 is defined as mass win (tables and slots) as reported by the casino operators in their public filings (does not include revenue from Galaxy’s City Clubs business). All figures reported in Hong Kong
   dollars have been converted to USD using a 7.75 exchange rate. Market-wide mass GGR for 1Q21 is estimated by LVS management based on DICJ reported data and LVS management’s estimated differences between DICJ reporting and win
   reported by operators in public filings.
Note: January and February 2021 visitation figures are provided by the DICJ; March 2021 figures are estimated by management. 1Q21 Mass win per visit is estimated. COVID-19 related travel restrictions have been in place since the first quarter of
2020.
Source: Public company filings, Macao DSEC, Macao DICJ, Macao PSP.
                             .
                                                                                                                                                                                                                                                               12
Macao Visitation and Mass Gaming Recovery
Market-Wide Mass Revenue Recovering Faster Than Market-Wide Visitation
 Note: results for the first quarter of 2020 include a period before our operations were impacted by the COVID-19 pandemic, as well as a period when our operations were
 closed due to the pandemic; we are presenting the first quarter of 2019 to provide comparisons to a quarterly period prior to the impact of the COVID-19 pandemic.

                                      Total Macao Visitation1                                                                                                    Macao Mass Gaming Win2
(Visitors in US millions)                                                                                                       ($ in US millions)

12.0                                         ~16% of                                                                           $6,000                                           ~38% of
                                              1Q19                                                                                                        $5,440                 1Q19
                          10.4
                                              Level                                                                                                                              Level
   9.0
                                                                                                                               $4,000

   6.0
                                                                                                                                                                                              $2,180                              $2,067
                                                                3.2                                                            $2,000
   3.0
                                                                                                     1.7

   0.0                                                                                                                                $0
                          1Q19                                 1Q20                               1Q21E                                                    1Q19                                1Q20                              1Q21E
    As estimated market-wide visitation declined in 1Q21 to ~16% of the 1Q19 level, Macao market-wide
    mass GGR in 1Q21 reached ~38% of the 1Q19 level
1. March 2021 Macao visitation figures are not currently available; March visitation is estimated based on actual visitors per day in January and February 2021 to reach 1Q21 total estimated visitation.
2. Market-wide mass GGR for 1Q19, 1Q20 and 1Q21 is defined as mass win (tables and slots) as reported by the casino operators in their public filings (does not include revenue from Galaxy’s City Clubs business). All figures reported in Hong Kong
   dollars have been converted to USD using a 7.75 exchange rate.
Note: COVID-19 related travel restrictions have been in place since the first quarter of 2020.
Source: Public company filings, Macao DSEC, Macao DICJ, PSP.
                            .
                                                                                                                                                                                                                                                        13
Marina Bay Sands
Adjusted Property EBITDA of $144 Million in 1Q21
 Note: results for the first quarter of 2020 include a period before our operations were impacted by the COVID-19 pandemic, as well as a period when our operations were
 closed due to the pandemic; we are presenting the first quarter of 2019 to provide comparisons to a quarterly period prior to the impact of the COVID-19 pandemic.

                                                                                                                                                                Adjusted Property EBITDA
         Marina Bay Sands continues to be impacted by the COVID-19                                                                 ($ in US millions)
          pandemic and the related travel restrictions, which have                                                                  $600                     Actual                                               Hold-Normalized
          meaningfully reduced visitation to Singapore and the Marina Bay
          Sands Integrated Resort                                                                                                                                                                          $433
                                                                                                                                                $423
                                                                                                                                    $400
         Adjusted property EBITDA reached $144 million
                                                                                                                                                               $282                                                       $270
          ─         $116 million on a Hold-Normalized basis
                                                                                                                                    $200
         Mass (non-Rolling tables and slots):                                                                                                                               $144
                                                                                                                                                                                                                                         $116

          ─         Non-Rolling table win reached $128 million, ~45% of 1Q19
                                                                                                                                      $0
                    level                                                                                                                       1Q19           1Q20
                                                                                                                                                                      1
                                                                                                                                                                              1Q21                         1Q19           1Q20
                                                                                                                                                                                                                                 1
                                                                                                                                                                                                                                         1Q21

          ─         Slot win: $157 million, ~96% of 1Q19 level                                                                                               Non-Rolling Table and Slot Win
                                                                                                                                    ($ in US millions)
                                                                                                                                                                            ~63% of 1Q19
         Occupancy was 63.0%, with ADR of $228                                                                                       $500
                                                                                                                                                            $449               Level

                                                                                                                                      $400
         Rolling volume was $1.5 billion; Rolling win % was 5.59%                                                                                          $164                              $336
                                                                                                                                      $300                                                                                       $285
                                                                                                                                                                                              $123
         Recovery indicators:                                                                                                        $200
                                                                                                                                                                                                                                 $157

          −         Strength in slot and table play                                                                                   $100
                                                                                                                                                            $285
                                                                                                                                                                                              $213
                                                                                                                                                                                                                                 $128
          −         Retail tenant sales strong, particularly in the luxury segment                                                         $0
                                                                                                                                                                                                     1
                                                                                                                                                            1Q19                              1Q20                               1Q21
                                                                                                                                                                           Slot Machines             Non-Rolling Tables

1. On April 7, 2020 Marina Bays Sands suspended operations. Certain retail and restaurant operations resumed on June 19, 2020, while gaming operations resumed on July 1, 2020 but at a reduced capacity due to social distancing measures.
Note: COVID-19 travel restrictions have been in place since the first quarter of 2020.

                                                                                                                                                                                                                                                14
Definitive Agreement for the Sale of Our Las Vegas Assets
Transaction Expected to Close in 4Q21

 Key Transaction Details

         On March 3, 2021, LVS announced that it had entered into definitive agreements to sell its Las Vegas real estate and operations
          for an aggregate purchase price of ~$6.25 billion

         VICI Properties Inc. will acquire subsidiaries that hold the real estate and real estate-related assets of The Venetian Resort for
          ~$4.0 billion in cash

         Affiliates of Apollo Global Management, Inc will acquire the operating assets and liabilities for a total consideration of ~$2.25
          billion1:

                           •      ~$1.05 billion in cash, subject to certain post-closing adjustments

                           •      $1.2 billion in seller financing in the form of a six year term loan credit and security agreement

         The transaction is expected to close in 4Q21 and is subject to customary closing conditions and regulatory approvals

1. In connection with the closing, LVS and OpCo Purchaser (affiliates of Apollo Global Management, Inc.) will enter into a post-closing contingent lease support agreement pursuant to which LVS may be required to make certain payments to OpCo
   Purchaser. The support payments are based on the performance of the Las Vegas Business relative to certain agreed upon target metrics for 2021, 2022 and 2023. LVS’ payment obligations are subject to an annual cap equal to $250 million,
   subject to a prorated deduction for when the closing occurs.

                                                                                                                                                                                                                                                    15
Las Vegas Operations1,2
Adjusted Property EBITDA Loss in 1Q21
 Note: results for the first quarter of 2020 include a period before our operations were impacted by the COVID-19 pandemic, as well as a period when our operations were
 closed due to the pandemic; we are presenting the first quarter of 2019 to provide comparisons to a quarterly period prior to the impact of the COVID-19 pandemic.

       Our Las Vegas properties continue to be impacted by the COVID-                                                                                              Adjusted Property EBITDA
        19 pandemic and related travel restrictions - statewide restrictions                                                              ($ in US millions)
                                                                                                                                                                        Actual                                     Hold-Normalized
        on the size of group meetings have meaningfully reduced midweek
        visitation to Las Vegas

       Hotel room revenue was $45 million
        −          Occupancy was 42.6%
        −          ADR was $185
        −          RevPAR was $79

       Slot win was $51 million

       Table games drop was $335 million, while win percentage was                                                                                         Composition of Table Games Drop
        9.3%                                                                                                                              ($ in US millions)
                                                                                                                                                $600

       Recovery indicators:                                                                                                                    $500                                               $446
                                                                                                                                                                     $419
        −          Weekend slot play is approaching 2019 levels                                                                                 $400
                                                                                                                                                                                                   $173                           $335
                                                                                                                                                $300                 $229
        −          Weekend occupancy is recovering                                                                                                                                                                                $183
                                                                                                                                                $200
        −          Weekday occupancy continues to be adversely impacted by                                                                                                                         $273
                                                                                                                                                $100                 $190
                   statewide restrictions on meeting size currently in effect                                                                                                                                                     $152
                                                                                                                                                  $0
        −          Robust forward group bookings 2022-2027                                                                                                          1Q19                           1Q20                           1Q21

                                                                                                                                                                                     Non-Baccarat              Baccarat
1. The Las Vegas Operating Properties are excluded from LVS consolidated continuing operations, as they are classified as a discontinued operation held for sale.
2. On March 17, 2020, the Nevada government suspended all casino and non-essential operations, including all operations at our Las Vegas Operating Properties, beginning on March 18, 2020, through June 3, 2020. In addition, limitations on group
   meetings and capacity restrictions have been in place since the first quarter of 2020.

                                                                                                                                                                                                                                                      16
Investment Grade Balance Sheet

        As of March 31, 2021:                                                                                                                              Trailing Twelve Months Ended March 31, 2021:
         Cash Balance1 – $2.09 billion                                                                                                                     Cash Used in Operations1 – $991 million
         Liquidity2 – $6.03 billion                                                                                                                        Adjusted Property EBITDA1 – ($153) million
         Debt – $14.42 billion
         Net Debt1 – $12.33 billion

  ($ in US millions)                                                                                                 Sands China                                                        LVS Corp.       Total        Discontinued
                                                                                                                                                                                                                                  3
   Figures as of March 31, 2021                                                                                               Ltd.                        Singapore                     and Other    Consolidated     Operation
                                                              4
   Cash and Cash Equivalents                                                                                                          $951                               $347                $792         $2,090             $35
             5
   Debt                                                                                                                             7,451                              3,000                 3,968        14,419              -
   Net Debt (Cash)                                                                                                                  6,500                              2,653                 3,176        12,329             (35)
                                                                                                                                                  6
   Trailing Twelve Months Adjusted Property EBITDA                                                                                     (398)                               245                  -           (153)           (259)
   Gross Debt to TTM Adjusted Property EBITDA                                                                                              NM                            12.2x                  -               NM            NM
   Net Debt to TTM Adjusted Property EBITDA                                                                                                NM                            10.8x                  -               NM            NM

    Investment grade balance sheet provides stability during the recovery period
1. Excludes the operating results, and cash balances of the Las Vegas Operating properties, unless otherwise noted, as they are classified as a discontinued operation held for sale.
2. Denotes cash excluding Las Vegas Operating Properties (see note 3 below), plus total revolver availability.
3. Denotes Las Vegas Operating properties, classified as a discontinued operation held for sale.
4. Includes total restricted cash of $16 million.
5. Debt balances shown here are net of deferred financing costs and original issue discounts of $132 million and exclude finance leases/purchases.
6. TTM Adjusted Property EBITDA for Sands China presented here reflects Adjusted Property EBITDA from our Macao Operations.

                                                                                                                                                                                                                                      17
Debt Maturity Profile
Debt Maturity by Year
 ($ in US millions)

        $4,000

                                                                                                        $3,502
        $3,500                                                                                 $3,337

        $3,000
                                                                                               1,037
                                                                                                        1,702
        $2,500                                                       $2,365

        $2,000                                                         503          $1,889      500                     $1,900

        $1,500
                                                                                                        1,000
        $1,000                                                                                                          1,900
                                                                      1,800         1,750      1,800                             $750   $700

           $500
                                       1                                                                 800                     750    700
                                $46                     $62
               $0
                               2021                     2022          2023           2024      2025     2026     2027   2028     2029   2030
        % of
        Total                   0%                       1%             16%           13%       23%      24%      0%     13%      5%     5%
                          MBS Credit Facility           SCL Bonds   SCL Revolver   LVS Bonds

  Long dated and low cost capital structure in place; no significant maturities until 2023
1. Amount maturing April 1 through December 31, 2021.

                                                                                                                                               18
Capital Expenditures Expectations
 Future Investments Composed of Income Producing Projects in Asia and Maintenance
   ($ US in millions)

   $3,000                                                                                                                                                       LVS Capex Expectations

   $2,400                                                                 $2,180

   $1,800
                                                                            $981
                                                                                                   $1,330                                                                         $1,275
                                                                                                                                                                    $1,125
   $1,200                                          $949
                                                                                                    $140                     $980           $30 $1,050
                          $837                                              $273                    $284
                                                                                                                                            $25                                                     $750
                                                                            $211                                                                  $400                $700        $850
                          $194                     $396                                             $411                                    $75
      $600                $147                                              $240                                             $450                                                                   $325
                                                                                                                                                  $225
                                                                                                    $239
                          $477                     $450                     $450                                             $400                 $425                $425        $425              $425
                                                                                                    $231
          $0
             2017A                               2018A                    2019A                    2020A                    2021E                 2022E              2023E        2024E             2025E
 Development Timeline
 Expansion, Renovation and Rebranding of SCC to The Londoner
 Grand Suites at Four Seasons Macao
 The Londoner Court
 Marina Bay Sands Expansion Project1

     Marina Bay Sands Expansion1             Expansion, Renovation and Rebranding of SCC to The Londoner Macao                       Grand Suites at Four Seasons Macao              Pre-Opening
                                                                                                                                                                2
    The Londoner Court             The Parisian Macao           St. Regis Hotel at The Londoner Macao             Investments in Current Properties and Other       Maintenance      Post-Opening

   Capital expenditures include investments to expand and enhance our industry-leading portfolio of
   Integrated Resorts in Macao and Singapore
1. The timing and capital expenditures of the project are subject to revision based upon the impact of the COVID-19 pandemic and other factors.
2. Reflects investments that are designed to generate future income in our current property portfolio.

                                                                                                                                                                                                            19
Ongoing Strategic Expansion and Enhancement of our
 Integrated Resort Portfolio in Macao and Singapore
                                                                                                           Through               Future      Total     Expected Timeframe
The Londoner Macao:                                                                                         1Q21                 Spend       Spend

 • Creation of The Londoner Macao                                                                           ~$850M              ~$500M       ~$1.35B      • Phased Completion of Remaining Phases
                                                                                                                                                            Throughout the Balance of 2021

New Luxurious Hotel Towers in Macao:
 • Grand Suites at Four Seasons Macao Expanded suite inventory                                              ~$450M                       -   ~$450M       • Project Completed in 4Q20
   with approximately 290 new luxury suites, ranging in size from
                                                                                                                                                          • All Administrative Licenses Received
   2,000 to 4,700 SF; introduction of three luxurious gaming salons
   (~1 million SF in new suite product)

 • The Londoner Court Approximately 370 new luxury suites ranging ~$400M                                                                 -   ~$400M       • Project Completed in 1Q21
   in size from 1,400 to 3,100 SF (~1 million SF in new suite product)

  Total Macao Spend: The Londoner Macao, Londoner Court and
  Grand Suites at Four Seasons Macao                                                                         ~$1.7B              ~$0.5B      ~$2.2B

Marina Bay Sands Expansion1:
 • $3.3 billion expansion to bring new luxurious hotel, entertainment,                                       ~$1.0B               ~$2.3B     ~$3.3B       • Targeted opening in 20251
   MICE and retail offerings to Marina Bays Sands - a new luxury
   hotel tower with ~1,000 new all-suite rooms, a state-of-the-art
   arena, additional MICE capacity and new luxury retail

  Total Project Spend:                                                                                      ~$2.7B               ~$2.8B      ~$5.5B

1. The budget and timing of the MBS expansion is subject to revision based upon the impact of the COVID-19 pandemic and other factors.

                                                                                                                                                                                                    20
The Londoner Macao
Phased Opening Commenced February 8th, 2021
                                                                                                       Phase I Amenities:
                                                                                                           ─     The Londoner (all-suite hotel)
                                                                                                           ─     Crystal Palace Atrium
                                                                                                           ─     New dining, gaming and London-themed attractions
                                                                                                       Offerings in Later Phases:
                                                                                                           ─     Londoner Court (luxury residential style all-suite hotel)
                                                                                                           ─     Suites by David Beckham
                                                                                                           ─     Re-themed Shoppes at Londoner
                                                                                                           ─     Shakespeare Hall Atrium in south towers
                                                                                                           ─     The Londoner Arena
                                                                                                           ─     Big Ben and Houses of Parliament external façade
                                                                                                           ─     Additional F&B outlets and London-themed attractions

 Phase I of The Londoner Macao opened on February 8th, later phases will be introduced throughout
 2021

Note: Some of the images above denote preliminary artistic impressions which are subject to change.                                                                          21
Environmental, Social and Governance (ESG)
Industry Leading ESG Platform

    Sands is committed to being a valuable contributor to the local communities in which we operate through collaboration with
     Team Members, guests, small and medium enterprises, and community organizations

    Minimizing our environmental impact, supporting the host communities where we operate, practicing good governance and
     operating with integrity are fundamental to the way we conduct our business

    Our corporate responsibility program is structured around three pillars:
     −    People
     −    Communities
     −    Planet

    Our governance structure supports our commitment to operating our business ethically and with accountability

    We launched our inaugural ESG Report in 2020, which is available for review on our website at www.sands.com

    Sands’ ESG Report includes data disclosure in formats that conform with the reporting requirements of the Global Reporting
     Initiative (GRI) and the Sustainability Accounting Standards Board (SASB)

Sands is deeply committed to our ESG platform; our inaugural ESG Report was published in 2020
and provides detail on the key components of our program and our ESG performance data
                                                                                                                                  22
Sustainability Awards and Certifications
Recognized by Independent Third Parties as a Global Leader in Sustainability
                                                                                                                 Highlights:
                                                                                                                      Sands is the only U.S. based Casino and Gaming company to
                                                                                                                       be named to the Dow Jones Sustainability World Index 2020
                                                                                                                       and North America Index 2020
                                                                                                                      Sands is one of only 16 companies in North America to be
                                                                                                                       included on the A List for both CDP Climate Change and Water
                                                                                                                       Security in 2020
                                                                                                                      LVS was named to Fortune’s listing of the “Most Admired
                                                                                                                       Companies” globally for the fourth consecutive year in 2020

Las Vegas Sands                                 United States                                     Macao                                         Singapore
Dow Jones Sustainability Index, North America   Better Buildings Challenge                        LEED Silver for Building Design and           LEED Platinum for Building Operations and
(2015, 2016, 2018, 2019, 2020)                  The Venetian Resort Las Vegas                     Construction                                  Maintenance
Dow Jones Sustainability Index, World           APEX/ASTM Level Two                               The Parisian Macao                            Sands Expo and Convention Center at Marina
                                                Sands Expo and Congress Center at The                                                           Bay Sands
(2020)                                                                                            FTSE4Good
                                                Venetian Resort Las Vegas                         (2018, 2019)                                  LEED Gold for Building Operations and
FTSE4Good
                                                LEED Silver for New Construction                                                                Maintenance
(2019)                                                                                            Macao Green Hotel Awards
                                                The Palazzo                                                                                     ArtScience Museum at Marina Bay Sands
CDP Climate A List                                                                                Platinum – The Venetian Macao
                                                                                  VERIFIED

                                                LEED Gold for Building Operations and             Gold – The Londoner Macao, Parisian Macao,    Singapore BCA Green Mark Platinum
(2015, 2016, 2017, 2018, 2019, 2020)
                                                                                             TM

                                                Maintenance                                       Four Seasons Macao                            Marina Bay Sands (2020)
CDP Water A List                                                                                  Silver – Sands Macao
                                                Sands Expo and Congress Center at The                                                           APEX/ASTM Level One
(2018, 2019, 2020)                              Venetian Resort Las Vegas                         ISO 20121 / ISO 9001                          Marina Bay Sands
Fortune’s Most Admired Companies                Trip Advisor: Green Leader Gold                   The Venetian Macao, The Parisian Macao
                                                                                                                                                ISO 20121
(2015, 2017, 2018, 2019, 2020)                  Certification                                     IMEX / GMIC Green Supplier Award              Marina Bay Sands
                                                The Venetian Resort Las Vegas                     The Venetian Macao                            IMEX / GMIC Green Supplier Award
                                                                                                                                                Marina Bay Sands

                                                                                                                                                                                             23
Disciplined Execution of Our Global Growth Strategy
Focused on the Most Promising Global Development Opportunities

    Uniquely positioned to bring our unmatched track record and powerful convention-based business model to the world’s most
     promising Integrated Resort development opportunities

    Balance sheet strength designed to support future large-scale development projects

    Development opportunity objectives:

    −     Target minimum of 20% return on total invested capital

    −     25% - 35% of total project costs to be funded with equity (project financing to fund 65% - 75% of total project costs)

    Principal Areas of Future Development Interest:

                    Macao                                            Singapore                                         South Korea

                                                                                                                                     24
Appendices
$11.0 Billion of LVS and SCL Bonds Have No Financial Covenants
Investment Grade Long-term Debt

          Investment Grade Long-term Debt – No Financial Covenants for LVS and SCL Bonds

                                                                                         Outstanding                                                        Financial Covenants

             Las Vegas Sands
               Corp. Senior                                                             US$4.0 Billion                                                             None
             Unsecured Notes

             Sands China Ltd.
             Senior Unsecured                                                           US$7.0 Billion                                                             None
                  Notes

            Marina Bay Sands
             Secured Credit                                                             US$3.0 Billion                                                 Waived Until January 20221
                 Facility

                        Total                                                          US$14.0 Billion                                                               -

1. On June 18, 2020 Marina Bay Sands received a waiver letter from its lenders, exempting it from the facility’s leverage and interest covenants through 4Q21.

                                                                                                                                                                                    26
Revolver Commitments and Financial Covenants

                                                                         Current Revolver
                                                                                                                                          Leverage Covenant                                                   Interest Covenant
                                                                           Availability1

                 Las Vegas
                                                                                                                                                  Waived
                Sands Corp.                                               US$1,499 Million                                                                                                                                    -
                                                                                                                                           Until January 20223
             Unsecured Revolver2

               Sands China Ltd.                                                                                                                   Waived                                                            Waived
              Unsecured Revolver                                          US$2,002 Million                                                 Until January 20224                                               Until January 20224

                Marina Bay Sands                                                                                                                  Waived                                                            Waived
                Secured Revolver                                           US$440 Million                                                  Until January 20225                                               Until January 20225

                            Total                                         US$3,941 Million                                                                  -                                                                  -

1. Reflects availability as of March 31, 2021. Availability of revolving credit facilities is reduced by borrowings, outstanding letters of credit and bank guarantees. Revolver commitments are as follows, SCL: $2,505 million, MBS: $556 million, LVSC: $1,500
   million. On January 25, 2021 Sands China raised an incremental $494 million in commitments under its existing unsecured revolving credit facility. As of March 31, 2021, the SCL Revolver had a balance of $503 million, and the other revolvers were not drawn.
2. The LVSC Revolving Credit Facility contains a covenant that prohibits the disposition of Core Facilities, which includes the Las Vegas Operations. The Company is evaluating the treatment of the LVSC Revolving Credit Facility in connection with the
    announced sale of the Las Vegas Operations, which may include an amendment or termination of the existing facility on or prior to the closing date of the sale.
3. On September 23, 2020 Las Vegas Sands received a waiver letter from its lenders, exempting it from the facility’s leverage covenant through 4Q21. Upon expiry of the waiver letter, the leverage covenant will return to 4.0x. Las Vegas
   Sands Corp. unsecured revolver covenant is a net debt covenant capped at a $1,000 million deduction of cash; covenant EBITDA includes royalty-related revenue and applicable dividends from SCL and MBS as well as various
   other adjustments allowable under the US credit agreement; covenant debt includes LVSC notes; revolving credit facility is not subject to an interest covenant. During the waiver period, LVS must maintain minimum liquidity of $350 million at its
   US entities. Liquidity is defined as cash plus revolver availability. During the waiver period, LVS is only permitted to pay dividends if liquidity would be $1,000 million after taking into account the dividend payment.
4. On September 11, 2020 Sands China received a second waiver letter from its lenders, exempting it from the facility’s leverage and interest covenants through 4Q21 and permitted SCL to raise up to $1,000 million in incremental revolver
   commitments. As a result of the incremental revolver commitments raised on January 25, 2021, if leverage exceeds 4.0x during the waiver period, SCL will only be permitted to pay dividends if liquidity is greater than $2,000 million after taking into
   account the payment of the dividend. Liquidity is defined as cash plus revolver availability. Upon expiry of the waiver letter, the leverage covenant will return to 4.0x and the interest coverage covenant will return to 2.5x. Sands China unsecured
   revolver covenant is a gross debt covenant; covenant debt includes SCL notes.
5. On June 18, 2020 Marina Bay Sands received a waiver letter from its lenders, exempting it from the facility’s leverage and interest covenants through 4Q21. Upon expiry of the waiver letter, the leverage covenant will return to 4.5x and the interest
   coverage covenant will return to 3.5x. Marina Bay Sands Credit Facility covenant is a gross debt covenant; covenant debt includes debt drawn under the MBS Credit Facilities; 4.5x represents leverage test applicable prior to the one-year
   anniversary of MBS receiving a temporary occupancy permit for the MBS expansion. Following the one-year anniversary of receiving a temporary occupancy permit for the MBS expansion, maximum leverage covenant level becomes 4.0x.

                                                                                                                                                                                                                                                                      27
Sources of EBITDA
EBITDA Contribution by Geography in Fiscal Year Ended December 31, 2019
 ($ in US millions)

                                                                                LVS 2019 Adjusted Property EBITDA1

                                                                                                                     $4,850

                                                                                              Singapore
                                                                $1,661
                                                                                                 34%
                                                                                                                                            Macao
                                                                                                                                             66%                       $3,189

1. Excludes the results of the Las Vegas Operating Properties, as they are classified as a discontinued operation held for sale, as well as the results of Sands Bethlehem which was sold on May 31, 2019; the Macao region includes adjusted
   property EBITDA from The Venetian Macao, The Londoner Macao, The Parisian Macao, The Plaza Macao and Four Seasons Macao, Sands Macao and Ferry Operations and Other; the Singapore region includes adjusted property
   EBITDA from Marina Bay Sands.

                                                                                                                                                                                                                                                28
Retail Mall Portfolio in Asia

                                                                             Trailing Twelve Months Retail Mall Revenue
     ($ in US millions)
                $800

                $700                        $657 1

                $600                                                                                                                                                                                                          TTM 1Q21 Sales
                                            $184                                    $5331                                                                                                                                     per Sq. Foot²
                $500
                                                                                                                            $4411                                                                            $4331
                                             $47                                    $145
                                                                                                                                                                             1                                                MBS
                $400                                                                                                                                                 $380
                                             $63                                                                                                                                                                              $1,048
                                                                                     $37                                    $127                                                                             $117
                                                                                                                                                                                                                              Parisian Macao
                                                                                     $54                                                                             $112                                                     $422
                $300                        $137                                                                                         $30                                                                  $31
                                                                                                                             $44                                                  $27                         $42             Londoner Macao
                                                                                    $115                                                                              $37                                                     $576
                $200                                                                                                         $96                                                                             $101             Four Seasons
                                                                                                                                                                      $79
                                                                                                                                                                                                                              Luxury: $5,150
                $100                        $226                                                                                                                                                                              Other: $1,632
                                                                                    $182
                                                                                                                            $144                                    $125                                     $142             Venetian Macao
                                                                                                                                                                                                                              $940
                    $0
                                           1Q20                                    2Q20                                    3Q20                                     4Q20                                    1Q21
     Operating
                                          $578M                                   $462M                                   $377M                                     $323M                                  $378M
          Profit
Operating Profit
        Margin                             88%                                        87%                                     85%                                       85%                                    87%
                                  The Venetian Macao            Four Seasons Macao             The Londoner Macao3           The Parisian Macao            Marina Bay Sands

    1. Results include $59 million, $111 million, $76 million, $24 million and $20 million of rent concessions provided to tenants in 1Q20, 2Q20, 3Q20, 4Q20 and 1Q21, respectively.
    2. Tenant sales per square foot is the sum of reported comparable sales for the trailing 12 months divided by the comparable square footage for the same period. Only tenants that have occupied mall space for a minimum of 12 months are included
       in the tenant sales per square foot calculation.
    3. At March 31, 2021, approximately 418,000 square feet of gross leasable area was occupied out of a total of up to approximately 600,000 square feet of retail mall space that will be featured at completion of all phases of The Londoner Macao.

                                                                                                                                                                                                                                                          29
Retail Mall Portfolio in Asia
Tenant Sales

($ per Sq. Foot, Unless Otherwise Indicated)                                                                                                                                                     2
                                                                                   1Q21                                                                                     Sales per Sq. Ft.
                                                                     GLA1             Occupancy % at
                                                                    (Sq. Ft)            Period End                      TTM 1Q21                     TTM 4Q20                    TTM 3Q20            TTM 2Q20   TTM 1Q20
 The Shoppes at Marina Bay Sands                                    620,297                      98.9%                    $1,048                      $1,053                       $1,225            $1,500     $1,917

 Shoppes at Venetian                                                812,936                      79.9%                      $940                         $794                        $935            $1,224     $1,460
 Shoppes at Four Seasons
      Luxury Retail                                                 125,466                    100.0%                     $5,150                      $3,750                       $3,665            $4,756     $6,033
      Other Stores                                                  118,638                      87.7%                    $1,632                      $1,245                       $1,354            $1,924     $2,481
 Shoppes at Londoner                                                515,958                      81.0%                      $576                         $409                        $476              $603       $780
 Shoppes at Parisian                                                296,145                      79.8%                      $422                         $349                        $407              $561       $687

    Encouraging retail recovery is underway at Sands China and Marina Bay Sands, led by luxury retail

1. Denotes gross leasable area.
2. Tenant sales per square foot reflect sales from tenants only after the tenant has been open for a period of 12 months.
Note: Visitation to our malls was negatively impacted in 2020 by the COVID-19 pandemic and related travel restrictions, which have meaningfully impacted visitation to our property portfolio.
.
                                                                                                                                                                                                                           30
Market Leading Hotel Capacity
SCL is the Leader in Macao Hotel Room and Suite Inventory

                                Projected Macao Market 4/5 Star Hotel Rooms at December 31, 20201 – Gaming Operators

                     Cotai ~ 25,000 Rooms by Gaming Operators                                                 Total Macao ~ 28,500 Rooms by Gaming Operators
                         MGM                                                           12,112 Rooms and            MGM                            12,401 Rooms and
                         China                                                           Suites at SCL             China                            Suites at SCL
   Wynn                   6%                                                                              Wynn      7%
   Macau                                                                                                  Macau
    6%                                                                                                     9%

                                   SJM
                                    8%                                                                            SJM
                                                                                    Sands                                                    Sands
                                                                                                                  10%
                                                                                    China                                                    China
                         Melco
                                                                                     49%                                                      44%
                          15%
                                                                                                                     Melco
                                                                                                                      14%

                                          Galaxy                                                                                 Galaxy
                                           16%                                                                                    16%

  With a market-leading ~US$15 billion of investment, SCL hotel inventory represents ~44% of gaming
  operator hotel rooms and ~49% of hotel rooms on Cotai

1. See slide 41 titled ‘Market-Leading Hotel Capacity at SCL’ for further detail.
Source: Public company filings, Macao DSEC, Macao Tourism Board.

                                                                                                                                                                     31
Sands China Market Leadership
Continued Expansion of Market-Leading Cotai Strip Property Portfolio
                        LVS’ Cotai Strip Properties                                                      Leadership in Macao
                                                                            Investment
 Grand Suites at Four
   Seasons Macao                                                                    ~$15 billion
 ~290 Suites (Opened                                                                Approximately 30 million square feet of interconnected facilities on Cotai
    October 2020)

                                                        St. Regis Hotel
                                                                            Hotel Inventory
 The Venetian Macao
    2,905 Suites
                                                          400 Suites                ~12,000 rooms and luxury suites
                                                       The Londoner Court           ~49% of hotel inventory on Cotai
                                                           ~370 Suites
                                               C      (Completed February   Retail
                                                              2021)
                                               O                                    ~1.9 million square feet of gross leasable retail
                                               T               Conrad               Revenue of $316 million as of TTM March 31, 2021
                                                             659 Rooms
                                               A              & Suites      Entertainment
                                               I                                    The Macao leader in entertainment – more seats, shows and venues than any
                                                              Londoner
 Four Seasons
                                                                 Hotel               other operator
    Macao
                                                              600 Suites
  360 Suites
                                                               (Opened
                                                                                    The Cotai Arena is the largest, most important entertainment venue in Macao,
                                               S               January               featuring 15,000 seats
    Paiza                                                        2021)
  Mansions
                                               T                            MICE
  19 Suites
                                               R               Sheraton
                                                                                    The Macao leader in convention and group meetings
                                                             3,968 Rooms
                                               I               & Suites             ~80% of all MICE square footage in Macao is owned and operated by Sands
                                               P                                     China
                                                                            Expansion and Reinvestment
                                                                                    ~290 new suites in the Grand Suites at Four Seasons Macao opened October
 The Parisian Macao                                    Tropical Gardens              2020 (~1 million SF in new suite product)
   2,541 Rooms &
       Suites                                                                       ~370 new suites in The Londoner Court completed February 2021 (~1 million
                                                                                     SF in new suite product)
                                                                                    The re-themed Londoner Macao introduces a third European-themed iconic
                                                                                     destination resort on Cotai with additional MICE, retail, entertainment and
                                                                                     luxurious suite offerings throughout 2021
   New Luxury Suites        Suite Conversion

                                                                                                                                                                    32
Marina Bay Sands Expansion
Marina Bay Sands, Singapore
Maximize Economic Growth and Leisure & Business Tourism Appeal in Singapore

                                                                                               Contribution to Singapore’s Leisure & Business Tourism Appeal

    MBS Existing                                                                           Contributed to economic growth and to Singapore’s appeal as an exciting
                                                                                              global city
                                                                                             Delivered iconic architecture to Singapore’s CBD area
                                                                                             MBS is central to the MICE business in Singapore with record 2019 MICE
                                                                                              revenues. MBS hosted more than 3,000 events in 2019
                                                                                             Created thousands of jobs for Singaporeans (MBS employed >10,000
                                                                                              FTE’s in 2020)
                                                                                             Procurement and sourcing focused on Singapore-based SME’s

    MBS Expansion                                                                          Further enhance MBS’ status as an iconic architectural landmark
                                                                                           Provide suite product that is unparalleled in South East Asia
                                                                                           Introduce a ‘state-of-the-art’ theater designed for live musical
                                                                                              performances that can attract the highest-caliber global entertainment
                                                                                              events and artists to Singapore
                                                                                             Extend the success of Singapore as a MICE destination
                                                                                             Ensure MBS is positioned to grow its economic, employment and
                                                                                              visitation contributions to Singapore in the years ahead
Note: Images above denote preliminary artistic impressions which are subject to change.

                                                                                                                                                                       34
Marina Bay Sands $3.3 Billion Expansion to Bring New
Luxurious Hotel, Entertainment, MICE and Retail Offerings

  Las Vegas Sands has entered into a development agreement with the Singapore government to expand Marina Bay Sands
           Iconic New Luxury Hotel Tower:
            −        Approximately 1,000 all-suite rooms designed to set a new standard of luxury in the region
            −        Sky roof with a swimming pool and other tourism attractions
           State-of-the-art arena designed specifically for live musical performances; Seating for at least 15,000
           Additional MICE capacity (meeting and function rooms, exhibition halls)
           Luxury retail

Note: Images above denote preliminary artistic impressions which are subject to change. Timing, costs and final programming are subject to change based on the impact of Covid-19 and other factors.

                                                                                                                                                                                                       35
Marina Bay Sands Expansion

A Development Agreement with the Singapore Tourism Board will allow an expansion of Marina Bay
Sands

                                                                                                 36
Marina Bay Sands Expansion
Artistic Impression

  Design and development work are progressing, with a focus on increasing the leisure and business tourism
  appeal of Singapore and Marina Bay Sands
Note: Image above denotes preliminary artistic impression which is subject to change.

                                                                                                             37
Macao Market Background
and Infrastructure Slides
Market-Leading ~$15 Billion of Investment
Investing in Macao’s Future as a Leisure & Business Tourism Destination

   Industry-leading Integrated Resort portfolio

          •    Portfolio of ~12,400 suites and hotel rooms

          •    ~2 million square feet of new luxurious hotel suite inventory introduced in 2020 and early 2021

   Additional entertainment and tourism offerings of The Londoner Macao will be introduced throughout 2021

   Conference, exhibition and carpeted meeting space: ~2 million sq. feet

   World-class entertainment and events

   World class shopping: ~ 1.9 million sq. feet

Our diversified convention-based Integrated Resort offerings coupled with industry-leading branding
and service levels appeal to the broadest set of customers and provide a competitive advantage in
the Macao market

                                                                                                                 39
Macao’s Long-Term Growth Opportunity
Business & Leisure Tourism Drivers

Future growth drivers                   As a result, Macao’s visitors will
 More efficient and affordable          Come from further away
  transportation infrastructure
 Greater number of hotel rooms,
                                         Stay longer
  MICE and non-gaming offerings in
  Macao
 Additional tourism attractions and     Spend more on
  amenities in Macao and Hengqin
  Island
                                            −   Lodging
                                            −   MICE Events
 Rapidly expanding middle-class with       −   Retail
  growing disposable income and             −   Dining
  demand for tourism and travel             −   Entertainment
  experiences

                                                                             40
Market Leading Hotel Capacity at SCL
Macao Market 4/5 Star Hotel Rooms at December 31, 2020
                                                                                                                                                                   Cotai                                        Total Market
                                                                   New Capacity                                                                                            % of Gaming                            % of Gaming     % of Total
                                                                                                   Gaming Operator                                  Rooms                   Operators            Rooms             Operators        Market
      16,000
                                                                                                   Sands China                                           12,112               49%                     12,401          44%               33%

                                                                                                   Galaxy Entertainment                                   3,920               16%                      4,420          16%               12%
      14,000                                                                                       Melco                                                  3,772               15%                      3,987          14%               11%
                               12,401
                                                                                                   SJM Holdings2                                          2,000                8%                      2,839          10%               7%
      12,000                  The Parisian                                                         Wynn Macau Ltd.                                        1,706                6%                      2,714          9%                7%
                                Macao
                                                                                                   MGM China                                              1,400                6%                      1,982          7%                5%
                                 2,541                         Sands Macao, 289
      10,000                                                                                           Subtotal Gaming Operators                         24,910               100%                    28,343         100%               75%
                                                               Grand Suites at Four
                                                               Seasons Macao, 290                  Other 4/5 Star 1                                            -                     -                 9,234          0%                25%
        8,000                     The                          Four Seasons Macao, 379             Total                                                 24,910               100%                    37,577         100%           100%
                            Venetian Macao
                                2,905                                                          Starworld, 500
                                                                                                                                   City of Dreams Morpheus Tower, 772
        6,000                                                                                  Broadway Macau, 320                                                                                                   MGM Cotai, 1,400
                                                                    4,420                                                          Altira Macau, 215                       Sofitel Macau, 408
                             The Londoner                                                              3,987
        4,000               Macao (Conrad,
                             The Londoner                                                                                                   2,839                                   2,714
                            Court, Londoner
                            Hotel, St. Regis                                                       Macau Studio City
                                                                                                                                                                                                                  1,982
        2,000                                                   Galaxy   Macau3                                                            SJM Cotai                           Wynn Palace
                            Hotel, Sheraton)                                                            1,600
                                                                    3,600                                                                    2,000                               1,706                           MGM Cotai
                                 5,997
                                                                                                     City of Dreams                                                                                                1,400
                                                                                                          1,400                                                             Wynn Macau, 1,008                  MGM Grand, 582
              0                                                                                                                       Grand Lisboa, 431
                                                                                                                                                           2
                            Sands China                   Galaxy Entertainment                             Melco                       SJM Holdings                         Wynn Macau Ltd.                     MGM China

  With a market-leading ~US$15 billion of investment, SCL hotel inventory represents ~49% of hotel
  rooms on Cotai
1. In addition to the hotel rooms that are owned by gaming operators, there are approximately 9,234 additional four- and five-star hotel rooms owned by non-gaming operators in Macao at December 31, 2020.
2. Reflects only SJM Holdings owned hotels. SJM Cotai is expected to open in the summer of 2021.
3. Reflects the opening of Galaxy Phase I and Phase II.
Source: Public company filings, Macao DSEC, Macao Tourism Board.

                                                                                                                                                                                                                                               41
Supplemental Data
Historical Hold-Normalized Adjusted Property EBITDA1
($ in US millions)
                                                                  1Q19                 2Q19                  3Q19                  4Q19                  1Q20                 2Q20                  3Q20                 4Q20                    1Q21
                          2
Macao Operations
      Reported                                                    $858                  $765                  $755                 $811                    $67                ($312)                ($233)                  $47                   $100
      Hold-Normalized                                             $845                  $765                  $757                 $789                    $84                ($285)                ($240)                  $70                    $75

Marina Bay Sands
      Reported                                                    $423                  $346                  $435                 $457                  $282                 ($113)                  $70                  $144                   $144
      Hold-Normalized                                             $433                  $392                  $396                 $417                  $270                 ($112)                  $59                  $146                   $116

                          3
Sands Bethlehem
      Reported                                                      $33                   $19                      -                     -                     -                     -                    -                     -                         -
      Hold-Normalized                                               $33                   $19                      -                     -                     -                     -                    -                     -                         -

                          4
LVS Consolidated
      Reported                                                  $1,314               $1,130                $1,190                $1,268                  $349                 ($425)                ($163)                 $191                   $244
      Hold-Normalized                                           $1,311               $1,176                $1,153                $1,206                  $354                 ($397)                ($181)                 $216                   $191

Las Vegas Operations
      Reported                                                    $138                  $136                   $93                 $120                    $88                ($122)                 ($40)                 ($50)                  ($47)
      Hold-Normalized                                             $131                  $146                  $106                 $120                    $88                ($117)                   ($3)                ($31)                  ($22)
1. This schedule presents hold-normalized adjusted property EBITDA based on the following methodology:
    - for Macao operations and Marina Bay Sands: if the quarter’s rolling win percentage is outside of the 3.15%-3.45% range, then a hold adjustment is calculated by applying a rolling win percentage of 3.30% to the rolling volume for the quarter.
    - for Las Vegas Operations: if the quarter’s baccarat win percentage is outside of the 18.0%-26.0% range, then a hold adjustment is calculated by applying a baccarat win percentage of 22.0%, and if the quarter’s non-baccarat win
      percentage is outside of the 16.0%-24.0% range, then a hold adjustment is calculated by applying a non-baccarat win percentage of 20.0%.
    - for Sands Bethlehem: no hold adjustment was made.
    - for all properties: gaming taxes, commissions paid, bad debt expense, discounts and other incentives are applied to determine the hold-normalized adjusted property EBITDA impact.
2. Adjusted property EBITDA presented here reflects adjusted property EBITDA from The Venetian Macao, The Londoner Macao, The Parisian Macao, The Plaza Macao and Four Seasons Macao, Sands Macao and Ferry Operations and Other.
3. The company completed the sale of Sands Bethlehem on May 31, 2019. Results of operations include Sands Bethlehem through May 30, 2019.
4. The Las Vegas Operating Properties are excluded from certain LVS consolidated continuing operations, as they are classified as a discontinued operation held for sale.

                                                                                                                                                                                                                                                              43
Macao Market: Mass Gaming Revenue

                                                                                      Macao Market Mass Gaming Revenue
                                            ($ in US millions)                                                                                                                  1
                                                                                                                             Mass Win (Tables and Slots)
                                                                                                     Q1                      Q2                      Q3                     Q4                   Total
                                            2018                                                 $4,955                  $4,841                  $4,864                 $5,251                $19,911
                                            Growth ('18 v '17)                                    19.5%                   20.5%                   16.7%                   11.6%                  16.9%

                                            2019                                                 $5,440                  $5,356                  $5,523                 $5,608                $21,927
                                            Growth ('19 v '18)                                     9.8%                   10.6%                   13.5%                    6.8%                  10.1%

                                            2020 2                                               $2,180                   $212                    $363                  $2,049                 $4,804

                                            Growth ('20 v '19)                                   -59.9%                  -96.0%                  -93.4%                  -63.5%                 -78.1%
                                                                                                             3
                                            2021                                                 $2,067
                                            Growth ('21 v '20)                                     -5.2%

                                            Growth ('21 v '19)                                   -62.0%

    The recovery in Macao market-wide mass GGR in 1Q21 reached 38% of 1Q19 levels

1. Market-wide mass GGR for all periods through 4Q20 is defined as mass win (tables and slots) as reported by the casino operators in their public filings (does not include revenue from Galaxy’s City Clubs business). All figures reported in Hong Kong
   dollars have been converted to USD using a 7.75 exchange rate.
2. The COVID-19 pandemic and related travel restrictions began to impact our operations in Macao during the first quarter of 2020.
3. Market-wide mass GGR for 1Q21 is estimated by LVS management based on DICJ reported data and LVS management’s estimated differences between DICJ reporting and win reported by operators in public filings.
Source: Public company filings, Macao DICJ.

                                                                                                                                                                                                                                                             44
Macao Market: VIP Gaming

                                                                                       Macao Market VIP Gaming Revenue
                                            ($ in US millions)
                                                                                                                                               VIP Win1
                                                                                                    Q1                      Q2                      Q3                     Q4                   Total
                                            2018                                                $4,429                  $4,208                  $4,288                 $4,412                $17,337
                                            Growth ('18 v '17)                                    21.0%                  12.7%                    4.6%                    2.8%                  9.8%

                                            2019                                                $3,892                  $3,640                  $3,173                 $3,301                $14,006
                                            Growth ('19 v '18)                                   -12.1%                 -13.5%                  -26.0%                  -25.2%                 -19.2%
                                                     2
                                            2020                                                $1,494                    $172                   $245                    $662                 $2,573
                                            Growth ('20 v '19)                                   -61.6%                 -95.3%                  -92.3%                  -79.9%                 -81.6%
                                                                                                          3
                                            2021                                                  $869
                                            Growth ('21 v '20)                                   -41.8%

                                            Growth ('21 v '19)                                   -77.7%

1. Market-wide VIP GGR for all periods through 4Q20 as reported by the casino operators in their public filings (does not include revenue from Galaxy’s City Clubs business). All figures reported in Hong Kong dollars have been converted to USD using
   a 7.75 exchange rate.
2. The COVID-19 pandemic and related travel restrictions began to impact our operations in Macao during the first quarter of 2020.
3. Market-wide VIP GGR for 1Q21 is estimated by LVS management based on DICJ reported data and LVS management’s estimated differences between DICJ reporting and win reported by operators in public filings.
Source: Public company filings, Macao DICJ.

                                                                                                                                                                                                                                                           45
Sands China VIP Table Update

                            SCL Rolling Volume by Quarter                                                                                                 SCL Rolling Win by Quarter
   ($ in US billions)                                                                                                         ($ in US millions, except per table amounts)

                                                                                                                                                  Avg. Win per Table
                                                                                                                                                   per Day: $27,904
      $20                                                                                                                         $700
                    $19.1                                                                                                                       $663
                                                                                                                                  $600
                                                                                                                                                                                                Avg. Win per Table
                                                                                                                                                                                                 per Day: $10,346
      $15                                                                                                                         $500

                                                                          ~20% of                                                 $400                                               ~27% of
                                                                           1Q19                                                                                                       1Q19
      $10                                                                                                                         $300
                                                                           Level                                                                                                      Level
                                                                                                                                  $200
                                     $6.5                                                                                                                      $194                                       $176
         $5                                                                                                                       $100                                               $43
                                                                                                                                                                             -$8
                                                                                                     $3.8                                                                                      $57
                                                                                     $3.3                                             $0
                                                     $1.3            $1.0
         $0                                                                                                                      -$100
                                             1                                                                                                                         1
                    1Q19            1Q20            2Q20            3Q20            4Q20            1Q21                                       1Q19           1Q20           2Q20   3Q20    4Q20         1Q21
  Avg.                                                                                                                         Rolling
Tables
                    264               196            213              210            168              189                      Win %           3.48%          3.00% -0.59%          4.06%   1.72%       4.66%

   Sands China rolling volume in 1Q21 reached approximately 20% of the level achieved in 1Q19

 1. On February 4, 2020, the Macao government announced the suspension of all casino operations for from February 5 to February 19, 2020.

                                                                                                                                                                                                                     46
Reconciliation of Non-GAAP Measures
   and Other Financial Information
Reconciliation of Net Income (Loss) to Consolidated
Adjusted Property EBITDA1

($ in US millions)

                                                                    1Q19            2Q19            3Q19            4Q19               2019           1Q20             2Q20            3Q20            4Q20              2020          1Q21
Net income (loss)                                                   $700          $1,251            $650            $736            $3,337             ($92)          ($841)          ($664)          ($303)         ($1,900)          ($280)
 Add (deduct):
  Income tax expense (benefit)                                        74             257              84              71               486              22              (31)              5              28               24             14
  Loss on modification or early retirement of debt                     -               -               2               -                 2               -                -               -               -                -              -
  Other (income) expense                                              20            (242)              7             (64)             (279)            (39)               5               5              10              (19)            17
  Interest expense, net of amounts capitalized                        98             100             121             130               449             128              114             134             147              523            154
  Interest income                                                    (20)            (17)            (20)            (17)              (74)            (13)              (4)             (3)             (1)             (21)            (1)
  Gain on sale of Sands Bethlehem                                      -            (556)              -               -              (556)              -                -               -               -                -              -
  Loss on disposal or impairment of assets                             3               -              10              68                81               3                4              55              11               73              3
  Amortization of leasehold interests in land                          9              14              14              14                51              14               13              14              14               55             14
  Depreciation and amortization                                      266             254             247             253             1,020             253              244             248             252              997            255
  Development expense                                                  5               4               4              11                24               6                9               3               -               18              9
  Pre-opening expense                                                  4              10               9              11                34               5                4               5               5               19              5
  Stock-based compensation                                             3               4               3               4                14               3                5               2               5               15              5
  Corporate expense                                                  152              51              59              51               313              59               53              33              23              168             49
Consolidated Adjusted Property EBITDA                             $1,314          $1,130          $1,190          $1,268            $4,902            $349            ($425)          ($163)           $191             ($48)          $244

Less: Sands Bethlehem Adjusted Property EBIT DA2                      (33)            (19)               -               -              (52)               -               -                -               -                -             -

Revised Adjusted Property EBITDA                                  $1,281          $1,111          $1,190          $1,268            $4,850            $349            ($425)          ($163)           $191             ($48)          $244

1. Excludes the results of the Las Vegas Operating Properties, as they are classified as a discontinued operation held for sale.
2. The operations of Sands Bethlehem, sold in May 2019, were excluded from the Company’s 1Q19 consolidated results for purposes of presenting information from continuing operations comparable to those presented in 1Q20 and 1Q21.

                                                                                                                                                                                                                                                48
Non-GAAP Measures: Adjusted Net Income (Loss); Hold-
Normalized Adjusted Net Income (Loss)

              ($ in US millions)                                                                                                                                              Three Months Ended
                                                                                                                                                                                   March 31,
                                                                                                                                                                  2021                    2020                    2019
               Net income (loss) attributable to LVS                                                                                                                ($278)                     ($1)                  $582
                 Nonrecurring legal settlement                                                                                                                          -                        -                     96
                 Pre-opening expense                                                                                                                                    5                        5                      4
                 Development expense                                                                                                                                    9                        6                      5
                 Loss on disposal or impairment of assets                                                                                                               3                        3                      3
                 Other (income) expense                                                                                                                                17                      (39)                    20
                 (Income) loss from discontinued operations, net of income taxes                                                                                       62                      (41)                   (44)
                 Income tax impact on net income adjustments1                                                                                                          (2)                      (1)                    (1)
                 Noncontrolling interest impact on net income adjustments                                                                                              (8)                       3                     (4)
               Adjusted net income (loss) from continuing operations attributable to LVS                                                                            ($192)                    ($65)                  $661
                 Less: Income from Sands Bethlehem, net of income taxes2                                                                                                -                        -                    (22)
               Revised adjusted net income (loss) from continuing operations attributable to LVS                                                                    ($192)                    ($65)                  $639

                 Hold-normalized casino revenue                                                                                                                       (80)                      10                    (15)
                 Hold-normalized casino expense                                                                                                                        27                       (5)                    12
                 Income tax impact on hold adjustments1                                                                                                                 5                        2                     (2)
                 Noncontrolling interest impact on hold adjustments                                                                                                     8                       (5)                     4
               Hold-normalized adjusted net income (loss) from continuing operations attributable to LVS                                                            ($232)                    ($63)                  $638

1. The income tax impact for each adjustment is derived by applying the effective tax rate, including current and deferred income tax expense, based upon the jurisdiction and the nature of the adjustment.
2. The operations of Sands Bethlehem, sold in May 2019, were excluded from the Company’s 1Q19 consolidated results for purposes of presenting information from continuing operations comparable to those presented in 1Q20 and 1Q21.

                                                                                                                                                                                                                                       49
You can also read