COMMERCIAL REAL ESTATE OUTLOOK: 2019.Q1 - National Association of REALTORS - National ...
←
→
Page content transcription
If your browser does not render page correctly, please read the page content below

National Association of REALTORS®

COMMERCIAL REAL ESTATE
   OUTLOOK: 2019.Q1

Commercial Real Estate Outlook: 2019.Q1

Download: www.nar.realtor/reports/commercial-real-estate-outlook

©2019 National Association of REALTORS®
All Rights Reserved.

May not be reprinted in whole or in part without permission of the National Association of
REALTORS®.
For reprint information, contact data@realtors.org.

COMMERCIAL REAL ESTATE

                                        OUTLOOK

NATIONAL ASSOCIATION OF REALTORS®
2019 LEADERSHIP TEAM

JOHN SMABY, CRB, GRI
President

VINCE MALTA
President-Elect

CHARLIE OPPLER
First Vice President

JOHN FLOR, ABR, CRS, GRI, EPRO
Treasurer

ELIZABETH MENDENHALL, ABR, ABRM,
CIPS, CRB, GRI, PMN, EPRO
2018 President

BRIAN COPELAND, CIPS, CRS, GRI, EPRO
Vice President of Association Affairs

TRACY KASPER, CRS, GRI, SFR
Vice President of Advocacy

BOB GOLDBERG
Chief Executive Officer
COMMERCIAL REAL ESTATE

                                             OUTLOOK

CONTENTS

1 | Economic Overview…………………………………………………………………………………                      5

2 | Commercial Real Estate Investments……………………………………………………..              9

3 | Commercial Real Estate Fundamentals……………………………………………………               13

4 | Market Highlight: Retail Trade Challenges and Opportunities………………….   15

5 | Outlook……………………….…………………………………………………………………………..                       18
COMMERCIAL REAL ESTATE
OUTLOOK
GEORGE RATIU
Gross Domestic Product Director, Housing & Commercial Research
gratiu@realtors.org
The economy expanded at a stronger pace of 2.9
percent in 2018 from 2.2 percent in 2017 as GAY CORORATON
expenditures for private consumption, investment Research Economist
spending, net exports, and government spending all scororaton@realtors.org
rose at a faster pace. However, growth slowed to 2.6
percent in the fourth quarter on account of a slower Business investments increased for all categories.
expansion in personal consumption spending. Spending on structures rose at a 5.0 percent rate,
as spending increased equipment by 7.5 percent,
Exhibit 1.1: Real GDP (Percent Change and investments in intellectual property products
6 Annual Rate) advanced at 7.7 percent.
5
4 Exhibit 1.2: GDP - Real Consumer
3 Spending & Business Investments
2 (Percent Annual Rate)
1
Consumer Spending
0
Non-residential Private Fixed Investments
2014-Q1
2017
2012-Q1
2012-Q3
2013-Q1
2013-Q3
2014-Q3
2015-Q1
2015-Q3
2016-Q1
2016-Q3
2017-Q1
2017-Q3
2018-Q1
2018-Q3
-1 Residential Private Fixed Investments
20.0
-2
10.0
Source: Bureau of Economic Analysis
0.0
Consumer spending—which accounts for about two-
thirds of GDP—expanded at a slightly higher pace of -10.0
2.6 percent in 2018 (2.5 percent in 2017). Compared -20.0
to 2017 levels, private consumption spending rose
-30.0
across all items except for gasoline, fuel oil, and
2009
2000
2001
2002
2003
2004
2005
2006
2007
2008
2010
2011
2012
2013
2014
2015
2016
2017
2018
other energy goods. The Conference Board’s
Consumer Confidence Index continues to show Source: Bureau of Economic Analysis, SAAR, Bil.Chn.2009$
strong consumer confidence, with the index at 137.9
in October 2018, up from one year ago (126.2). The number of building starts—an indicator of
residential investment —declined to a seasonally
Private fixed investment spending rose at a stronger adjusted annual rate of 1.078 million units in
pace of 5.3 percent (4.8 percent in 2017) as non- December 2018 from 1.21 million in the same month
residential investment rose at a solid 7.0 percent last year. However, housing permits were up in
annual rate. On the other hand, residential December 2018 at a seasonally adjusted rate of
investment spending contracted 0.2 percent, as 1.326 million from 1.320 in the same month last
builders faced higher labor and construction year.
materials costs.
NATIONAL ASSOCIATION of REALTORS® | RESEARCH GROUP | www.nar.realtor/research-and-statistics 5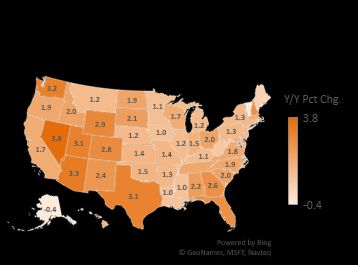
COMMERCIAL REAL ESTATE
OUTLOOK
While construction is trending upwards, housing Government spending expanded 1.5 percent in 2018
permits remain below the 1.5 million new after contracting in 2017 (-0.1 percent). Federal
households being formed. The shortage of labor spending rose at a faster annual rate of 2.6 percent
and land due to zoning/regulatory issues were cited compared to state/local spending which rose more
by homebuilders as the main constraints to a ramp- modestly at 0.9 percent.
up in residential construction.
Exhibit 1.5: Real Government Spending
Exhibit 1.3 Housing Permits (Percent Annual Rate)
1-Family Multi-family Total 10.0 Federal State and local
2500
5.0
2000
0.0
1500
1000 -5.0
500 -10.0
2010
2000
2001
2002
2003
2004
2005
2006
2007
2008
2009
2011
2012
2013
2014
2015
2016
2017
2018
0
Jan/2012
Jan/2017
Jan/2000
Jan/2001
Jan/2002
Jan/2003
Jan/2004
Jan/2005
Jan/2006
Jan/2007
Jan/2008
Jan/2009
Jan/2010
Jan/2011
Jan/2013
Jan/2014
Jan/2015
Jan/2016
Jan/2018
Source: Bureau of Economic Analysis, SAAR, Bil.Chn.2009$
Employment
Source: Bureau of Economic Analysis, SAAR, Bil.Chn.2009$
Employment conditions remained robust. During the
Exports rose in 2018 at a stronger pace of 3.9 12-month period of February 2018‒ January 2019,
percent (3.0 percent in 2017), as nearly all broad the economy created 2.8 million payroll jobs, more
categories of exports increased, led by minerals, than the 2.1 million jobs that were added in the
fuels, and related materials, which rose 42 percent same 12-month period one year ago. The economy
during the first three quarters of 2018 compared to has been steadily adding employment since October
year-ago levels. Oil prices (WTI) rose in 2018 to 2010, with 20.2 million jobs to date, which more than
$65/barrel from $50/barrel in 2017. offset the 9.1 million jobs lost during 2007 – 2010.
Exhibit 1.4: Real Exports & Imports Exhibit 1.6: 12-Month Payroll
(Percent Annual Rate) 4000 Employment Change ('000)
Exports Imports 2000
15.0
10.0 0
5.0
0.0 -2000
-5.0 -4000
-10.0
-15.0 -6000
2004
2009
2014
2000
2001
2002
2003
2005
2006
2007
2008
2010
2011
2012
2013
2015
2016
2017
2018
-8000
2018-Jan
2011-Aug
2018-Aug
2008-Feb
2008-Sep
2009-Apr
2011-Jan
2012-Mar
2013-May
2015-Feb
2015-Sep
2016-Apr
2009-Nov
2016-Nov
2007-Jul
2006-Dec
2010-Jun
2014-Jul
2013-Dec
2017-Jun
2012-Oct
Source: Bureau of Economic Analysis, SAAR, Bil.Chn.2009$
Source: Bureau of Labor Statistics
NATIONAL ASSOCIATION of REALTORS® | RESEARCH GROUP | www.nar.realtor/research-and-statistics 6COMMERCIAL REAL ESTATE
OUTLOOK
During the 12-month period of February 2018–
January 2019, payroll employment increased in all
sectors, except for information and utilities, with the
strongest gains in professional/business services
and education/health services. Employment in retail
trade increased by 37,000, notwithstanding the
many store closings in 2018. Manufacturing and
construction also generated strong job growth.
Exhibit 1.7: Payroll Employment: 12-
Month Change ('000)
Government 66
Leisure/Hospitality 254
Educ./Health 499
Prof./Bus. Services 516
The labor market continued to tighten. The
Financial Activities 115
unemployment rate stood at 4.0 percent in January
Information -15 2019, just slightly up from 3.7 percent in November
Utilities -2 2018, as more Americans entered the labor force.
Transp./Warehousing 184
Exhibit 1.9: Unemployment
Retail Trade 37 12
Wholesale Trade 94 10
Manufacturing 296 8
Construction 330 6
Mining/Logging 65 4
-100 0 100 200 300 400 500 600 2
Source: Bureau of Labor Statistics
0
2006-Jan
2006-Sep
2008-Sep
2016-Sep
2018-Sep
2007-May
2008-Jan
2009-May
2010-Jan
2010-Sep
2011-May
2012-Jan
2012-Sep
2013-May
2014-Jan
2014-Sep
2015-May
2016-Jan
2017-May
2018-Jan
In December 2018, employment increased at the
fastest pace from year-ago levels in Nevada,
Arizona, Washington, Texas, and Utah, with Source: Bureau of Labor Statistics
employment growing by at least three percent.
Nationally, non-farm employment rose 1.9 percent.
NATIONAL ASSOCIATION of REALTORS® | RESEARCH GROUP | www.nar.realtor/research-and-statistics 7COMMERCIAL REAL ESTATE
OUTLOOK
Inflation and Interest Rates
Exhibit 1.11: Interest Rates
With sustained growth, inflation has been trending
above the 2 percent target of the Federal Open Federal Open Market Committee: Fed Funds Target Rate:
Market Operations Committee (FOMC) since March Upper Limit (EOP, %)
2018. As of January 2019, prices for all items (CPI) FHLMC: 30-Year Fixed-Rate Mortgages: U.S. (%)
rose 2.2 percent from the levels one year ago. Core
9.0000
inflation, which measures the change in prices other
8.0000
than food and energy, rose at a slower pace of 1.6
percent. 7.0000
6.0000
To keep inflation in check, the FOMC raised the 5.0000
federal funds target range four times in 2018. 4.0000
However, the FOMC kept the federal funds rate 3.0000
target unchanged, in the 2.25 - 2.5 percent range at 2.0000
its January meeting, citing its reading of recent 1.0000
economic indicators and broader macroeconomic 0.0000
risks in the outlook (e.g. slower global growth).
Jul/2005
Jul/2016
Jun/2006
Jun/2017
Nov/2001
May/2007
Apr/2008
Nov/2012
May/2018
Jan/2000
Dec/2000
Sep/2003
Mar/2009
Aug/2004
Feb/2010
Jan/2011
Dec/2011
Sep/2014
Aug/2015
Oct/2002
Oct/2013
Given the FOMC’s indication of fewer rate hikes
ahead, the 30-year fixed rate has trended down, to
3.8 percent in February 2019 after trending above
Source: Federal Reserve Board, Freddie Mac
four percent monthly during May–December 2018.
Exhibit 1.10: Inflation
All Items All Items -Less Food and Energy
6.0
5.0
4.0
3.0
2.0
1.0
0.0
-1.0
-2.0
-3.0
Jul/2005
Jul/2016
Dec/2000
Jun/2006
May/2007
Jun/2017
Nov/2001
Apr/2008
Nov/2012
May/2018
Jan/2000
Sep/2003
Mar/2009
Aug/2004
Feb/2010
Jan/2011
Dec/2011
Sep/2014
Aug/2015
Oct/2002
Oct/2013
Source: Bureau of Labor Statistics
NATIONAL ASSOCIATION of REALTORS® | RESEARCH GROUP | www.nar.realtor/research-and-statistics 8COMMERCIAL REAL ESTATE
OUTLOOK
Commercial space is concentrated in large Accounting for the last quarter’s activity, investment
buildings, yet large buildings are a relatively small sales in LCRE markets accounted for $562.1 billion
number of the overall stock of commercial buildings. during 2018, a noticeable 15.0 percent increase on
Based on Energy Information Administration data a yearly basis. Deal volume for the year was at the
approximately 72 percent of commercial buildings third-highest level on record, and only about $8
are less than 10,000 square feet in size.1 An billion kept investments from claiming the historical
additional eight percent of commercial buildings are top spot, according to RCA. While portfolio and
less than 17,000 square feet in size. The entity-level sales accounted for a good share of the
commercial real estate market is bifurcated, with the sales, individual property investments provided the
majority of buildings (81 percent) relatively small bulk of the gains, and reached a new record during
(SCRE), but with the bulk of commercial space (71 2018, at $387.5 billion.
percent) in larger buildings (LCRE).
Apartment sales maintained the lead in terms of
Likewise, commercial sales transactions are transaction volume, with $50.9 billion in closed
measured and reported based on deal value. Deals transactions in the fourth quarter of 2018, a nine
at the higher end—$2.5 million and above— percent gain year-over-year, based on RCA data.
comprise a large share of investment sales, and Office properties captured the second largest share
generally receive most of the press coverage. of investor dollars, with $41.3 billion in sales. Office
Smaller commercial transactions tend to be investment volume rose 11.0 percent from a year
obscured given their values. However, these smaller ago. The retail sector closed $17.4 billion in sales
properties comprise the backbone of daily economic during the fourth quarter. Industrial transactions
activity—e.g. neighborhood shopping centers, increased a significant 44.0 percent from the prior
warehouses, small offices, supermarkets, etc. Given year, with sales totaling $27.2 billion in the fourth
the importance of these buildings to local quarter.
communities, and REALTORS®’ active roles in Exhibit 2.1: CRE Sales Volume ($2.5M+)
serving these markets, this report focuses on
illuminating trends in both large and small markets. $200 Individual Portfolio Entity
Billions
$180
Large Cap Commercial Real Estate Markets
$160
The last quarter of 2018 registered a solid increase $140
in the volume of sales transactions in LCRE $120
markets, closing the book on the year on a high $100
note. Investment volume in the large cap space $80
totaled $160.0 billion during the fourth quarter, a 20
$60
percent jump from the same period in 2017,
according to Real Capital Analytics (RCA). Deal $40
volume advanced for all property types, except $20
development sites. $-
13Q4
07Q1
07Q4
08Q3
09Q2
10Q1
10Q4
11Q3
12Q2
13Q1
14Q3
15Q2
16Q1
16Q4
17Q3
18Q2
1Smith and Ratiu, (2015), "Small Commercial Real Estate Market,"
National Association of REALTORS® Source: Real Capital Analytics
NATIONAL ASSOCIATION of REALTORS® | RESEARCH GROUP | www.nar.realtor/research-and-statistics 9COMMERCIAL REAL ESTATE
OUTLOOK
Sales in the six major metros tracked by RCA Exhibit 2.2: Commercial Property Price
experienced renewed interest from investors, Indices
posting a 35.0 percent advance from a year ago, to
$65.9 billion. Large-cap transactions in secondary NCREIF Green Street Advisors
and tertiary markets comprised a combined $92.4 Real Capital Analytics
billion in sales volume, notching about 10.0 percent 400.0
gains each on a yearly basis. 300.0
200.0
Investments mirrored trends in the broader economy
across the property sectors. During 2018, apartment 100.0
properties captured the largest share of 0.0
2007-Q1
2010-Q1
2001-Q1
2002-Q1
2003-Q1
2004-Q1
2005-Q1
2006-Q1
2008-Q1
2009-Q1
2011-Q1
2012-Q1
2013-Q1
2014-Q1
2015-Q1
2016-Q1
2017-Q1
2018-Q1
transactions, accounting for 31.0 percent of total,
according to RCA. Apartment deals in major
markets were particularly active, even as investors
maintained a keen interest in non-major markets as at a value of 132.0. For 2018 overall, GSA’s price
well. Office sales were the second-largest in terms index rose 1.6 percent. The National Council of Real
of volume, netting 24.0 percent of 2018 total. Estate Investment Fiduciaries (NCREIF) Price Index
Industrial properties remained in high demand, with recorded a 9.8 percent advance during the fourth
sales comprising 16.0 percent of the yearly total, quarter, compared with the same quarter a year
placing the property in third place overall. While the ago, and posted a 9.2 percent gain for the year,
doom-and-gloom about the fundamentals in the compared with 2017.
retail sector stole the headlines, investors discerned
opportunities in the market. Sales volume for retail The financial markets’ volatility of the fourth quarter
properties increased 32.0 percent in 2018 compared of 2018 saw the 10-year Treasury moving past the
with the prior year, the second-highest gain among 3.0 percent threshold. For investors, there was
all property types. strong expectations that cap rates in LCRE markets
would begin trending up. However, cap rates
With investment activity on an uptrend in LCRE remained flat during the quarter, hinting that owners
markets, prices advanced 6.2 percent year-over- and investors maintained a steady approach to
year during 2018, according to RCA’s Commercial valuations.
Property Price Index. All property types recorded Exhibit 2.3: NCREIF Property Index
higher prices during the year, with the apartment Returns—2018.Q4
sector showing double-digit gains from a year ago.
Prices in non-major markets outpaced those in the NATIONAL 1.37%
six major markets.
OFFICE 1.65%
The gains in commercial pricing were mirrored in INDUSTRIAL 3.40%
other commercial real estate price indices. The
RETAIL -0.43%
Green Street Advisors Commercial Property Price
Index—focused on large cap properties—rose 2.0 APARTMENT 1.35%
percent on a yearly basis during the fourth quarter,
Source: National Council of Real Estate Investment Fiduciaries
NATIONAL ASSOCIATION of REALTORS® | RESEARCH GROUP | www.nar.realtor/research-and-statistics 10COMMERCIAL REAL ESTATE
OUTLOOK
Small Cap Commercial Real Estate Markets
In tandem with the broader investment trends in indicated that the pricing gap between buyers and
LCRE markets, small cap markets experienced a sellers was a main issue. Prices in SCRE markets
solid fourth quarter of 2018, with investors focused rose 1.8 percent during the fourth quarter of 2018.
on growing local economies and markets. Sales in Capitalization rates in SCRE markets experienced a
SCRE markets increased by 2.3 percent from the decline of eight basis points.
same quarter in 2017.
Exhibit 2.5: Sales Prices
Exhibit 2.4: Sales Volume (YoY Percent Change)
(YoY Percent Change) Real Capital Analytics CRE Markets
Real Capital Analytics CRE Markets REALTOR® CRE Markets
REALTOR® CRE Markets 15.0%
200% 10.0%
5.0%
150%
0.0%
2008.Q4
2009.Q3
2010.Q2
2011.Q1
2011.Q4
2012.Q3
2013.Q2
2014.Q1
2014.Q4
2015.Q3
2016.Q2
2017.Q1
2017.Q4
2018.Q3
100% -5.0%
-10.0%
50%
-15.0%
0% -20.0%
2013.Q2
2008.Q4
2009.Q3
2010.Q2
2011.Q1
2011.Q4
2012.Q3
2014.Q1
2014.Q4
2015.Q3
2016.Q2
2017.Q1
2017.Q4
2018.Q3
-25.0% Sources: National Association of REALTORS®, Real Capital Analytics
-50%
-100% Sources: National Association of REALTORS®, Real Capital Analytics
The SCRE investment markets were characterized
by a significant shortage of available inventory,
which remained ranked as the top concern for
REALTORS®. Anecdotally, members in many
markets reported investors actively seeking off-
market properties, fueling continued increases in
transaction prices. Close to 40.0 percent of
respondents to a market survey ranked tight
inventory as the number one issue affecting their
markets, followed by a quarter of respondents who
NATIONAL ASSOCIATION of REALTORS® | RESEARCH GROUP | www.nar.realtor/research-and-statistics 11COMMERCIAL REAL ESTATE
OUTLOOK
International transactions remained a fixture in Treasury 10-year note averaged 3.0 percent during
REALTORS®’ CRE markets in the final quarter of the quarter, reaching 3.1 percent by the end of the
the year, accounting for 11.0 percent of responses year. The rising 10-year Note rate narrowed the
to a survey. The average international sale price spread with SCRE cap rates below 400 bps, as
was $1.4 million in the fourth quarter of the year. forward expectations project further spread
compression.
Longer-dated bond yields kept on an upward path in
the fourth quarter of 2018, fueled by the rise in
financial market volatility. The interest rate on the
Exhibit 2.6: Cap Rates - 2018.Q4 Exhibit 2.7: CRE Spreads: Cap Rates to 10-
Yr. T-Notes (basis points)
RCA Markets REALTOR® Markets
8.0% RCA Cap Rates REALTORS® Cap Rates
1200
7.0%
1000
6.0%
800
5.0%
4.0% 600
3.0% 400
2.0%
200
1.0%
0 15Q3
10Q1
10Q3
11Q1
11Q3
12Q1
12Q3
13Q1
13Q3
14Q1
14Q3
15Q1
16Q1
16Q3
17Q1
17Q3
18Q1
18Q3
0.0%
Office Industrial Retail Apartment
Sources: National Association of REALTORS®, Real Capital Analytics Sources: National Association of REALTORS®, Real Capital Analytics
NATIONAL ASSOCIATION of REALTORS® | RESEARCH GROUP | www.nar.realtor/research-and-statistics 12COMMERCIAL REAL ESTATE
OUTLOOK
Large Cap Commercial Real Estate Markets
The commercial fundamentals in LCRE markets Industrial net absorption totaled 62.9 million square
maintained an upward trend, displaying strong feet during the fourth quarter, according to CBRE
performance during the last quarter of 2018, and data. The solid demand outpaced new deliveries,
closing the year on a bright note. Macroeconomic even as completions picked up, with a total of 56.6
trends proved beneficial to space demand across million square feet of new space coming to market.
the core property types, leading to declines in In addition, the pipeline of industrial space under
vacancy rates and continued advances in rental construction rose three percent during the fourth
income. These factors maintained the attractiveness quarter. Strong demand kept the vacancy rate at 4.3
of investments in LCRE markets during the year. percent for the quarter. Asking rents advanced to
$7.37 per square foot, the highest level in 30 years,
The solid economic currents and employment gains and marking a 2.2 percent year-over-year increase.
translated into strong demand for office space in the
fourth quarter of 2018. Net absorption of office The traditional holiday season of the fourth quarter
spaces totaled 16.9 million square feet during the provided wind in the sail of retail stores. Department
quarter, according to CBRE. For 2018 overall, net store closures continued to impact the landscape.
absorption summed to 58.3 million square feet, the However, lifestyle malls, neighborhood shopping
highest annual figure since 2015. According to centers and outlets experienced increased foot
CBRE data, over 90.0 percent of office markets traffic. Net absorption of retail space totaled 14.8
experienced positive absorption during the year. On million square feet. As the supply of new stores
the supply side, the quarter notched 11.8 million came in at a modest 7.2 million square feet, the
square feet of new space delivered, tallying up 49.0 retail availability rate declined to 6.3 percent, based
million square feet of completions for 2018. In on CBRE data. Asking rent rose to $17.57 per
addition, about 70 percent of newly-finished space square foot during the last quarter.
was preleased, as tenants continue to seek quality
work accommodations. Reflecting the demand- The improvement in household formation figures
supply balance, the office vacancy rate declined 10 remained favorable to the multifamily sector during
basis points in the fourth quarter, to 12.6 percent. the fourth quarter of 2018. Net absorption of
The asking rent for office space nationally averaged apartments totaled 286,600 units during 2018, the
$33.2 per square foot at the end of 2018, a 2.7 highest level since 2000, according to CBRE.
percent increase from 2017. Construction of multifamily properties was apace
during the year, with 267,900 units delivered. As
Despite continuing tensions about international demand outstripped supply, the national vacancy
trade negotiations, import and export activity rate declined 20 basis points from 2017, to an
remained brisk in the fourth quarter. In addition, average of 4.5 percent by the end of the year.
consumer spending was solid, especially in the e- Apartment effective rents rose 2.8 percent year-
commerce arena. These factors contributed to over-year, to a monthly average of $1,655 per unit
strong demand for industrial properties—logistics during the fourth quarter.
centers, distribution warehouses, manufacturing
facilities.
NATIONAL ASSOCIATION of REALTORS® | RESEARCH GROUP | www.nar.realtor/research-and-statistics 13COMMERCIAL REAL ESTATE
OUTLOOK
Small Cap Commercial Real Estate Markets
Commercial fundamentals in REALTORS®’ markets Lease terms reflected a preference for slightly
stood in contrast with those in LCRE ones. shorter terms during the fourth quarter. The share of
Following in the wake of a moderate increase in the 60-month leases declined from 27.0 percent of total
third quarter of 2018, fourth quarter leasing activity in the third quarter to 16.0 percent during the fourth
declined 3.1 percent, as a smaller share of quarter of 2018. In tandem, the share of 36-month
members reported closing a leasing deal. The and 48-month lease terms recorded increases,
slowdown was mirrored in construction activity, accounting for 40.0 percent and 11.0 percent of
which notched a mere 0.9 percent uptick. Leasing total, respectively. In addition 12-month leases also
rates remained positive, advancing 2.1 percent showed increased interest from tenants.
during the quarter, and concessions declined 1.3
percent. As leasing activity declined, vacancy rates provided
a mixed picture during the quarter, reflecting mixed
Exhibit 3.1: REALTORS® Fundamentals
conditions across the core property types. The office
New Construction Leasing Volume and industrial vacancy rates in SCRE markets
declined compared to a year ago, by 10 basis points
15% and 40 basis points, respectively. The apartment
10% vacancy remained on par with the fourth quarter of
2017. The vacancy rate for retail properties rose in
% Change, Quarter-over-quarter
5%
small cap markets to 12.5 percent in the last quarter
0% of 2018, reflecting the wave of store closures,
2009.Q2
2010.Q1
2010.Q4
2011.Q3
2012.Q2
2013.Q1
2013.Q4
2014.Q3
2015.Q2
2016.Q1
2016.Q4
2017.Q3
2018.Q2
-5% particularly in smaller, more rural markets.
-10% Exhibit 3.2: REALTORS® Commercial
-15%
Vacancy Rates
-20% Office Industrial Retail
-25% Multifamily Hotel
30.0%
-30%
Source: National Association of Realtors® 25.0%
Tenants seeking space in REALTORS®’ markets
20.0%
remained focused on smaller footprints. In the fourth
quarter, the ‘5,000 square feet and below’ segment 15.0%
accounted for 75.0 percent of activity. Demand for
the ‘5,000 – 7,499 square feet’ segment was on par 10.0%
with the prior quarter, and accounted for 11.0
5.0%
percent of activity. The ‘7,500 – 9,999 square feet’
segment experienced a bump in demand, as it 0.0%
comprised 5.0 percent of reported transactions. The
2010.Q1
2010.Q3
2011.Q1
2011.Q3
2012.Q1
2012.Q3
2013.Q1
2013.Q3
2014.Q1
2014.Q3
2015.Q1
2015.Q3
2016.Q1
2016.Q3
2017.Q1
2017.Q3
2018.Q1
2018.Q3
‘50,000 square feet and above’ segment accounted
for 3.0 percent of total activity, the same share as
the preceding quarter. Source: National Association of Realtors®
NATIONAL ASSOCIATION of REALTORS® | RESEARCH GROUP | www.nar.realtor/research-and-statistics 14COMMERCIAL REAL ESTATE
OUTLOOK
Retail trade faces headwinds from e-commerce, yet Quarterly E-Commerce Sales (in $Bn)
expands in growing metropolitan areas 12.0% 140.00
9.8%
10.0% 120.00
E-Commerce: a $500 Billion Industry 100.00
8.0%
80.00
E-commerce retail sales continues to account for a 6.0%
60.00
larger share of retail trade, with sales estimated at 4.0%
40.00
$507 billion in 2018, or 9.6 percent of the estimated 2.0% 20.00
$5.2 trillion in total retail sales. In 1999, e-commerce
0.0% 0.00
sales made up less than one percent of retail sales.
Q4/2010
Q4/1999
Q4/2000
Q4/2001
Q4/2002
Q4/2003
Q4/2004
Q4/2005
Q4/2006
Q4/2007
Q4/2008
Q4/2009
Q4/2011
Q4/2012
Q4/2013
Q4/2014
Q4/2015
Q4/2016
Q4/2017
The retail trade sector lost 14,900 payroll jobs in 2018
E-Commerce Sales (in $Bn)- right axis
compared to 2017. Meanwhile, there were 225,000
more payroll employment in warehousing and As a Percent of Retail Sales- left axis
transportation services—which are services related
to e-commerce. Change in Non-farm Employment in 2018
from 2017 (in thousands)
Largest Declines in Women’s Clothing/Shoes, Dept.
Stores, Sporting Goods/Hobby/Music Retail Trade -14.9
Utilities -0.7
Looking at 2017 US Census Bureau retail sales data,
Information 13.0
e-commerce has dealt the biggest blow to women’s
Wholesale Trade 39.3
clothing (-2.5% y/y), shoe stores (-1.4% y/y),
Mining & Logging 55.9
department store sales (-1.5% y/y), and sporting
goods, hobby, book, and music stores sales (-2.9% Other services 75.3
y/y). However, with income increasing at a modest Government 98.3
pace, sales were still up in warehouse clubs and Government 98.3
super stores (3.1% y/y), miscellaneous store retailers Financial Activities 118.8
(3.4%) and other general merchandise stores (3.7%). Transportation 225.0
Clothing and accessories (which includes women’s Trade, transportation & utilities 248.7
clothing and women’s shoes) is still growing overall Manufacturing 248.9
(1.4%), on account of the growth in men’s clothing Leisure & hospitality 298.9
stores (4.4%) and jewelry sales (6.1%). Meanwhile, Construction 324.2
electronic shopping and mail order house retail sales Education & health services 479.7
rose 12.1 percent in 2017 from 2016. Professional & business services 491.5
Source: Bureau of Labor Statistics, Seasonally adjusted data
NATIONAL ASSOCIATION of REALTORS® | RESEARCH GROUP | www.nar.realtor/research-and-statistics 15COMMERCIAL REAL ESTATE
OUTLOOK
Annual Percent Change in Sales in 2017
Sporting Goods, Hobby, Book & Music Stores
Women's Clothing Stores
Department Stores excl Leased Departments
Shoe Stores
Clothing & Accessory Stores
Furniture & Home Furn & Electronics/Appliance Stores
Health & Personal Care Stores
General Merchandise Stores
Warehouse Clubs & Super Stores
Miscellaneous Stores Retailers
Other General Merchandise Stores
Men's Clothing Stores
Retail Sales 4.9
Motor Vehicle & Parts Dealers
Jewelry Stores
Fuel Dealers
All Other Gen Merchandise Stores
Building Materials, Garden Equipment & Supply Dealers
Gasoline Stations
Nonstore Retailers
Electronic Shopping & Mail Order Houses
-4.0 -2.0 0.0 2.0 4.0 6.0 8.0 10.0 12.0 14.0
Source: US Census Bureau, seasonally adjusted retail sales
Metro Areas with the Largest Decrease in Retail Trade Payroll Employment in 2018 from 2016
Metro areas with Largest Increase /Decrease in Largest Decline % Change
Chicago-Naperville-Elgin IL-IN-WI (12,642) -3%
Retail Trade Employment in 2018 from 2016 Pittsburgh PA (4,317) -3%
Montgomery Cnty-Bucks Cnty-Chester Cnty PA MetDiv (2,875) -2%
Of 412 metros with retail trade employment data from Wichita KS
Philadelphia-Camden-Wilmington PA-NJ-DE-MD
(2,625)
(2,550)
-8%
-1%
the U.S. Census Bureau, nearly half suffered a New Orleans-Metairie LA (2,258) -4%
decline in retail trade payroll employment in 2018 Buffalo-Cheektowaga-Niagara Falls NY (2,008) -3%
Boston-Cambridge-Newton MA NECTA Division (1,858) -1%
compared to 2016, led by Chicago-Naperville-Elgin Oklahoma City OK (1,842) -3%
(12,642), Pittsburgh (4,317), Montgomery (2,875) Miami-Miami Beach-Kendall FL MetDiv (1,758) -1%
Wichita, KS (2,625), and Philadelphia-Camden- Los Angeles-Long Beach-Anaheim CA (1,742) 0%
Cleveland-Elyria OH (1,692) -2%
Wilmington (2,550). Detroit-Dearborn-Livonia MI MetDiv (1,625) -2%
Allentown-Bethlehem-Easton PA-NJ (1,600) -4%
However, retail trade employment continues to grow Bridgeport-Stamford-Norwalk CT Metro NECTA
Anchorage AK
(1,467)
(1,467)
-3%
-7%
strongly in about half of metro areas, led by Seattle- McAllen-Edinburg-Mission TX (1,358) -4%
Tacoma-Bellevue (27,542), Dallas-Fort Worth- Springfield IL (1,350) -11%
Shreveport-Bossier City LA (1,258) -5%
Arlington (10,717), Houston-The Woodlands-Sugar St. Louis MO-IL (1,183) -1%
Land (9,392), Dallas-Plano-Irving (9,183), and Baltimore-Columbia-Towson MD (1,133) -1%
Atlanta-Sandy Springs-Roswell (7.633). These Lancaster PA (1,108) -4%
Toledo OH (1,100) -3%
metros have had large gains in population and job Sioux Falls SD (1,075) -6%
growth over the past years. Naples-Immokalee-Marco Island FL (1,067) -5%
Miami-Fort Lauderdale-West Palm Beach FL (1,050) 0%
Columbus GA-AL (1,033) -7%
Los Angeles-Long Beach-Glendale CA MetDiv (1,033) 0%
NATIONAL ASSOCIATION of REALTORS® | RESEARCH GROUP | www.nar.realtor/research-and-statistics 16COMMERCIAL REAL ESTATE
OUTLOOK
Metro Areas with the Largest Increase in Retail Trade Payroll Employment in 2018 from 2016
Nearly 5,000 Announced Store Closings in 2019
Largest Increase % Change
Seattle-Tacoma-Bellevue WA 27,542 13% As e-commerce purchases continue to eat into the
Seattle-Bellevue-Everett WA MetDiv 24,625 14% brick-and-mortar retail space, another major
Dallas-Fort Worth-Arlington TX 10,717 3%
retailer, Payless Shoe Source, announced last
Houston-The Woodlands-Sugar Land TX 9,392 3%
Dallas-Plano-Irving TX MetDiv 9,183 4%
February 15 it was closing its 2,100 stores in the
Atlanta-Sandy Springs-Roswell GA 7,633 3% United States and Puerto Rico after it had filed for
Riverside-San Bernardino-Ontario CA 7,050 4% bankruptcy in 2017. This brings to 4,287 announced
Phoenix-Mesa-Scottsdale AZ 6,475 3% store closings in 2019, following on the heels of 8,139
Orlando-Kissimmee-Sanford FL 6,117 4% announced store closures in 2017 and 5,524 in 2018,
Columbus OH 5,900 6%
according to CoreSight, a website that tracks the
Denver-Aurora-Lakewood CO 5,650 4%
New York City NY (Thous) 5,450 2%
retail market. Announced closures in 2019 includes
Jacksonville FL 5,250 7% Gymboree, Shopko, Chico’s, Gap, Starbuck’s, The
Louisville/Jefferson County KY-IN 4,842 7% Children’s Place, Performance Bicycle, Charlotte
Minneapolis-St. Paul-Bloomington MN-WI 4,767 3% Russe, Sears, Destination Maternity, Lowe’s, Kmart,
Charlotte-Concord-Gastonia NC-SC 4,225 3% Christopher and Banks, Beauty Brands, Henri Bedel ,
Provo-Orem UT 3,800 13%
Lord & Taylor, Target, Macy’s, J. Crew, Kohl’s, and JC
Nashville-Davidson-Murfreesboro-Franklin TN 3,667 4%
New York-Newark-Jersey City NY-NJ-PA 3,550 0%
Penny.
San Francisco-Oakland-Hayward CA 3,400 2%
Portland-Vancouver-Hillsboro OR-WA 3,325 3% How the Brick-and-Mortars Can Reinvent
New York-Jersey City-White Plains NY-NJ MetDiv 3,175 0% Themselves
Austin-Round Rock TX 3,100 3%
Indianapolis-Carmel-Anderson IN 3,083 3%
How the brick-and-mortar retail stores will survive
Tacoma-Lakewood WA MetDiv 2,917 7%
Salt Lake City UT 2,708 4% the increasing shift of consumers to e-commerce
Raleigh NC 2,550 4% will depend on how they re-invent themselves. Many
Sacramento-Roseville-Arden-Arcade CA 2,525 3% stores have invested in technology to engage
Las Vegas-Henderson-Paradise NV 2,458 2% consumers through an omni-channel marketing
Oakland-Hayward-Berkeley CA MetDiv 2,233 2% platform (online and offline). Meanwhile, retailers
have focused on turning stores into a brand-
enhancing space, in addition to the locations’ primary
focus on generating sales. Stores who will cater to
customers’ increasing use of technology for product
search (using visual search rather than just tech
search), and find ways to cut down costs are most
likely to meet the challenge of e-commerce.
NATIONAL ASSOCIATION of REALTORS® | RESEARCH GROUP | www.nar.realtor/research-and-statistics 17COMMERCIAL REAL ESTATE
OUTLOOK
Reflecting changes in economic indicators and
monetary policy, NAR expects the Federal
Operations Market Committee to take a cautious
approach with interest rate adjustments. The federal
funds rate is projected to increase to 2.4 percent in
2019. The move will exert upward pressure on
longer-termed interest rates, which are likely to
affect investment spending, including residential
construction.
As interest rates increase, NAR forecasts inflation
to fall to 1.3 percent. Economic output is expected
to expand at a slower pace of 1.8 percent in 2019.
With monetary tightening and considering that a
strong employment market has been attracting
workers back into the labor force, the
unemployment rate is expected to rise slightly to 4.0
percent in 2019, and non-farm payroll jobs to
increase at a slower pace of 1.3 percent.
As economic activity remains positive, commercial
leasing fundamentals are expected to maintain their
trajectory this year. Vacancy rates will likely provide
mixed results, while cash flows should continue
rising.
Exhibit 4.2: Commercial Real Estate Vacancy Forecast (%)
2017.Q4 2018.Q1 2018.Q2 2018.Q3 2018.Q4 2019.Q1 2019.Q2 2019.Q3 2019.Q4 2020.Q1 2020.Q2 2021.Q3 2018 2019 2020
Office 12.0 12.7 12.4 12.9 13.7 12.8 12.6 12.4 12.3 12.8 12.7 12.5 12.9 12.5 12.6
Industrial 7.8 7.4 7.7 6.8 7.3 7.6 7.3 7.1 6.9 6.8 6.6 6.5 7.3 7.2 6.6
Retail 11.4 12.0 12.0 12.6 12.7 13.0 12.9 13.2 13.4 13.6 13.7 13.9 12.3 13.1 13.8
Multifamily 5.0 5.5 6.1 6.2 6.4 6.2 6.0 5.8 5.7 6.3 6.1 5.8 6.0 5.9 6.0
Source: National Association of REALTORS®
NATIONAL ASSOCIATION of REALTORS® | RESEARCH GROUP | www.nar.realtor/research-and-statistics 18COMMERCIAL REAL ESTATE
OUTLOOK
The National Association of REALTORS® is America’s largest trade association, representing
more than 1.3 million members, including NAR’s institutes, societies and councils, involved in all
aspects of the real estate industry. NAR membership includes brokers, salespeople, property
managers, appraisers, counselors and others engaged in both residential and commercial real
estate. The term REALTOR® is a registered collective membership mark that identifies a real
estate professional who is a member of the National Association of REALTORS® and subscribes
to its strict Code of Ethics. Working for America's property owners, the National Association
provides a facility for professional development, research and exchange of information among
its members and to the public and government for the purpose of preserving the free
enterprise system and the right to own real property.
NATIONAL ASSOCIATION OF REALTORS®
RESEARCH GROUP
The Mission of the NATIONAL ASSOCIATION OF REALTORS® Research Group is to produce
timely, data-driven market analysis and authoritative business intelligence to serve members,
and inform consumers, policymakers and the media in a professional and accessible manner.
To find out about other products from NAR’s Research Group, visit
www.nar.realtor/research-and-statistics
500 New Jersey Avenue, NW
Washington, DC 20001
202.383.1000COMMERCIAL REAL ESTATE OUTLOOK | 2019.Q1
You can also read