ALASKA'S SEAFOOD INDUSTRY - The Economic Value of 2020 - Alaska Seafood Marketing Institute
←
→
Page content transcription
If your browser does not render page correctly, please read the page content below
Prepared for:                The Economic Value of
                                     ALASKA’S SEAFOOD INDUSTRY
Alaska Seafood Marketing Institute                           Prepared by:
                                     J A N U A R Y 2020

                                                                            1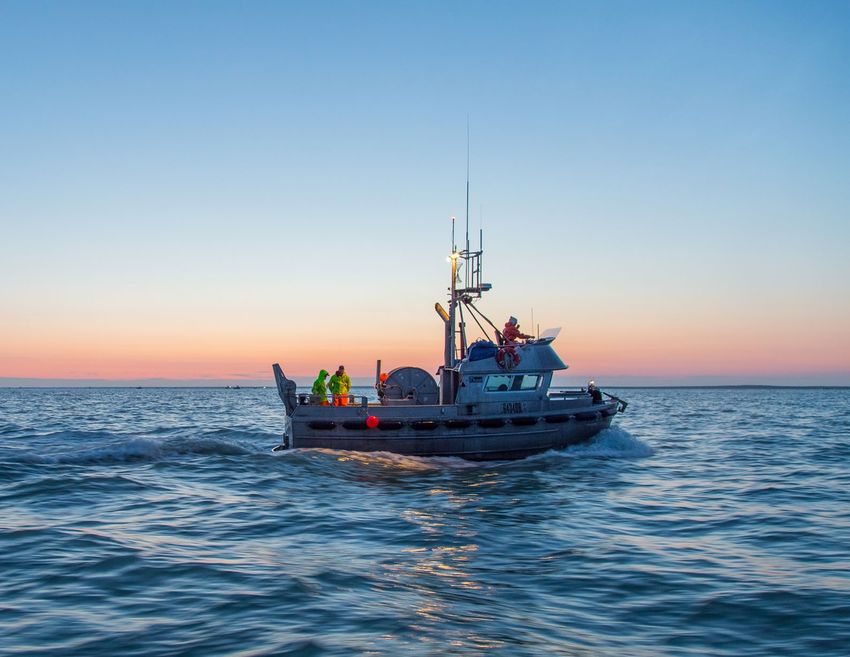
Table of Contents
                                                                                   Introduction and Methods........................ 3
                                                                                   Executive Summary................................... 4
                                                                                   Seafood Industry Overview....................... 6
                                                                                      Commercial Fishing Sector.................... 7
                                                                                      Seafood Processing Sector..................... 8
                                                                                      Fishery Management & Regulation....... 9
                                                                                   Statewide Economic Impacts.................. 10
                                                                                      Arctic, Yukon, Kuskokwim Region....... 14
                                                                                      Bristol Bay............................................ 16

The Alaska Seafood Marketing Institute                                                Bering Sea and Aleutian Islands........... 18
(ASMI) is a public-private partnership                                                Kodiak Region.................................... 20
between the State of Alaska and the Alaska
seafood industry established to foster
                                                                                      Southcentral Alaska............................ 22
economic development of the state’s most                                              Southeast Alaska.................................. 24
valuable renewable natural resource.
                                                                                   National Impact of Alaska Seafood.......... 26
ASMI’s mission is to increase the economic value of the Alaska seafood resource,   Alaska’s Commercial Fishermen.............. 27
benefitting Alaskans in communities across the state. ASMI activities include
product demonstrations, collaborative marketing through chef and social media
                                                                                   Value of Alaska Seafood........................... 28
partnerships, outbound and inbound trade missions, and many other marketing,       Competing in a Global Seafood Market.. 29
education, and advocacy activities.
                                                                                   Industry Tax Revenues............................. 30
ASMI is funded by an industry-directed 0.5% marketing assessment based on the      Lowering the Cost of Living in Alaska...... 31
ex-vessel value of Alaska seafood and USDA funding supporting American export
industries.
                                                                                   Feeding the World.................................. 32
                                                                                   Industry Investment................................ 33

2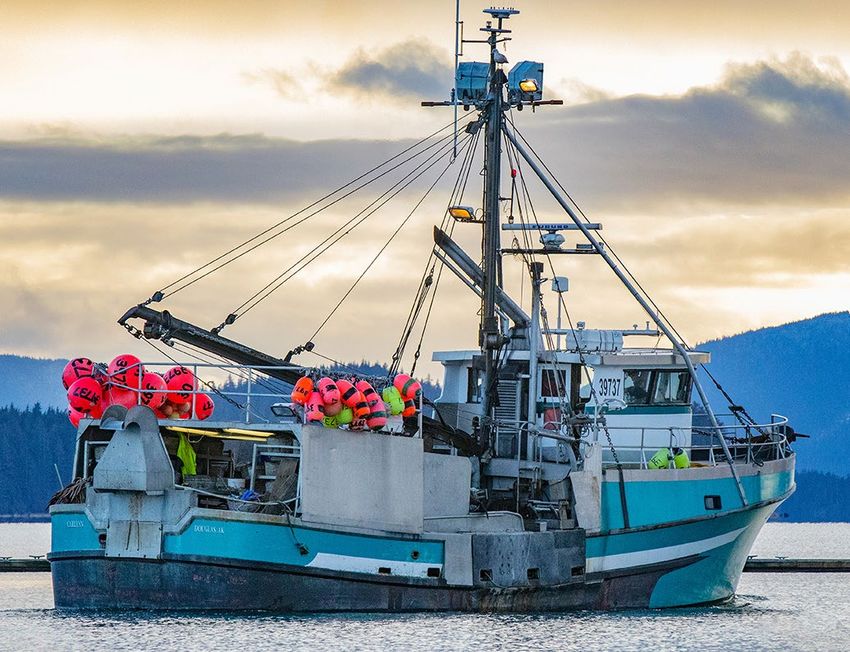
Introduction                                                                                   Glossary
ASMI contracted with McDowell Group to update prior studies (completed in 2013,
2015, and 2017) of the economic impact of Alaska’s commercial seafood industry. The            Direct Impacts: The impacts occurring in the seafood
analysis quantifies the regional, statewide, and national economic impacts of Alaska’s         industry itself, including commercial fishing, seafood
seafood industry, including employment and labor income estimates, tax revenues, and           processing, and direct support sectors.
overall economic output.                                                                       Direct Support Sectors: Critical support positions
                                                                                               are counted as direct impacts in this analysis, such as
As the brand manager for Alaska seafood, ASMI recognizes the need to inform the                fishery managers and hatchery workers.
general public and consumers about the important economic benefits of the industry.            Secondary Impacts: Additional economic impacts
Alaska’s seafood industry covers vast areas of the state but is not always well represented    resulting from business and household spending
in traditional employment data sources.                                                        related to the Alaska seafood industry (i.e. multiplier
                                                                                               effects).
Due to biological and environmental factors, harvest of wild seafood is inherently volatile.
                                                                                               FTE (full-time equivalent): Many seafood industry
For example, total odd-year harvests of Alaska pink salmon can be double or triple even-       workers are employed seasonally or earn a year’s worth
years. In order to reduce the effect of this volatility, most economic impact figures have     of income in less than a year. FTE employment figures
been averaged or otherwise combined from the two most recent years (2017-2018)                 in this report represent an annualized estimate of jobs,
where appropriate.                                                                             allowing comparison to other industries.
                                                                                               Worker Counts: The total number of people earning
This report considers only the commercial seafood industry and does not address                income in the industry.
economic impacts stemming from recreational, charter, or subsistence uses of Alaska’s
                                                                                               Labor Income: Wages, salaries, bonuses, and benefit
seafood resources.                                                                             payments to seafood industry participants.

Data Sources & Methods
                                                                                               Economic Output: The value added to Alaska’s
                                                                                               seafood in total, and at various stages of the
                                                                                               production and supply chain.

McDowell Group worked with the Commercial Fisheries Entry Commission, Alaska                   Ex-Vessel Value: The dollar amount received by
Department of Fish & Game, and Alaska Department of Labor & Workforce Development              fishermen for their catch when delivered to a
                                                                                               processor. This includes both initial payments and any
to compile data sets used in this study. Economic models used to estimate direct and
                                                                                               bonuses.
secondary economic impacts were developed from these datasets, as well as using IMPLAN
                                                                                               First Wholesale Value: The value of seafood products
(a commercially available input-output model), information from industry interviews, and
                                                                                               when sold to buyers outside a processor’s affiliate
other data sources. Relatively minor methodological differences exist between this report
                                                                                               network. This is the value of the raw fish plus the value
and prior versions.                                                                            added by the first processor.

All photos are courtesy of ASMI, except where noted.

                                                                                                                                                           3
Executive Summary
The Seafood Industry: A Cornerstone of Alaska’s Economy                                                 Total FTE Jobs by Region
        Approximately 58,700 workers were directly employed by Alaska’s seafood industry                 BSAI                             10,500
        with just under $1.7 billion in wages annually during the 2017/2018 period. An                   Southeast                8,000
        estimated 37,700 full-time equivalent jobs were supported in the state with wages
                                                                                                         Southcentral     7,300
        of $2.1 billion, including multiplier impacts that result from the industry circulating
                                                                                                         Kodiak         5,800
        money in Alaska’s economy.
                                                                                                                        5,100 Bristol Bay
        Alaska fisheries employed an average of 29,400 commercial fishermen each year                       1,000 Arctic-Yukon-Kuskokwim
        with earnings of more than $1.0 billion. The state’s commercial fleet includes over
        9,000 vessels, which would span just over 64 miles if lined up from bow to stern.

        The processing sector employed an average of 26,000 processing workers. The
        industry includes 166 shore-based plants, 49 catcher-processor vessels, and about
        10 large floating processors, among other participants.

        The seafood industry contributed $5.6 billion in economic output to Alaska’s
        economy in 2017/2018. This measurement includes all the economic activity
        supported by harvesting, processing, and support sectors.

Seafood Industry Impact on Alaska’s Economy, 2017/2018 Avg.
                        Number     Labor
Direct Impacts            of      Income                            Total Impacts
                        Workers ($Millions)
Commercial Fishing       29,400         $1,013            FTE (Full-Time
                                                                                        37,700
                                                          Equivalent) Jobs
Processing               26,000           $435
                                                                                         $2.1
Management/                                               Labor Income
                           3,300          $227                                          Billion
Hatcheries/Others
                                                          Economic                       $5.6
Total                    58,700         $1,675            Output                        Billion
                                                           Note: Figures may not sum due to rounding.

4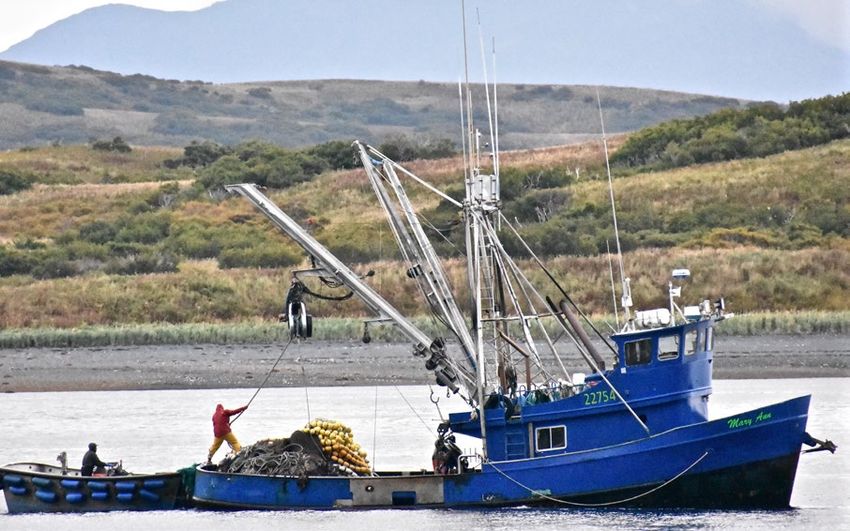
Feeding the World and Alaska’s Economy with Sustainable Fisheries
  Approximately 5.7 billion pounds of seafood worth $2.0 billion was harvested
  annually in 2017/2018. Processors turned this harvest into 2.8 billion pounds of
  product worth $4.7 billion.

  Alaska’s abundant commercial fisheries have produced over 181 billion pounds
  since statehood in 1959. The industry produces enough seafood each year to feed
  everybody in the world at least one serving of Alaska seafood (12.9 billion servings
  annually).

  Alaska seafood was sold in 97 countries around the world in 2018. Export markets
  typically account for approximately two-thirds of sales value, while the U.S. market
  buys the remaining one-third.

  Seafood directly employs more workers than any other private sector industry in
  Alaska, and is the foundation of many rural communities.

  A commitment to sustainable management has allowed the state’s fisheries to
  produce large, diversified harvests for many decades.

The Significant National Economic Impact of Alaska’s Seafood Industry
                                                                      Nationally, the Alaska seafood industry creates over 100,000 FTE jobs, $5.6 billion
                                                                      in annual labor income, and $13.9 billion in economic output.

                                                                      The national economic impact of Alaska’s seafood industry includes $5.9 billion
                                                                      in direct output associated with fishing, processing, distribution, and retail. It also
                                                                      includes $8.0 billion in multiplier effects generated as industry income circulates
                                                                      throughout the U.S. economy.

                                                                      Alaska produces two-thirds of the nation’s seafood harvest in a typical year and is
                                                                      home to nine of the top 20 U.S. fishing ports by value.

                                                                      Alaska seafood exports in 2017 and 2018 averaged more than 1 million metric tons
                                                                      annually, bringing over $3.2 billion in new money into the U.S. economy each year.

                                                                                                                                                            5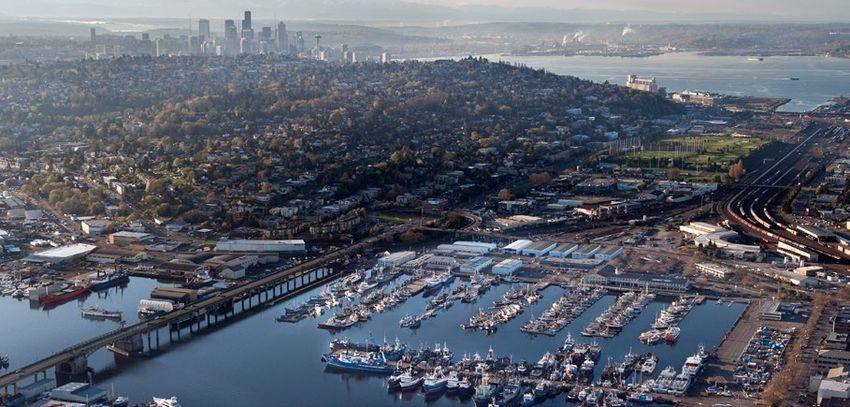
Seafood Industry Overview

6
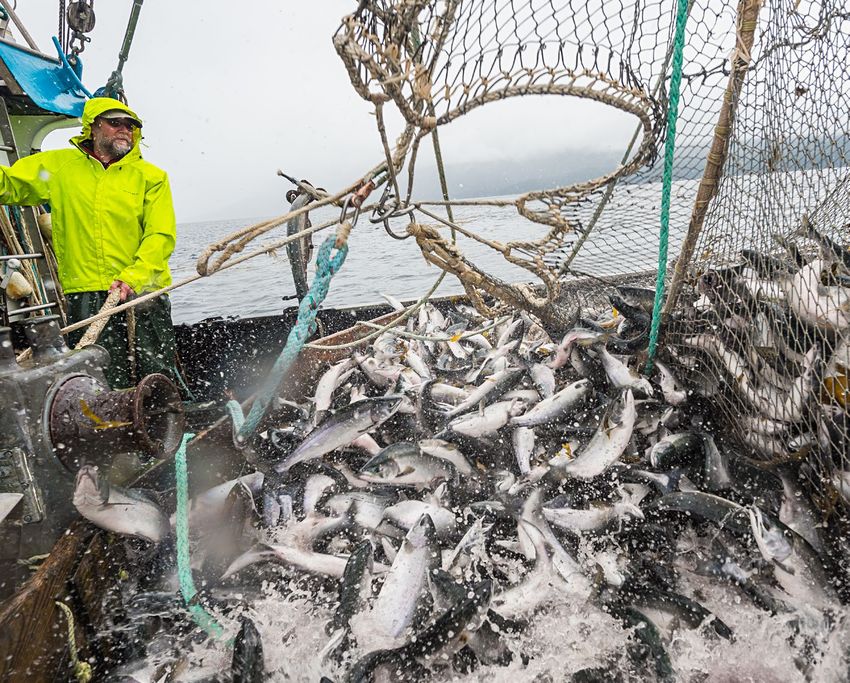
Commercial Fishing Sector
Alaska has the most prolific commercial fishing industry in the United States, producing
more harvest volume than all other states combined. Commercial fishing in Alaska creates
                                                                                                                  Key Figures                                       2018
substantial benefits for Alaska’s economy and provides consumers around the world with a
                                                                                                                  Skippers & Crew                                   29,400
wild, sustainable product.
                                                                                                                     Skippers                                           8,700
The scale of commercial fishing activity in Alaska is very diverse. Crews range from one or
two fishermen working from skiffs and small boats to large catcher-processors in excess of                           Crew                                           20,700
300 feet with 100 workers or more.
                                                                                                                  Alaska Residents                                  16,319
Fishermen involvement in the industry also spans a wide spectrum. Many skippers and crew
participate in multiple fisheries as a full-time career, while others fish to supplement income                   Fishing & Related Vessels                         9,000+
from other jobs, earn money during a summer school break, or work as crew members for
friends and family to be part of a uniquely Alaskan cultural tradition.                                           Ex-Vessel Value ($ Millions)                      $1,994
Regardless of vessel size or involvement, each fishing operation represents a business
                                                                                                                     Percent to AK Residents                            36%
generating new income from a renewable resource. These businesses spend money
throughout the economy, and provide the raw materials on which the rest of the seafood                            Harvest Volume (Millions lbs.)                        5,410
economy is based.

                                    If all the vessels used in the Alaska seafood industry were lined up bow to stern they would stretch on for nearly 64 miles!
   2018 Figures

Length
(feet)
Seafood Processing Sector
Seafood is the state’s largest international export by volume and value. It’s also the largest
manufacturing sector in Alaska, accounting for 70% of the state’s manufacturing employment           Workforce                                     2018
in 2018. Nearly all of Alaska’s seafood products go through the hands of seafood processors,
                                                                                                     Peak Monthly Emp.                              19,571
who add value by turning raw fish and shellfish into myriad products for markets around the
world.                                                                                               Avg. Monthly Emp.                                8,808
The seasonality of many Alaska fisheries, especially salmon, result in a reliance on nonresident
workers to fully staff production jobs at remote sites across the state. Though nonresidents         Total Worker Count*                            25,901
comprise approximately 70% of the processing workforce, residents earn a higher share of               Alaska Residents*                              7,304
the sector’s income as they are more likely to be employed in management and maintenance
positions and work in areas with longer operating seasons.                                           Total Earnings*                        $451 Million

More than 40 different occupations are supported by the processing sector, including                   Alaska Residents*                    $159 Million
machinists, engineers, electricians, cooks, and laborers, among many others.

The sector includes 166 shore-based plants, 49 catcher-processors, approximately 10 floating         Value Added
processors, and various other participants.
                                                                                                     Ex-Vessel Value                        $1.99 Billion

                                                                                                     First Wholesale Value                  $4.47 Billion
First Wholesale Value by Product Type, 2017/2018                                                     Value Added by
                                                                                                                                            $2.45 Billion
                                                                                                       Processors
                                                                                                                           *2017 data are the latest available.

    H/G & Whole Fish                           Surimi                        Fillets
                                                                                                   First Wholesale Value by Species, 2017-2018
         41%                                    13%                           20%
                                                                                                   37% 31%                      11% 10%
                                                                                                   Salmon      Pollock           Pacific           Flatfish,
                                                                                                                                 Cod               Rockfish,
                                                                                                                                                   Atka
            Roe                   Canned                  Meal               Other
                                                                                                   5%          5%               1%                 Mackerel
                                                                                                   Halibut &    Crab             Other
            10%                     5%                  & Oil 3%              7%                   Sablefish

8
Fishery Management & Regulation
Alaska’s fisheries are known worldwide as a model for sustainable management. The efforts of the region’s biologists, managers,
and policy makers ensure healthy stocks and productive fisheries for Alaska’s harvesters and the businesses and communities
that rely on their catches. Changing ocean and climate conditions present an emerging challenge that the industry and
managers are tracking closely.

A key aspect of Alaska’s successful model is the sustainability mandate set forth in the Magnuson-Stevens Act to guide federal
fisheries and the Alaska Constitution to guide state fisheries. There is also a separation of entities that set policy (Alaska Board
of Fisheries and North Pacific Fishery Management Council) and those that enforce regulations and manage fisheries in-
season. Alaska’s commercial fisheries are managed by the Alaska Department of Fish and Game (ADF&G) and the National
Marine Fisheries Service (NMFS), a division of NOAA. With some exceptions, fisheries managed by ADF&G occur within three
miles of Alaska’s coast while NMFS manages fisheries in federal waters (3 - 200 miles offshore).

Some Alaska fisheries have an international component. Pacific halibut fisheries are jointly managed under a treaty with Canada
via the International Pacific Halibut Commission. Transboundary salmon harvests in Southeast Alaska and the Yukon River are
subject to the Pacific Salmon Treaty.

The State of Alaska has several agencies that further support the seafood industry in Alaska:

     The Commercial Fisheries Entry Commission                              The State provides training opportunities and
     implements Alaska’s limited entry law by issuing fishing               extension services through the University of Alaska
     permits for state fisheries and maintaining records of                 system, Alaska Sea Grant, and Alaska’s Institute of
     harvest volume/value.                                                  Technology.

     The Department of Commerce, Community, and                             The Department of Environmental Conservation
     Economic Development is charged with promoting                         issues discharge permits for seafood processing
     economic development in Alaska, including the seafood                  facilities.
     industry.
                                                                            The Department of Labor and Workforce
     The Alaska Seafood Marketing Institute is a public-                    Development monitors employment associated with
     private partnership between the state and the seafood                  the seafood industry, provides workforce training,
     industry with the mission to increase the economic                     and operates programs including the Fishermen’s
     value of Alaska seafood.                                               Fund.

                                                                                                                                       9
Statewide Economic Impacts
Seafood Industry Impact on Alaska’s Economy, 2017/2018 Avg.
                    Number of                    FTE        Labor Income           Output
                     Workers                    Jobs         ($Millions)         ($Millions)       Top Ports (by Landings Value)                         2017
 Commercial Fishing  29,400                    12,900          $1,013              $2,019          1) Dutch Harbor                                 $173 Million
 Processing          26,000                    11,600           $435               $2,539          2) Naknek                                       $154 Million
 Mgmt./Other          3,300                    2,300            $227                  -            3) Kodiak                                       $152 Million
 Direct Total        58,700                    26,800          $1,675              $4,559
                                                                                                   4) Alaska Peninsula                             $112 Million
 Secondary Total        -                      10,900           $463               $1,063
                                                                                                   5) Aleutian Islands                             $106 Million
 Total Impacts          -                      37,700          $2,139              $5,621
                                                                                                        Note: Ex-vessel value of landings in each port/port grouping.
                                                                                                          Source: NOAA. 2017 represents the latest available data.
     Seafood contributed an annual average of $5.6 billion in economic output to
     the Alaska economy in 2017 and 2018.                                                            Jobs & Labor Income Created by
                                                                                                     Basic Sector Industries in Alaska
     In total, seafood contributed 37,700 FTE jobs and $2.1 billion of labor income
                                                                                                                (including multiplier effects)
     annually to the state’s economy during 2017 and 2018. It is estimated that the
     commercial seafood industry accounted for about 8% of statewide employment
     during this period.
                                                                                                        Oil & Gas                         Seafood

     The seafood industry directly employs 58,700 workers in Alaska each year. Through
     business and household spending, it is estimated the industry created an additional              103,900 FTE jobs                 37,700 FTE jobs
     10,900 jobs and $463 million in labor income, on average, in 2017 and 2018.                        $6.0 Billion                     $2.1 Billion

     The seafood industry directly employs more workers than any other private sector                     Visitor                          Mining
     industry. Including multiplier effects, it is the third-largest basic sector job creator in
     Alaska after the oil-and-gas and visitor industries.
                                                                                                      43,300 FTE jobs                   9,200 FTE jobs
     The seafood industry directly employed an estimated 26,200 Alaska residents per                    $1.5 Billion                     $715 Million
     year in 2017/2018.
                                                                                                    Basic sectors bring new income into the economy.
     The economic benefits of the seafood industry are broadly distributed across Alaska,           The industries above collectively account for
     from Kotzebue to Ketchikan.                                                                    ~40% of total employment in Alaska.
                                                                                                   Source: McDowell Group economic impact studies (2017-2019)
10
2018 Figures
Harvesting Processing
6,600 16,319 166 25,901
Resident-owned Resident Shore-based Total
Fishing Vessels Fishermen Processing Processing
Facilities Workers
(2017, Shoreside)
$1.99 Billion 5.41 Billion $4.47 Billion 2.60 Billion
Harvest Pounds of Wholesale Pounds of
Value Seafood Value Seafood
Harvested Produced
Economic Trends in Seafood Industry
2012 2013 2014 2015 2016 2017 2018
Resident Commercial Fishermen 18,538 18,592 18,478 18,161 17,009 16,922 16,319
Gross Earnings ($Millions) $806 $834 $741 $677 $632 $827 $718
Average Processing Employment* 10,198 10,477 10,596 10,254 9,814 9,445 8,808
Peak Processing Employment* 19,472 20,367 20,788 21,279 21,048 19,940 19,571
Wages & Salaries ($Millions)* $364 $392 $399 $445 $442 $446 $439
Harvest Value ($Millions) $2,017 $1,968 $1,920 $1,783 $1,741 $2,068 $1,994
First Wholesale Value ($Millions) $4,503 $4,554 $4,291 $4,273 $4,198 $4,851 $4,472
*Figures may not include processing activity from all catcher/processor vessels.
11Value & Volume of Key Species, 2017/2018
Salmon Pollock Crab Pacific Cod
$744 $1,728 $461 $1,459 $197 $238 $210 $502
Ex-Vessel First Wholesale EV Value FW Value EV Value FW Value EV Value FW Value
Value (EV) Value (FW) $Millions $Millions $Millions $Millions $Millions $Millions
$Millions $Millions
816 $2.12 3,376 $0.43 40 $5.96 584 $0.86
Harvest FW Value per Harvest FW Value per Harvest FW Value per
Harvest FW Value per #Millions Round lb. #Millions Round lb. #Millions Round lb.
#Millions Round lb.
Halibut & Sablefish Flatfish, Rockfish, Percent of Ex-Vessel Value & Volume
& Atka Mackerel
Species Value Volume
Salmon 37% 14%
Pollock 23% 59%
Crab 10% 1%
$211 $235 $182 $443 Pacific Cod 10% 10%
EV Value
$Millions
FW Value
$Millions
EV Value
$Millions
FW Value
$Millions
Halibut & Sablefish 10% 1%
Flatfish & Rockfish* 9% 14%
45 $5.18 789 $0.56 Other Species 1% 1%
Harvest FW Value per Harvest FW Value per
#Millions Round lb. #Millions Round lb. *Includes Atka mackerel.
Ex-Vessel Value & Volume by Fishery Region
13% 9% 8% 55% 14%Regional Employment impacts
Economic benefits created by the seafood
industry are widely distributed across Alaska.
As detailed on the previous page, high
volume whitefish -- mostly harvested in BSAI
and Kodiak regions -- account for roughly
80% of Alaska’s harvest volume and nearly Arctic-Yukon-Kuskokwim
half of the industry’s ex-vessel value. 3,200 1,000
Workers Total
FTE Jobs
Other regions are dominated by salmon
(Alaska’s top species category by value) as
well as halibut, sablefish, and other species.
Southcentral
11,500 7,300
Workers Total
FTE Jobs
Bristol Bay
13,500 5,100
Bering Sea and Workers Total
FTE Jobs
Aleutian Islands (BSAI)
13,700 10,500
Workers Total
FTE Jobs
Kodiak
6,100 5,800
Workers Total
FTE Jobs
Southeast
10,700 8,000
Workers Total
FTE Jobs
Note: The number of seafood workers shown above represents the estimated number of direct seafood
workers employed in each region on average in 2017 and 2018. The total FTE jobs figure represents the
number of full-time equivalent jobs supported by seafood in each region, including multiplier effects.
13Arctic-Yukon-Kuskokwim Region
Seafood Industry Impact on Regional Economy, 2017/2018 Avg.
EligiblE CommuNiTiEs
Number of FTE Labor Income Output Key Ports:
Workers Jobs ($Millions) AND CDQ Emmonak
($Millions) ENTiTiEs Savoonga
Commercial Fishing 2,400 100 $8 $12 Western Alaska Community
Processing 700 400 $4 $5
Unalakleet
Development Quota Program Nome Quinhagak
Mgmt./Other 100 100 $5 -
Direct Total 3,200 600 $17 $17
Secondary Total - 400 $15 $25 Norton Sound Economic
Development Corporation
(NSEDC)
Total Impacts - 1,000 $32 $42
Total annual seafood industry-related labor income in the AYK region is estimated at
approximately $32 million and the total regional economic impact is measured at Yukon Delta Fisheries
$42 million. Development Association
(YDFDA)
Commercial fisheries are an important source of cash income in remote Western
Alaska communities. Seasonal income from seafood supports subsistence lifestyles for
Coastal Villages Region Fund
many AYK families. (CVRF)
AYK has a unique collection of fisheries. Most salmon are caught with setnets or
fishwheels, king crab pots in Norton Sound are hauled up through ice holes, and it is
the only region in the state where lamprey are commercially harvested. Central Bering Sea
Fisherman’s Association
(CBSFA) Bristol Bay Economic
AYK is home to three (of the six) Community Development Quota program entities Development Corporation
(BBEDC)
(see map at right). These entities are allocated a percentage of all federal BSAI
fisheries and use those quota to generate revenue and fund economic development
programs and business activities. Most of the AYK seafood industry’s economic Aleutian Pribilof Island
Community Development
impacts are underpinned by NSEDC’s and YDFDA’s seafood processing plants. Association (APICDA)
The AYK region includes Fairbanks and surrounding communities, with residents
active in fisheries across the state, including Kodiak, Prince William Sound, and 2 Western alaska Community development Quota program
Southeast. Source: Western Alaska Community Development Association.
AYK Region includes: Bethel Census Area, Denali Borough, Fairbanks North Star Borough, Kusilvak Census Area, Nome Census Area,
14 North Slope Borough, Northwest Arctic Borough, Southeast Fairbanks Census Area, and Yukon-Koyukuk Census Area.2018 Figures
Harvesting Processing
367 2,590 7 1,138
Resident-owned Resident Shore-based Total
Fishing Vessels Fishermen Processing Processing
Facilities Workers
(2017, Shoreside)
$13 Million 17 Million $17 Million 6 Million
Harvest Pounds of Wholesale Pounds of
Value Seafood Value Seafood
Norton Sound winter king crab fishing through
Harvested Produced
the ice (above). Keta salmon account for most of
the region’s ex-vessel value, in addition to other
salmon species, red king crab, halibut, Bering 0.6% of Alaska Total 0.4% of Alaska Total
cisco, and lamprey.
Regional Economic Trends in Seafood Industry
2012 2013 2014 2015 2016 2017 2018
Resident Commercial Fishermen 3,489 3,624 3,316 3,261 2,475 2,508 2,590
Gross Earnings ($Millions) $19 $18 $20 $16 $18 $23 $20
Average Processing Employment 341 351 354 452 391 385 370
Peak Processing Employment* - - - - - - -
Wages & Salaries ($Millions)* - - - - - - -
Regional Harvest Value ($Millions) $11 $12 $13 $9 $12 $11 $13
First Wholesale Value ($Millions) $13 $19 $18 $16 $12 $14 $17
*Peak processing employment and wages figures are not available due to confidentiality restrictions.
15Bristol Bay
Seafood Industry Impact on Regional Economy, 2017/2018 Avg.
Number of FTE Labor Income Output Key Regional Ports
Workers Jobs ($Millions) ($Millions)
Naknek Egegik
Commercial Fishing 7,900 2,300 $184 $278
Dillingham Port Moller
Processing 5,400 1,700 $47 $390
Ekuk Togiak
Mgmt./Other 200 100 $5 -
Direct Total 13,500 4,100 $235 $668 Commercial fisheries in the Bristol Bay region
Secondary Total - 1,000 $51 $90 directly employ 13,500 people and generate $235
Total Impacts - 5,100 $386 $758 million in labor income.
Salmon harvest in Bristol Bay has been record
setting in recent years, with production about
40% higher than the 20-year average in 2017 and
2018. In 2018, Bristol Bay accounted for 38% of
Alaska’s salmon harvests.
The region typically accounts for 42% of the
world’s sockeye harvest, and is the largest wild
sockeye salmon run in the world.
Historically, most harvests were either canned or
sold to Japan as a frozen H&G product. Now, the
fishery’s products and markets are much more
diversified and the U.S. is the largest market by a
wide margin.
Bristol Bay fishermen have invested millions of
dollars to improve fish quality through onboard
chilling systems. Over the last decade, salmon
deliveries chilled by refrigerated sea water or slush
Morning on the Nushagak.
ice have increased from 38% to 79%.
16 Bristol Bay Region includes: Bristol Bay Borough, Dillingham Census Area, and Lake and Peninsula Borough (less Chignik area communities).2018 Figures
Harvesting Processing
453 1,473 28 5,471
Resident-owned Resident Shore-based Total
new photo here Fishing Vessels Fishermen Processing Processing
Facilities Workers
(2017, Shoreside)
$279 Million 263 Million $752 Million 193 Million
Harvest Pounds of Wholesale Pounds of
Value Seafood Value Seafood
Bristol Bay sockeye salmon - harvested over Harvested Produced
a short 4-6 week season - make up 98% of
regional ex-vessel value. A total of 41.3 million
sockeye were harvested in 2018.
14% of Alaska Total 17% of Alaska Total
Photo courtesy Bristol Bay Regional Seafood Development
Association. Photographer: Chris Miller
Regional Economic Trends in Seafood Industry
2012 2013 2014 2015 2016 2017 2018
Resident Commercial Fishermen 1,607 1,531 1,536 1,519 1,502 1,516 1,473
Gross Earnings ($Millions) $24 $26 $35 $20 $33 $43 $37
Average Processing Employment 1,514 1,514 1,542 1,095 1,263 1,353 1,393
Peak Processing Employment 5,037 5,312 5,374 4,309 5,116 5,175 5,460
Wages & Salaries ($Millions) $37 $39 $41 $38 $42 $46 $49
Regional Harvest Value ($Millions) $151 $157 $224 $127 $191 $277 $279
First Wholesale Value ($Millions) $330 $358 $437 $421 $527 $585 $752
17Bering Sea & Aleutian Islands
Seafood Industry Impact on Regional Economy, 2017/2018 Avg.
Number of FTE Labor Income Output Key Regional Ports
Workers Jobs ($Millions) ($Millions) Dutch Harbor King Cove
Commercial Fishing 4,600 4,500 $494 $1,110 Akutan Adak
Processing 8,700 4,800 $235 $1,400
St. Paul Island False Pass
Mgmt./Other 400 200 $21 -
Atka
Direct Total 13,700 9,500 $750 $2,510
Secondary Total - 1,000 $39 $78
Total Impacts - 10,500 $789 $2,588
The BSAI region accounted for 57% of the industry’s first wholesale value in 2018.
BSAI commercial fisheries created 10,500 FTE jobs and $789 million of labor income
in 2017/2018.
The resident population in the BSAI region is approximately 8,300, far too small to
harvest and process the region’s vast seafood resources. Even after accounting for
40% of all local resident employment in the BSAI region, most seafood workers come
from the lower 48 or elsewhere in Alaska.
Dutch Harbor is consistently the nation’s top seafood port by volume, and second-
largest in terms of ex-vessel value. In 2017, the port took in 769 million pounds of
seafood - an average of 14.8 million pounds per week.
The C/P Starbound is one of 22 AFA Catcher Processors
Western Alaska residents also benefit from the CDQ program, which is allocated vessels operating in the Bering Sea. AFA CPs primarily
approximately 10% of all BSAI groundfish and crab quotas. CDQ groups have target pollock and can have crews of 100 or more. The
significant ownership interests in the vessels and fisheries of the BSAI and collectively Starbound was lengthened 60’ in 2015 to accommodate
hold roughly a billion dollars in net assets. a fish meal plant and other upgrades.
18 BSAI Region includes: Aleutians East Borough and Aleutians West Census Area.2018 Figures
Regional Ex-Vessel Value
By Species, 2017/2018 Avg. Harvesting Processing
Alaska Pollock
38%
321 746 19 6,474
Resident-owned Resident Shore-based Total
Fishing Vessels Fishermen Processing Processing
Facilities Workers
Pacific Cod (2017, Shoreside)
17%
Crab 16%
$1.13 Billion 4.37 Billion $2.56 Billion 1.93 Billion
Harvest Pounds of Wholesale Pounds of
Flatfish 8% Value Seafood Value Seafood
Salmon 5% Harvested Produced
Other 16%
57% of Alaska Total 57% of Alaska Total
Includes Halibut, Sablefish, Atka Mackerel,
Pacific Ocean Perch, and other species
Regional Economic Trends in Seafood Industry
2012 2013 2014 2015 2016 2017 2018
Resident Commercial Fishermen 928 930 890 870 841 810 746
Gross Earnings ($Millions) $45 $47 $41 $50 $47 $62 $53
Average Processing Employment* 3,607 3,725 3,847 3,813 3,949 3,630 3,331
Peak Processing Employment* 5,576 5,557 5,860 5,216 5,842 5,670 4,982
Wages & Salaries ($Millions)* $130 $137 $147 $178 $205 $200 $196
Regional Harvest Value ($Millions)* $1,100 $993 $998 $1,105 $1,087 $1,089 $1,131
First Wholesale Value ($Millions)* $2,738 $2,399 $2,481 $2,406 $2,557 $2,664 $2,561
*Figures may not include employment or production volume from all catcher/processor vessels. 19Kodiak Region
Seafood Industry Impact on Regional Economy, 2017/2018 Avg.
Number of FTE Labor Income Output Key Regional Ports
Workers Jobs ($Millions) ($Millions) Kodiak Larsen Bay
Commercial Fishing 2,400 1,600 $80 $168
Chignik Old Harbor
Processing 2,700 1,600 $50 $158
Mgmt./Other 1,000 800 $87 -
Direct Total 6,100 4,000 $217 $325 Kodiak was the third largest commercial fishing port
in the U.S. by volume landed in 2017, and fourth
Secondary Total - 1,800 $78 $180
in terms of ex-vessel value. The industry drives the
Total Impacts - 5,800 $295 $505
regional economy and is responsible for much of
the region’s economic activity and population base.
Kodiak’s seafood processors employ the highest
percentage of local residents of any major
production region in Alaska. In 2017, 51% of
processing workers were year-round residents of
Kodiak.
The region’s fishing industry sustains high rates
of resident employment because of a diversity of
fisheries that occur nearly year-round. In addition to
significant pollock, Pacific cod, and flatfish resources
in the Gulf of Alaska, the region has more than 440
streams that support salmon runs.
The U.S. Coast Guard maintains a large presence
in Kodiak, using the community as a staging area
for safety and rescue missions in both the Gulf of
Alaska and Bering Sea.
Crew of the F/V Mary Ann seining off Kodiak Island.
20 Kodiak Region includes: Kodiak Island Borough and the communities of Chignik, Chignik Lake, Chignik Lagoon, and Perryville.Regional Ex-Vessel Value 2018 Figures
By Species, 2017/2018 Avg. Harvesting Processing
Alaska Pollock
26%
602 1,157 14 2,790
Halibut/Sablefish Resident-owned Resident Shore-based Total
Fishing Vessels Fishermen Processing Processing
20% Facilities Workers
(2017, Shoreside)
Pink Salmon
19%
$143 Million 421 Million $235 Million 202 Million
Sockeye Harvest Pounds of Wholesale Pounds of
Salmon 15% Value Seafood Value Seafood
Harvested Produced
5%
Rockfish 5% 7% of Alaska Total 5% of Alaska Total
Other 10%
Regional Economic Trends in Seafood Industry
2012 2013 2014 2015 2016 2017 2018
Resident Commercial Fishermen 1,395 1,357 1,405 1,437 1,243 1,209 1,157
Gross Earnings ($Millions) $166 $164 $150 $134 $118 $155 $134
Average Processing Employment* 1,821 1,799 1,598 1,909 1,636 1,516 1,373
Peak Processing Employment* 2,254 2,480 2,088 2,397 1,980 1,970 1,829
Wages & Salaries ($Millions)* $77 $73 $68 $77 $53 $50 $48
Regional Harvest Value ($Millions) $233 $218 $196 $161 $126 $193 $143
First Wholesale Value ($Millions) $381 $397 $330 $393 $247 $416 $235
*Figures may not include processing activity from all catcher/processor vessels.
21Southcentral Alaska
Seafood Industry Impact on Regional Economy, 2017/2018 Avg.
Number of FTE Labor Income Output Key Regional Ports
Workers Jobs ($Millions) ($Millions) Cordova Kenai
Commercial Fishing 6,800 1,900 $101 $185 Seward Anchorage
Processing 4,200 1,400 $43 $323 Valdez Homer
Mgmt./Other 500 300 $29 -
Whittier
Direct Total 11,500 3,600 $173 $508
The seafood industry directly employs 11,500 workers and
Secondary Total - 3,700 $154 $420 creates approximately 7,300 FTE jobs including multiplier
Total Impacts - 7,300 $328 $928 effects. These jobs are a result of seafood caught and
processed within the region, not including impacts from
Southcentral residents bringing home earnings from other
Alaska fisheries in other regions.
38% of Alaska’s resident commercial fishermen live in
Southcentral, more than any other region.
Southcentral featured 18 communities with gross resident
fishing earnings greater than $1 million in 2018, and seven
communities with more than $5 million. Residents of Homer
earned $69 million, followed by Anchorage ($40 million),
and Cordova ($33 million).
Limited entry fishing permits and IFQ shares for halibut and
sablefish owned by Southcentral residents were worth an
estimated $300 million in 2018.
Southcentral residents earn more than half of their gross
fishing income from fisheries outside the region. The
Bristol Bay driftnet fishery was the main source of income
for residents in 2018, in addition to longlining and other
salmon fisheries statewide.
Anchorage is a critical hub for fresh seafood shipments,
seafood workers, and fishery management meetings, all of
F/V Remedy seining in scenic Prince William Sound.
which benefit the regional economy.
22 Southcentral Region includes: Anchorage Municipality, Kenai Peninsula Borough, Matanuska-Susitna Borough, and Valdez-Cordova Census Area.Regional Ex-Vessel Value 2018 Figures
By Species, 2017/2018 Avg. Harvesting Processing
Pink Salmon
30%
2,405 5,834 56 4,219
Resident-owned Resident Shore-based Total
Fishing Vessels Fishermen Processing Processing
Halibut/Sablefish Facilities Workers
(2017, Shoreside)
29%
Sockeye Salmon
$164 Million 155 Million $445 Million 118 Million
20% Harvest Pounds of Wholesale Pounds of
Value Seafood Value Seafood
Harvested Produced
Other Salmon
19% 8% of Alaska Total 10% of Alaska Total
Other 2%
Regional Economic Trends in Seafood Industry
2012 2013 2014 2015 2016 2017 2018
Resident Commercial Fishermen 6,075 5,976 6,116 6,072 6,052 6,016 5,834
Gross Earnings ($Millions) $290 $321 $267 $259 $218 $285 $248
Average Processing Employment 1,320 1,341 1,415 1,238 1,206 1,315 1,183
Peak Processing Employment 3,258 3,167 3,300 3,374 3,707 3,699 3,522
Wages & Salaries ($Millions) $46 $54 $51 $48 $41 $46 $43
Regional Harvest Value ($Millions) $222 $249 $190 $174 $118 $206 $164
First Wholesale Value ($Millions) $490 $708 $490 $537 $394 $570 $445
23Southeast Alaska
Seafood Industry Impact on Regional Economy, 2017/2018 Avg.
Number of FTE Labor Income Output Key Regional Ports
Workers Jobs ($Millions) ($Millions) Sitka Ketchikan
Commercial Fishing 5,300 2,500 $146 $267 Petersburg Juneau
Processing 4,300 1,700 $66 $265 Wrangell Excursion Inlet
Mgmt./Other 1,100 800 $80 - Craig Yakutat
Direct Total 10,700 5,000 $292 $532 Haines
Secondary Total - 3,000 $119 $270
Total Impacts - 8,000 $411 $802
Seafood is the largest private sector industry in Southeast Alaska, in terms
of workforce size and labor income. Seafood accounted for 15% of regional
employment in 2017/2018, including multiplier impacts.
The harvest of salmon is particularly important to Southeast. The five species
accounted for nearly 60% of the region’s ex-vessel value in 2017/2018, led by
keta. Salmon harvests are supported by the region’s four hatchery associations and
their 15 hatcheries.
Southeast includes four of the top 10 communities ranked by resident permit
holder gross earnings.
• Petersburg, 3rd in state, $49 million
• Sitka, 4th, $41 million
• Ketchikan, 8th, $16 million
• Juneau, 9th, $16 million
Southeast residents own roughly a quarter of Alaska’s commercial fishing fleet,
more than any other region.
F/V Fortune geared up for a longlining trip.
Southeast Region includes: Haines Borough, Hoonah-Angoon Census Area, Juneau Borough, Ketchikan Gateway Borough,
24 Petersburg Borough, POW-Hyder Census Area, Sitka Borough, Skagway Borough, Wrangell Borough, and Yakutat Borough.Regional Ex-Vessel Value 2018 Figures
By Species, 2017/2018 Avg. Harvesting Processing
Halibut/Sablefish
33%
2,462 4,409 42 4,448
Resident-owned Resident Shore-based Total
Fishing Vessels Fishermen Processing Processing
Facilities Workers
(2017, Shoreside)
Keta Salmon
30%
$251 Million 162 Million $462 Million 134 Million
Other Salmon Harvest Pounds of Wholesale Pounds of
17% Value Seafood Value Seafood
Harvested Produced
Pink Salmon
11% 13% of Alaska Total 10% of Alaska Total
Other 9%
Regional Economic Trends in Seafood Industry
2012 2013 2014 2015 2016 2017 2018
Resident Commercial Fishermen 4,872 4,980 5,023 4,900 4,766 4,745 4,409
Gross Earnings ($Millions) $262 $258 $227 $198 $198 $259 $225
Average Processing Employment 2,017 1,968 1,920 1,783 1,741 2,068 1,994
Peak Processing Employment 3,974 4,551 4,775 4,615 3,256 3,162 3,016
Wages & Salaries ($Millions) $54 $66 $68 $72 $65 $68 $64
Regional Harvest Value ($Millions) $298 $342 $281 $214 $212 $284 $251
First Wholesale Value ($Millions) $552 $673 $536 $499 $460 $602 $462
25National Impact of Alaska Seafood
National Impact of Alaska Seafood Industry, 2017/2018 Avg.
Number of FTE Labor Income Output Alaska’s seafood industry supported an estimated
Workers Jobs ($Millions) ($Millions) 101,800 FTE jobs in the U.S., including jobs
Commercial Fishing 29,400 12,900 $1,000 $2,000 throughout the entire production, distribution,
Processing 30,500 15,500 $500 $2,500 and retail chain. Workers in these jobs earned
Mgmt./Other 4,200 2,900 $300 - an estimated $5.6 billion in total annual labor
Distributors 800 800 $100 $100 income.
Grocers 4,700 4,700 $100 $300
The national economic impact of Alaska’s seafood
Restaurants 13,500 13,500 $400 $1,000
industry includes an estimated 50,300 FTE jobs
Direct Total 83,100 50,300 $2,400 $5,900
in fishing, processing, fisheries management,
Secondary Total - 51,500 $3,200 $8,000 transportation and distribution, and in stores and
Total Impacts - 101,800 $5,600 $13,900 restaurants. It also includes 51,500 secondary jobs
Note: Values may not total due to rounding. Includes impacts in Alaska as well as other states.
throughout the economy created as a result of
spending by businesses in the supply chain and
their employees.
Among all the participants in the national seafood
supply chain, fishermen earn the largest share of
labor income at $1.0 billion, or 42% of all direct
labor income generated by Alaska’s seafood
industry.
U.S. economic output related to Alaska’s seafood
industry totals $13.9 billion including all direct
and multiplier impacts. Total output is defined as
the value of Alaska’s seafood resource, as it moves
from the fishing vessel to the consumer’s plate,
plus output arising from secondary impacts.
Fishermen’s terminal in Seattle supports over 500 vessels, many of which operate in Alaska.
26Alaska’s Commercial Fishermen
Alaska Skippers and Crew, People from every U.S. state participate in Alaska’s commercial fisheries.
by State of Residence,
In 2017/2018, 56% of the industry’s skippers, active permit owners, and crew were Alaska residents,
2017/2018 Avg. averaging a total of 16,319 fishermen annually. For many rural Alaska communities, the seafood
industry is among the largest source of employment, wages, and tax revenue.
Nonresident fishermen and processors play a key role in Alaska’s seafood industry. Without their
contributions, it is unlikely the state could provide enough workers to capitalize on available fishery
resources.
Regardless of where fishermen live, their earnings contribute to local economies in Alaska and
16,319 around the country.
172
13,081
27Value of Alaska Seafood
The first wholesale value of Alaska seafood was $4.5 billion in 2018. Of this total, fishermen earned
$2.0 billion in ex-vessel value while processors, both shoreside and at-sea, added $2.5 billion in value.
The value of Alaska’s seafood production has exceeded $4.0 billion since 2011. The industry typically
harvests between five and six billion pounds of seafood each year.
Alaska Seafood Marketing Institute
“The true value of Alaska seafood
extends well beyond the price at the
dock. ASMI works closely with the
Alaska seafood industry to increase
the value of Alaska’s seafood
resource to benefit Alaskans and
Alaska’s communities. ”
-Jeremy Woodrow,
Executive Director, ASMI
Many factors impact the value of Alaska seafood, including:
• Competition with other seafood and protein sources from around the globe.
• Status of trade agreements, tariff disputes, and currency exchange rates.
• Product innovation and adaptation to changing consumer preferences.
• Fluctuating wild seafood stocks and harvests allowed under Alaska’s world-leading sustainable
management practices.
• Promotion of Alaska’s wild, natural, and sustainable seafood brand.
28Competing in a Global Seafood Market
Alaska is a major seafood producer on a global scale. If it were a
country, Alaska would rank No. 8 in wild harvests. However, Alaska Global
Rest of U.S. Wild Harvest &
seafood is a small part of a global supply chain that encompasses
Harvest Aquaculture Production
large volumes of competing wild and farmed species. The species
mentioned on this page account for more than 90% of Alaska’s Alaska
Harvest
ex-vessel value but each faces significant competition from other global 66%
producers, often from regions with lower operating costs. Alaska
2%
Although Alaska seafood is essentially a commodity, Alaska is a high-cost
environment. It is virtually impossible to compete on price alone. Luckily for
Alaska, it is the largest seafood producing state in America with sustainable Flatfish Halibut
management practices and pristine marine waters - attributes no foreign or AK Pct. of Global Supply: 24% AK Pct. of Global Supply: 37%
domestic competitor can match. -------------------- 2017 Figures ---------------------
Alaska is a prominent producer Alaska competes with Pacific
Maximizing the resource value will require market differentiation, product of flatfish, especially yellowfin halibut from Russia and Canada.
development, consumer awareness, and management leadership. Alaska’s sole. Nearly all Alaska flatfish Steadily increasing Atlantic
seafood industry must continue to invest in these endeavors -- especially (excluding halibut) is exported halibut harvests now represent
to China for reprocessing - 34% of global supplies - an
in light of the aggresive investments currently being made by Russia and
exposing it to trade and tariff especially strong competitor on
other countries to improve capacity and quality. disputes. the U.S. Eastern seaboard.
Pollock Salmon Pacific Cod Crab
AK Pct. of Global Supply: 44% AK Pct. of Global Supply: 13% AK Pct. of Global Supply: 17% AK Pct. of Global Supply: 6%
----------------------------------------------------- 2017 Figures -----------------------------------------------------
Alaska pollock competes with Despite large harvests in Alaska, Alaska’s Pacific cod harvests Alaska is known for its crab, but
Russian pollock, as well as tilapia farmed salmon production pale in comparison to those of Canada produces more snow
and pangasius - farmed species outnumbers wild harvests 2.7-to- Atlantic cod. And Russia’s Pacific crab while Russia produces more
whose combined production is 1. Farmed production increased cod harvests are set to surpass king crab. Pacific Northwest
more than twice that of pollock. 70% from 2010 to 2017 to 2.6 Alaska’s in 2020 for the first time states also produce more
million metric tons. in decades. Dungeness than Alaska.
29Industry Tax Revenues
Commercial fishing and processing businesses incur substantial costs to operate
2018, $Millions
in Alaska, including taxes, fees, and self-assessments of more than $172 milion in
Taxes $85.3
2018. These revenue sources include:
Fisheries Business Tax $46.2
Unencumbered taxes are used to fund local, state, and federal government.
Fisheries Resources Landing Tax $9.7
The Fisheries Business Tax is the largest of these taxes and is especially
Marine Motor Fuel Tax $3.0
important as half of the receipts are distributed to local governments, many
of which have few other sources of revenue. Taxes not included due to a lack Corporate Income Tax $3.2
of data include property taxes and federal income taxes, among many others. Local Raw Fish and Other Taxes $23.1
Agency fees and cost recovery collections are designed to pay for specific Agency Fees & Cost Recovery $64.6
services provided by state/federal government, and nonprofit salmon hatchery CFEC Permit and Vessel Fees $7.5
operators. State fees on permits, leases, and vessels, as well as test fishery
Crew License Sales $3.3
receipts, are generally used to pay for administrative costs associated with
Test Fishery Receipts $3.0
commercial fishery management. Federal cost recovery fees are collected for
halibut, sablefish, crab, and other fisheries. Salmon hatcheries, which benefit Processing/Mariculture/Other Fees $1.5
many user groups, are funded almost entirely through cost recovery harvests Salmon Hatchery Cost Recovery* $40.0
and enhancement taxes derived from the commercial fishing industry. Data
Federal Cost Recovery Fees - Federal Share $4.4
were not available for a number of other agency fees, including those related
Federal Cost Recovery Fees - State Share $1.5
to business licensing, port and harbor fees, federal vessel documentation fees,
and federal fishery endorsements, among others. Federal Observer Program $3.4
Industry Self-Assessments $22.3
Industry self-assessments are collected to fund industry-supported projects,
such as seafood marketing efforts through the Alaska Seafood Marketing Seafood Marketing (ASMI) $9.9
Institute and Regional Seafood Development Associations. Salmon Enhancement $9.1
Seafood Development (RSDAs) $2.8
Overall, of the taxes and fees collected on the Alaska seafood industry and for
which data are available, 43% goes to state government ($73 million), 30% goes Dive Fishery Management $0.5
to local governments ($51 million), 23% to salmon hatchery management ($40 Total $172
million), and 5% to the federal government ($8 million). Note: Data are for FY 2018. Totals may not sum due to rounding.
*Earnings are retained by salmon hatcheries.
Sources: ADOR, CFEC, DCCED, ADF&G, NMFS, OMB, & McDowell Group.
30Lowering the Cost of Living in Alaska
Photo courtesy Alaska Marine Lines.
The seafood industry provides economies of scale and economic activity which lowers the
cost of utilities, shipping, fuel, and local taxes for residents in many Alaska communities.
Fishing communities also benefit from marine infrastructure and support services, which are
more developed due to the presence of the commercial seafood industry.
The majority of Alaska’s consumer freight is a one-way, northbound haul. Shipping seafood
on southbound routes provides “backhaul” revenue for shippers, allowing for more
competitive rates on northbound freight. Alaska’s seafood industry ships approximately
one billion pounds of finished product southbound each year, or the equivalent of roughly
23,000 containers.
“Everyone benefits from the seafood industry, especially smaller communities in Western
Alaska,” says Kevin Anderson, president of Alaska Marine Lines, a barge transportation Southbound
company that provides service between Seattle and nearly 100 ports and villages throughout Seafood Shipments
Alaska. “Our ability to serve smaller communities, like those in Bristol Bay, would be About One Billion
drastically reduced without the prospect of southbound seafood shipments. Instead of six Pounds per Year
or seven sailings per year there might only be enough freight to support one or two.”
31Feeding the World
Marine resources like fish and shellfish are public goods that belong to all Alaskans and other Americans.
Alaska’s seafood industry allows all consumers to efficiently access the resource, not just those who live
nearby or have the means to access them with private boats. Commercial fishermen and processing
companies are the conduit through which hundreds of millions of Americans can enjoy Alaska seafood.
The commercial seafood industry also converts this public marine resource into economic benefits for
Americans, such as jobs, tax revenue, and exports.
Public Marine Commercial Seafood Global Consumers &
Resources Fishermen Processors U.S. Economic Benefits
Alaska’s marine resources are so prolific, they could feed the entire world at least one serving of delicious,
healthy seafood each year, or to all American consumers every day for more than a month.
There’s Plenty of Fish in the Sea When it Comes to Alaska Seafood
Number of TOTAL:
Servings by
Product Type 12.9
Billion
in 2017/18 Fillets & Fish Meat Surimi Roe Crab Other Products
Servings
8.6 Billion 2.5 Billion 1.6 Billion 150 Million 12.9 Million
32Industry Investment
Fishermen and processors have made significant investments in the future of Alaska
seafood. A survey of processors found that seven of the 10 largest shoreside processors
invested a total of over $100 million per year in capital expenditures from 2012 to 2016.
This spending that has continued and increased in recent years. Silver Bay Seafoods, for
example, completed a brand new state-of-the-art plant in the remote community of False
Pass in 2019.
Processors’ investment and multiplier impacts are closely tied to resource value. Expanding
value provides processing companies capital to modernize plants, expand production
lines, and pay higher fish prices. All of these benefit local communities in Alaska and
provide growth elsewhere in the U.S. economy.
Alaska’s commercial fishing fleet has expanded over the past five years as well. An average
of 75 newlybuilt boats were added to the fleet annually over the 2013-2018 period,
representing an estimated average investment of more than $50 million per year.
Peter Pan’s Port Moller plant was damaged by a 2017 fire
AVG. and rebuilt in 2018. Reconstruction and upgrades of the
301 plant are examples of processors’ investment in Alaska.
AVG. Photo courtesy Peter Pan.
246
In addition to new builds, vessel upgrades are key to
Note: Only includes sustaining the industry and supporting construction jobs
AVG. vessels active in 2018.
160 Source: CFEC 2018 for American workers.
135
124 Vessel File, compiled by
111 McDowell Group. Recent banner years in Bristol Bay, for example, have
101
78 85 contributed to a rapid proliferation of RSW fish cooling
AVG. 56
65 46 52 systems in that fleet. These upgrades will pay dividends
for vessel owners for years, create jobs, and increase the
1970s 1980s 1990s 2000s 2010 2011 2012 2013 2014 2015 2016 2017 2018 value of the catch by improving quality.
New Commercial Fishing Boats Added to Alaska Fleet
33Prepared for:
Prepared by:
Alaska Seafood Marketing Institute
34You can also read