Page 1 of 19 - Singular Research
←
→
Page content transcription
If your browser does not render page correctly, please read the page content below

Page 1 of 19
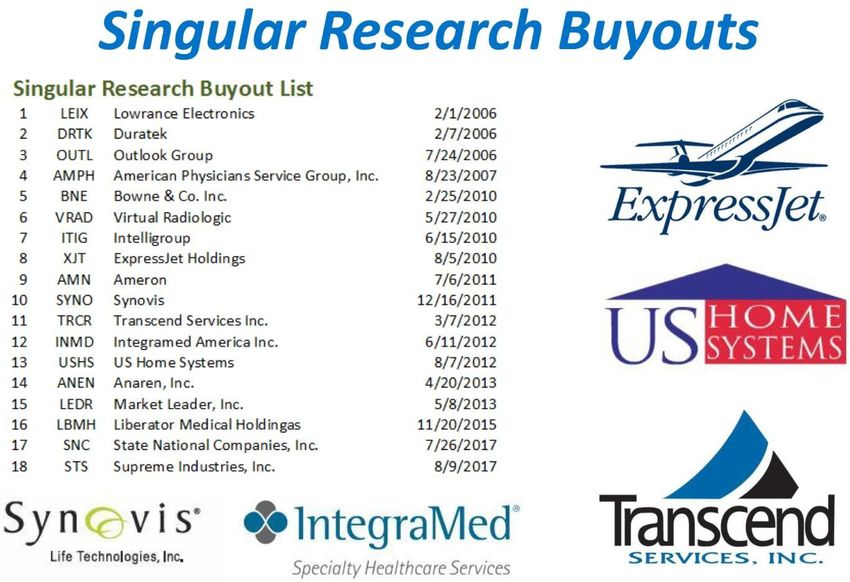
13th Annual Best of the Uncovereds2018

THANK YOU FOR ATTENDING & PARTICIPATING IN OUR CONFERENCE

                           Page 2 of 19
13th Annual Best of the Uncovereds 2018

             Page 3 of 19
13th Annual Best of the Uncovereds 2018

“We invite companies for one reason and one reason only: Because we believe they can
generate Alpha for our clients, not because they will pay, not because it will do investment
banking deals.”

Last year at our Midwestern Values Conference you could hardly avoid making money.

       •   General Finance (GFN) + 208%
       •   Emergent Bio-systems (EBS) + 55%
       •   Kulicke & Soffa (KLIC) + 27%
       •   Bladex (BLX) -22%
       •   Aceto which we dropped -20%.

We believe we have some very strong Alpha generating candidates again this year.”

--- Robert Maltbie, CFA
President, Singular Research

        Seeking Alpha is a crowd-sourced content service for financial markets.
    Stock market Insights & financial analysis, including free earnings call transcripts,
         investment ideas and ETF & stock research written by finance experts.

                       WHY SINGULAR RESEARCH?
                          •     Unbiased Equity Research
                          •     Focus on Uncovered Small Caps & Micro Caps
                          •     Superior Track Record
                          •     Experienced Staff of Analysts
                          •     Attractive Value Proposition
                          •     Superior ROI
                          •     Great value!

           Singular Express service is available for $99 month, with Seeking Alpha!
                   Singular Research Free Trial Subscription Link
                 https://seekingalpha.com/checkout?slug=singular-research

                                           Page 4 of 19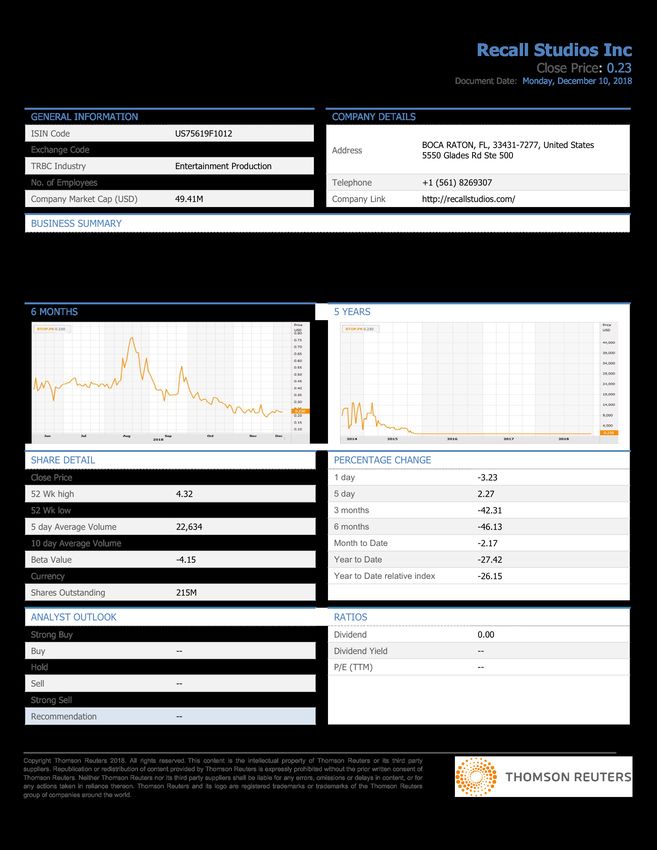
13th Annual Best of the Uncovereds 2018

             Page 5 of 19
Dallas Midwestern Values Conference 2018

         Singular Research
    22287 Mulholland Highway, #417
         Calabasas, CA 91302
            (818) 222-6234
      www.singularresearch.com

      ROBERT MALTBIE, CFA
              PRESIDENT
             (818) 222-6915
     Robert@singularresearch.com

          Alicia M. Velgos
     Marketing and Public Relations
            (818) 515-0344
     Alicia@singularresearch.com

               Tom Kill
           Institutional Sales
            (805) 260-4606
       tom@singularresearch.com

           Chris        Saki,
           CFA
           Institutional
           AnalystSales
           (818) 222-6234
      chris@singularresearch.com

              Page 6 of 19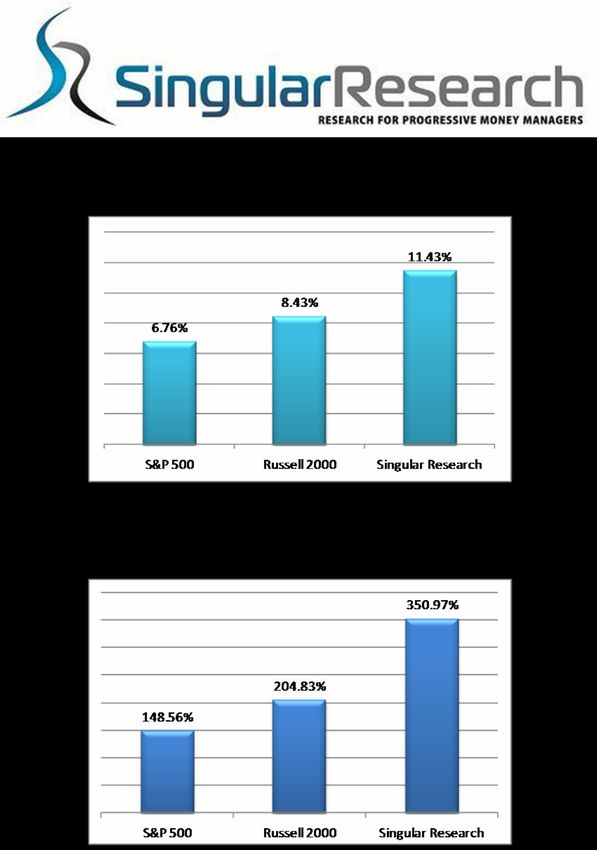
13th Annual Best of the Uncovereds 2018

                          13th Annual Best of the Uncovereds
                                        December 13th, 2018

          Time                 Ticker                   Company                    Speaker
8:30 PST AM (11:30 AM EST)     CYDY       CytoDyn Inc.                 Dr Nader Pourhassan/ CEO
9:00 PST AM (12:00 PM EST)     DAKT       Daktronics Inc.              Sheila Anderson/ CFO
9:30 PST AM (12:30 PM EST)     BIOL       Biolase                      John Beaver /CFO
10:00 PST AM (1:00 PM EST)     SALM       Salem Communications Corp.   Evan Mayr/CFO
10:30 PST AM (1:30 PM EST)     Singular Research: Man vs. ETF          Robert Maltbie CEO
11:00 PST AM (2:00 PM EST      CDB        Cordoba Minerals Corp.       Mario Stifano/ CEO & President
11:30 PST AM (2:30 PM EST)     QNST       Quinstreet, Inc.             Gregory Wong/ CFO
12:00 PST PM (3:00 PM EST)     BTOP       Recall studios Inc.          John C. Textor/ CEO
12:30 PST PM (3:30 PM EST)     HBIO       Harvard Bioscience           Jeff Duchemin/CEO
1:00 PST PM (4:00 PM EST)      NVEE       NV 5 Holdings                Michael Rama/CFO
1:30 PST PM (4:30 PM EST)      OESX       Orion Energy Systems, Inc    Michael W. Altschaefl/CEO
2:00 PST PM (5:00 PM EST)      Break
2:30 PST PM (5:30 PM EST)      SA         Seabridge Gold Inc.          Rudy Fronk/CEO
3:00 PST PM (6:00 PM EST)      ACU        Acme United Corp.            Walter Johnsen CEO
3:30 PST PM (6:30 PM EST)      JMP        JMP Group, LLC               Joe Jolson/ CEO
4:00 PST PM (7:00 PM EST)      EVIO       EVIO, Inc.                   William Waldrop/ CEO
*5:00 PST PM --- Cocktails at Hilton FInancial

                                                    Page 7 of 19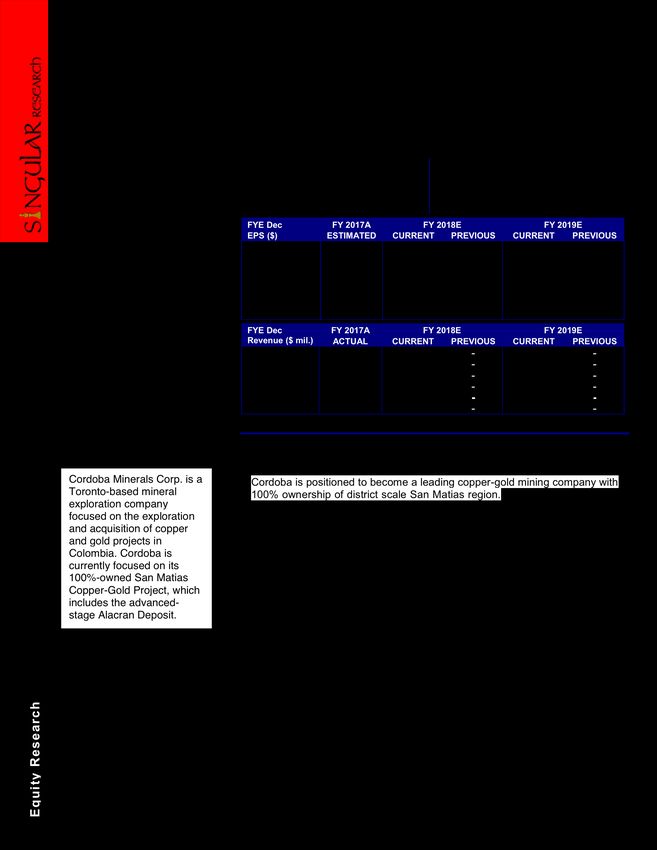
13th Annual Best of the Uncovereds 2018

                                                                                                                                                                        CytoDyn Inc
                                                                                                                                                                         Close Price: 0.58
                                                                                                                                                    Document Date: Monday, December 10, 2018

  GENERAL INFORMATION                                                                                        COMPANY DETAILS
  ISIN Code                                          US23283M1018
                                                                                                                                             VANCOUVER, WA, 98660-2970, United States
  Exchange Code                                      OTC                                                     Address
                                                                                                                                             1111 Main St Ste 660
  TRBC Industry                                      Biotechnology & Medical Research
  No. of Employees                                   6                                                       Telephone                       +1 (360) 9808524
  Company Market Cap (USD)                           147.34M                                                 Company Link                    https://www.cytodyn.com/

  BUSINESS SUMMARY
  CytoDyn Inc. is a clinical-stage biotechnology company. The Company is focused on the clinical development and commercialization of humanized monoclonal
  antibodies to treat Human Immunodeficiency Virus (HIV) infection. The Company's lead product candidate, PRO 140, belongs to a class of HIV therapies known as
  entry inhibitors that block HIV from entering into and infecting certain cells. The Company's product pipeline also includes Cytolin and CytoFeline. Cytolin is a mouse
  monoclonal antibody developed to identify a specific type of immune cell called a cytotoxic T cell, or cytotoxic T lymphocyte (CTL). CytoFeline is an anti-lymphocyte
  function-associated antigen-1 (LFA-1) antibody for the treatment of Feline Immunodeficiency Virus (FIV) infection. PRO 140 blocks HIV from entering a cell by binding
  to a molecule called C-C chemokine receptor type 5 (CCR5). The Company has finished Phase II clinical trials for PRO 140 with demonstrated antiviral activity in man.

  6 MONTHS                                                                                                    5 YEARS

  SHARE DETAIL                                                                                                PERCENTAGE CHANGE
  Close Price                                         0.58                                                    1 day                                       -2.75
  52 Wk high                                          0.84                                                    5 day                                       -1.27
  52 Wk low                                           0.40                                                    3 months                                    -4.51
  5 day Average Volume                                142,362                                                 6 months                                    23.91
  10 day Average Volume                               --                                                      Month to Date                               0.43
  Beta Value                                          0.24                                                    Year to Date                                5.79
  Currency                                            USD                                                     Year to Date relative index                 7.42
  Shares Outstanding                                  258M

  ANALYST OUTLOOK                                                                                             RATIOS
  Strong Buy                                          0                                                       Dividend                                    0.00
  Buy                                                 1                                                       Dividend Yield                              --
  Hold                                                0                                                       P/E (TTM)                                   --
  Sell                                                0
  Strong Sell                                         0
  Recommendation                                      Buy (2.00)

Copyright Thomson Reuters 2018. All rights reserved. This content is the intellectual property of Thomson Reuters or its third party
suppliers. Republication or redistribution of content provided by Thomson Reuters is expressly prohibited without the prior written consent of
Thomson Reuters. Neither Thomson Reuters nor its third party suppliers shall be liable for any errors, omissions or delays in content, or for
any actions taken in reliance thereon. Thomson Reuters and its logo are registered trademarks or trademarks of the Thomson Reuters
group of companies around the world.

                                                                                               Page 8 of 19
13th Annual Best of the Uncovereds 2018

c
h
r                                                                  Daktronics, Inc. (DAKT)
                  December 10, 2018                                DAKT reported better than expected Q2:19 revenues and EPS. We rate
se
a                                                                  these shares Buy and maintain our $10 target price.
e                 Price (as of close on
R                 Dec 7, 2018)
                                                                    52-Week Range             $7.14 – $10.11       Total Debt                    $15.7 mil
ar
l                 $8.25                                             Shares Outstanding           44.9 million      Debt/Equity                      4.2%
u                                                                   Insider/Institutional      18.5% / 56.7%       ROE (LTM)                         5.1%
g
ni                Rating                                            Public Float                  36.8 million     Book Value/Share                  $4.5
S                                                                   Market Capitalization       $375.5 million     Daily Volume (3 mo. Avg.)      151,542
                  BUY
                                                                    FYE APR             FY 2018A             FY 2019E                    FY 2020E
                  Price Target                                      EPS ($)             ACTUAL         CURRENT     PREVIOUS        CURRENT     PREVIOUS
                                                                    Q1 Jul                    $0.19A        $0.10A        $0.10A        $0.14E      $0.10E
                  $10.00                                            Q2 Oct                    $0.16A        $0.19A        $0.19E        $0.24E      $0.23E
                                                                    Q3 Jan                  ($0.14)A      ($0.04)E      ($0.05)E      ($0.03)E    ($0.02)E
                  Lisa Springer                                     Q4 Apr                  ($0.09)A      ($0.00)E      ($0.01)E        $0.01E      $0.02E
                  818-222-6234                                      Year                      $0.12A       $0.25E        $0.24E        $0.36E      $0.34E
                  research@singularresearch.com                     P/E Ratio                  67.1x         33.2x                       23.3x
                                                                    Change (%)               -46.6%        101.6%                       42.6%
                                                                    FYE APR            FY 2018A              FY 2019E                    FY 2020E
                                                                    Revenue ($ mil.)   ACTUAL            CURRENT PREVIOUS          CURRENT     PREVIOUS
                                                                    Q1 Jul                  $172.7A      $154.2A        $154.2A       $161.9E    $161.9E
                                                                    Q2 Oct                  $169.3A      $172.7A        $169.5E       $181.3E    $177.9E
                                                                    Q3 Jan                  $130.3A      $129.6E        $145.9E       $136.1E    $153.2E
                                                                    Q4 Apr                  $138.2A      $149.2E        $149.2E       $156.6E    $156.6E
                                                                    Year*                   $610.5A      $605.7E        $618.8E       $636.0E    $649.7E
                                                                    Change                     4.1%       -0.8%                          5.0%
                                                                   * Numbers may not add up due to rounding.

                                                                   Q2:19 Highlights
                                                               Ø     Q2:19 revenues were $172.7 million, up 2% YOY as a result of good performances
                                                                     across the Commercial (+34.0% YOY), Transportation (+9.7% YOY), High School
                                                                     & Recreation (+6.5% YOY) and International (+8.6% YOY) business units. DAKT
                                                                     ended the quarter with a backlog up 6.4% YOY to $151 million.
                                                               Ø     Q2:19 gross margins dropped 40 basis points to 24.8% from 25.2% in Q2:18
                                                                     primarily due to higher commodity costs.
                                                               Ø     Overall orders rose 6.4% and increased in the Commercial, High School Park and
                                                                     Recreation and Transportation business units. Orders fell in the Live Events and
                                                                     International business units.
                                                               Ø     EPS improved 19% YOY to $0.19 in Q2:19 from $0.16 in Q2:18.
                                                               Ø     Management expects modest sales declines in Q3:19, causing us to reduce our
                                                                     Q3:19 EPS estimate.
                                                               Ø     Management’s favorable comments regarding DAKT’s longer-term outlook are
                                                                     reflected in our increased FY:20 EPS estimates. We rate these shares a Buy, and
                                                                     reiterate our $10 target price, which implies capital appreciation potential of
                                                                     approximately 20%.
                   Company Description
                   Daktronics, Inc. is the world’s leading           PRIMARY RISKS
                   supplier of electronic scoreboards, large
                   electronic display systems, and digital           Ø DAKT’s results can be negatively impacted by weak economic activity; rising
                   messaging solutions for use in sports,            commodity input costs; timing of customer orders; foreign exchange fluctuations;
                   transportation, and communications.
                                                                     and competitor pricing
                                                                     Ø There are significant competitors in many of the firm's operating segments,
                                                                     including large multi-nationals such as Mitsubishi and Panasonic, and DAKT may
Equity Research

                                                                     lack resources to compete effectively.

                                          Please refer to the end of this report to obtain important disclosure information.

                                                                              Page 9 of 19
13th Annual Best of the Uncovereds 2018

Singular Research

                                                                  Biolase (BIOL)
                    November 15, 2018                             US laser sales improve 22% YOY. Sales efforts in southern CA
                    Price (as of close on                         produce 127% YOY laser sales growth in that market and BIOL
                    November 14, 2018)                            launches a similar regional initiative in Dallas/Fort Worth. We maintain
                    $1.24                                         our BUY Long-term rating and $4.00 buyout-based price target.

                    Rating                                         52-Week Range                $1.53 – $3.05    LT Debt (millions)                    $0.2
                                                                   Shares Outstanding             20.6 million   Debt/Equity                         0.01%
                    BUY Long-term                                  Insider/Institutional           31% /35%      ROE (LTM)                              NM
                                                                   Public Float                   14.4 million   Book Value/Share                     $0.92
                    Buyout-based Price Target                      Market Capitalization         $28.5 million   Daily Volume                        57.4k
                    $4.00                                          FYE DEC              FY 2017A           FY 2018E                    FY 2019E
                                                                   EPS* ($)             ACTUAL        CURRENT    PREVIOUS         CURRENT    PREVIOUS
                                                                   Q1 Mar                ($0.25) A      ($0.23) A    ($0.23) A        ($0.18) E   ($0.21) E
                    Lisa Springer                                  Q2 Jun                ($0.20) A      ($0.20) A    ($0.20) A        ($0.11) E   ($0.13) E
                    818-222-6234                                   Q3 Sep                ($0.20) A      ($0.19) A    ($0.21) E        ($0.15) E   ($0.17) E
                    research@singularresearch.com                  Q4 Dec                ($0.25) A      ($0.16) E    ($0.17) E        ($0.11) E   ($0.11) E
                                                                   Year*                 ($0.90) A      ($0.78) E    ($0.81) E        ($0.54) E   ($0.62) E
                                                                   P/E Ratio                   NM             NM                            NM
                                                                   Change
                                                                   FYE DEC             FY 2017A            FY 2018E                    FY 2019E
                                                                   Revenue ($ mil.)    ACTUAL         CURRENT    PREVIOUS         CURRENT    PREVIOUS
                                                                   Q1 Mar             $10.9 A            $10.0 A      $10.0 A          $11.0 E    $11.0 E
                                                                   Q2 Jun             $12.7 A            $12.2 A      $12.2 A          $13.4 E    $13.4 E
                                                                   Q3 Sep             $10.8 A            $10.9 A      $11.1 E          $12.0 E    $12.2 E
                                                                   Q4 Dec             $12.6 A            $13.0 E      $13.2 E          $14.3 E    $14.6 E
                                                                   Year*              $46.9 A            $46.1 E      $46.6 E          $50.7 E    $51.2 E
                                                                   Change             -9%                   -2%          -                10%        -
                                                                  * Adjusted EPS. Numbers may not add up due to rounding.

                                                                  Q3:18 Performance
                                                              Ø     Q3:18 sales increase 1% YOY to $10.9 million as strong gains in US laser sales
                                                                    are offset by lower sales of non-core imaging products. Excluding these non-core
                                                                    products, revenues increase 9% YOY. US laser sales increase 22% YOY and
                                                                    sales of consumable products rise 9% YOY.
                                                              Ø     More than 62% of all-tissue laser sales made during Q3:18 were to new
                                                                    customers, boding well for future recurring revenues from consumables sales.
                                                              Ø     The Southern CA-focused marketing initiative continues to deliver strong results
                     Company Description                            with all-tissue later sales up 127% YOY in that market. BIOL measures success
                     Biolase (BIOL) is a world leader in            by sequential and YOY sales growth, increasing customer awareness and new
                                                                    customer captures.
                     the emerging market for dental
                     lasers. To date, the Company has         Ø     Late in Q3:18, BIOL rolled out a similar regionally-focused sales initiative in the
                     installed more than 33,000 dental              Dallas/Fort Worth market, where more than 350 dental offices have already been
                     lasers in over 90 countries.                   visited by BIOL reps.
                     Compared to traditional dental           Ø     New CEO Todd Norbe shared a performance goal of BIOL turning EBITDA-
                     instruments, lasers cause less                 positive approximately four quarters from now in Q4:19.
                     trauma, pain and bleeding and            Ø     $12.5 million secured from a new term loan should provide sufficient funding to
                     improve patient outcomes. BIOL                 support BIOL’s operations until it meets its Q4:19 goal of EBITDA profits.
                     sells its dental lasers and related      Ø     The outlook for laser and consumable sales is improving, although BIOL remains
                     products direct in the US, Canada,             several quarters away from profitable growth. We determine a price target based
                     Germany and India and through                  on BIOL’s value as a potential JV partner or takeover candidate. Our $4 price
                                                                    target assumes a buyout of BIOL at roughly 2X revenues. We thus rate BIOL
Equity Research

                     distributors in other countries. The
                                                                    shares BUY Long-term and reiterate our $4 price target.
                     Company is headquartered in
                     Irvine, CA.
                                                                    PRIMARY RISKS
                                                              Ø     BIOL has recorded consecutive years of net losses. We anticipate quarterly net
                                                                    losses in FY:18 and FY:19.

                                            Please refer to the end of this report to obtain important disclosure information.

                                                                              Page 10 of 19
13th Annual Best of the Uncovereds 2018
November 12, 2018
Salem Media Group (SALM)
Q3:18 operating income improves 25.4% YOY due mainly to
Price (as of close on expense declines on slight revenue gains. EPS rises to $0.05.
November 9, 2018)
Political ad spending likely to exceed $4 million for 2018. We
$3.05 maintain our Buy Rating and $6.00 price target.
Rating
52-Week Range $2.88 – $6.25 LT Debt (million) $240.2
BUY Shares Outstanding 26.3 million LT Debt/Equity 106%
Insider/Institutional 46% /40% ROE (TTM) 11.0%
12- Month Target Price Public Float 12.2 million Book Value/Share $8.61
$6.00 Market Capitalization $80.4 million Daily Volume (90 day Avg) 64.0k
FYE DEC 2017 2018E 2019E
EPS($) ACTUAL CURRENT PREVIOUS CURRENT PREVIOUS
Lisa Springer Q1 Mar $0.04A $0.03A $0.03A $0.08E $0.08E
818-405-0242 Q2 Jun $0.05A ($0.08)A ($0.08)A $0.07E $0.10E
research@singularresearch.com Q3 Sep $0.00A $0.05A $0.09E $0.03E $0.07E
Q4 Dec $0.85A $0.07E $0.14E $0.06E $0.13E
Year* $0.94A $0.07E $0.19E $0.24E $0.38E
P/E Ratio 3.2x 43.5x 12.7x
Change 242%
FYE DEC 2017A 2018E 2019E
Revenue ($ mil.) ACTUAL CURRENT PREVIOUS CURRENT PREVIOUS
Q1 Mar $65.0A $63.8A $63.8A $64.4E $62.5E
Q2 Jun $66.1A $66.3A $66.3A $66.9E $65.6E
Q3 Sep $65.4A $65.5A $66.1E $64.9E $64.87E
Q4 Dec $67.2A $66.5E $69.9E $65.2E $68.5E
Year $263.7A $262.1E $266.1E $261.4E $261.4E
Change -1% -1%
• Numbers may not add up due to rounding and may be pro-forma.
Q3:18 HIGHLIGHTS
Ø Total revenues rise 0.1% to $65.5 million as improvements in Broadcast
revenues offset flat Digital Media revenues and lower Publishing revenues.
Ø Broadcast revenues rise 0.8% YOY to $48.8 million. Same station Broadcast
revenues improve 1.9% YOY to $47.8 million and same station operating
income improves 2.3% to $12.1 million, marking the for the third consecutive
quarter of growth.
Company Description
Salem Media Group is America’s Ø Digital Media revenues remained flat YOY at $10.4 million. Publishing
leading Christian and conservative revenues drop 3.7% YOY to $6.3 million due to a reduced pipeline in the self-
multi-media company. The publishing business which SALM is in the process of rebuilding.
Company operates through Radio
Broadcast, Digital Media and Ø Corporate expenses decline 5.8% YOY to less than $4.0 million as a result of
Publishing segments. It owns and reduced spending for professional services and stock-based compensation.
operates 116 radio stations, many
in the top 25 media markets, and Ø Long-term debt declines to $240.2 million from $249.6 million at the beginning
produces several of the largest of this year.
nationally syndicated radio shows
Ø SALM records a Q3:18 EPS of $0.05 versus EPS of $0.00 one year ago. The
on the air today.
gain is due to higher revenues and lower corporate expense, which more than
Equity Research
offset increases in Broadcast expense and interest expense.
Ø We derive a $6 price target by applying a 0.7x P/B multiple to SALM’s book
value of $8.61 per share.
Please refer to the end of this report to obtain important disclosure information.
Page 11 of 1913th Annual Best of the Uncovereds 2018
NEED An update
BARRON’S
Q&A
2 Unloved Stocks to Buy And 3 To Dump (or
Short)
Millennium Asset's Robert Maltbie likes to buy hidden
gems and bet against overhyped growth stocks.
Robert Maltbie began his career as a retail stockbroker for Dean Witter and quickly learned
that there was more to job than understanding the nuances of buy and hold ratings. He saw
firsthand the inevitable conflicts of interest posed by investment banking, and came to
recognize the steep odds against individual investors.
So in 1999, he set out on his own, launching Calabasas, Calif.-based Millennium Asset
Management, specializing in smaller, underfollowed companies on the long side and bigger
companies on the short side. In 2005, he founded Singular Research, which now sells
small-cap research to Fidelity Investments and other big money managers. Four years ago,
Maltbie returned full time to his first love, managing money. Today, Millennium Asset
Management manages about $150 million, including a hedge fund called Argonaut
Partners, which began operations in 2005. Last year, Maltbie, 55, launched a mutual fund
called LoCorr Long/Short Equity I (ticker: LEQIX). Both buy undercovered smaller
companies that have historically traded at a 20% to 30% valuation discount and short mid-
to large-cap companies whose prospects Maltbie thinks are deteriorating. After a strong
performance out of the gate, the LoCorr fund is down sharply this year as investors sell off
smaller companies. Some of Maltbie's holdings also had growing pains, including Advanced
Emissions, the largest position in the LoCorr fund. But Maltbie is staying put in the sector,
arguing that eventually institutions will discover the charms of the names he owns, prices
will climb, and the companies will be added to the indexes. The LoCorr fund's longer-term
performance, he maintains, will rebound: Argonaut, which is almost "a mirror image," has
returned 11.3% a year since inception, versus 7.4% for the Russell 2000 and 0.53% for the
HFRX Equity Hedge index. As the market rises, Maltbie's research is also turning up a
number of short positions. To learn what they are, keep reading.
Analyst Bio
Name: Robert Maltbie Jr.
Age: 55
Title: President, chief investment officer, Millennium Asset Management, Calabasas, Calif.; Chairman, Singular Research
Education: B.A., political science, UCLA
Hobbies: Basketball, golf, movie going
Page 12 of 1913th Annual Best of the Uncovereds 2018
Page 13 of 1913th Annual Best of the Uncovereds 2018
c
rh QuinStreet Inc. (QNST)
Nov 8, 2018 The company announced better than expected revenue and adjusted
se
a EBITDA versus our estimates. We remain optimistic on QNST’s growth
e Price (as of close on Nov 7,
R 2018) prospects amid investments in new products and media strategies. The
ar
l $17.48 ongoing shift from traditional to digital ad spending is a secular trend and
u will provide a significant tailwind to QNST. We maintain our BUY rating and
g
ni Rating increase our target price to $20.00 per share.
S
BUY 52-Week Range $8.24 – $17.52 Total Debt $0.0 mil
Shares Outstanding 49.1 million Debt/Equity 0.0%
Price Target Insider/Institutional 11.4% / 87.6% ROE (LTM) 6.5%
$20.00 Public Float 42.5 million Book Value/Share $5.9
Market Capitalization $857.9 million Daily Volume (3 mo. Avg.) 761,938
FYE JUNE FY 2017A FY 2018A FY 2019E
Staff
EPS ($) ACTUAL CURRENT PREVIOUS CURRENT PREVIOUS
818-222-6234
research@singularresearch.com Q1 Sep $0.01A $0.08A $0.08A $0.14A $0.10E
Q2 Dec $(0.04)A $0.07A $0.07A $0.11E $0.10E
Q3 Mar $0.06A $0.16A $0.16A $0.18E $0.21E
Q4 Jun $0.06A $0.13A $0.14A $0.20E $0.19E
Year* $0.11A $0.45A $0.46A $0.63E $0.61E
P/E Ratio 158.9x 38.6x 27.7x
Change 569.1% 311.5% 39.4%
FYE JUNE FY 2017A FY 2018A FY 2019E
Revenue ($ mil.) ACTUAL CURRENT PREVIOUS CURRENT PREVIOUS
Q1 Sep $73.4A $87.4A $87.4A $112.8A $102.3E
Q2 Dec $65.6A $87.5A $87.5A $106.7E $94.4E
Q3 Mar $79.2A $117.9A $117.9A $129.7E $129.7E
Q4 Jun $81.5A $111.5A $97.0A $127.1E $127.1E
Year* $299.8A $404.3A $389.8A $476.4E $453.6E
Change 0.7% 34.9% 17.8%
* Numbers may not add up due to rounding.
* All numbers are non-GAAP.
Q1:19 Highlights
Ø Q1:19 revenues were $112.9 million, up 29% from Q1:18, on account of strong
performance across all business verticals.
Ø The Financial services client vertical represented 69% of Q1:19 revenues and
grew 32% YOY; the education client vertical represented 20% of Q1:19 revenues
and grew 24% YOY; the home services vertical and B2B technology sector
represented the remaining 11% of Q1:19 revenues and grew 22% YOY.
Ø Management sounded cautious regarding the Education vertical in the near term,
though their long-term outlook remains optimistic.
Company Description Ø Adjusted EBITDA in Q1:19 was $10.3 million vs. $6.5 million in Q1:18, an increase
of ~56% YOY.
QuinStreet Inc. specializes Ø Management expects FY 2019 revenue to be up at least 15 to 20% YOY and
in performance marketing adjusted EBITDA margin to expand to ~10%.
products and technologies. Ø We marginally adjust our estimates based on the quarter end results and
The company serves clients management commentary. We maintain our BUY rating and increase our target
in high-value, high- price to $20.00, with an implied capital appreciation potential of 14%.
consideration market
verticals, including financial PRIMARY RISKS
services, IT / technology,
home services and Ø Client concentrations remain a key risk. A loss of a key client or a failure to
education. renew a large contract could significantly impact financial results.
Ø A reduction in digital marketing spending due to an economic downturn could
negatively impact earnings.
Please refer to the end of this report to obtain important disclosure information.
Page 14 of 1913th Annual Best of the Uncovereds 2018
Page 15 of 1913th Annual Best of the Uncovereds 2018
Singular Research
Harvard Bioscience (HBIO)
November 6, 2018 HBIO delivers 15% YOY revenue growth and 33% gain in non-GAAP
Price (as of close EPS. The recently acquired DSI business was the primary contributor
on November 5, 2018) to sales growth, with DSI sales up 19% YOY. We reiterate our BUY
$4.06 rating and $6.50 target price.
Rating 52-Week Range $2.95 – $6.70 LT Debt (millions) $59.3
Shares Outstanding 37.3 million Debt/Equity 73%
BUY Insider/Institutional 13% /76% ROE (LTM) 8.7%
Public Float 32.0 million Book Value/Share $2.19
12- Month Target Price Market Capitalization $152.9 million Daily Volume 221.0k
$6.50 FYE DEC FY 2017A FY 2018E FY 2019E
EPS* ($) ACTUAL CURRENT PREVIOUS CURRENT PREVIOUS
Q1 Mar $0.02A $0.03A $0.03A $0.04E $0.01E
Lisa Springer Q2 Jun $0.03A $0.07A $0.07A $0.10E $0.08E
818-222-6234 Q3 Sep $0.03A $.0.04A $0.04E $0.06E $0.05E
research@singularresearch.com Q4 Dec $0.05A $0.07E $0.07E $0.10E $0.09E
Year* $0.12A $0.20E $0.20E $0.29E $0.23E
P/E Ratio 33.8x 20.3x 14.0x
Change 67% 45%
FYE DEC FY 2017A FY 2018E FY 2019E
Revenue ($ mil.) ACTUAL CURRENT PREVIOUS CURRENT PREVIOUS
Q1 Mar $24.2A $27.7A $27.7A $28.5E $27.6E
Q2 Jun $25.2A $31.5A $31.5A $32.5E $32.5E
Q3 Sep $25.1A $28.6A $$29.6E $29.5E $30.0E
Q4 Dec $27.5A $32.0E $33.0E $33.0E $33.9E
Year* $101.9A $120.0E $120.8E $123.5E $124.5E
Change 18% - 3% -
* Non-GAAP EPS. Numbers may not add up due to rounding.
Q3:18 Highlights
Ø GAAP revenues improve 53% YOY. Non-GAAP revenues, which include
revenues generated by the divested Denville business, improved 15% YOY. The
acquired DSI business was the primary growth driver. Ex DSI, organic sales
declined 6% YOY.
Ø The electrophysiology business was the main reason for the organic sales
decline, which HBIO attributed to timing-related issues, with some anticipated Q3
Company Description
orders rolling instead into Q4, and some customers who have in the past ordered
Harvard Bioscience (HBIO) through the electrophysiology segment placing their orders instead through DSI.
develops, manufactures and
markets scientific equipment, Ø Reflecting the contribution from higher margin DSI products, non-GAAP gross
systems and consumables that are margins rose 920 basis points YOY from 46.6% to 55.8%. This is in-line with
used by thousands of researchers HBIO’s non-GAAP gross margin target of 54% to 57%.
worldwide. The Company was Ø DSI contributed approximately $11.2 million or 39% of Q3:18 revenues. The DSI
founded in 1901 by a Harvard business, which was acquired in January, improves the diversification of HBIO’s
Medical School professor and has customer base, contributes higher margin products and is expected to deliver
grown through a combination of between $2.5 million and $3.5 million of combined top-and-bottom-line synergies.
new products and acquisitions. Ø HBO launched product line extensions within its BTX and Harvard Apparatus
HBIO is headquartered in Holliston, brands and new DSI software enhancements during Q3. Several new
Massachusetts and has sales electrophysiology products are scheduled to launch at the Society for
and/or manufacturing operations in Neuroscience annual meeting in November. This is HBIO’s largest industry trade
the US and Canada, the UK, show.
Equity Research
Germany, Sweden France, Spain Ø We reiterate our BUY rating and target price of $6.50.
and China.
PRIMARY RISKS
Ø HBIO is a small player in an industry dominated by large global companies.
Ø The Company derives approximately 40% of revenues from outside the US and
is affected by foreign currency fluctuations.
Please refer to the end of this report to obtain important disclosure information.
Page 16 of 1913th Annual Best of the Uncovereds 2018
c
rh NV5 Global, Inc. (NVEE)
Nov 13, 2018 NVEE reports 14% increase in Q3:18 revenues and 9% adjusted EPS
se
a growth. High single-digit organic growth, a strong M&A pipeline and new
e Price (as of close on
R Nov 12, 2018) project wins position NVEE for continued robust gains. NVEE shares are
ar
l $81.10 up more than 50% YTD. We rate these shares BUY and reiterate our $100
u price target.
g
ni Rating
S 52-Week Range $40.01 – $96.70 Total Debt $35 million
BUY Shares Outstanding 12.5 million Debt/Equity 3.5%
Insider/Institutional 22.2% / 54.5% ROE (LTM) 14.1%
Price Target Public Float 9.9 million Book Value/Share $25.92
$100.00 Market Capitalization $1.0 billion Daily Volume (3 mo. Avg.) 81,061
FYE DEC FY 2017A FY 2018E FY 2019E
EPS ($) ACTUAL CURRENT PREVIOUS CURRENT PREVIOUS
Lisa Springer Q1 Mar $0.39A $0.59A $0.59A $0.70E $0.72E
818-222-6234 Q2 Jun $0.56A $0.91A $0.91A $0.94E $1.16E
research@singularresearch.com Q3 Sep $0.75A $0.82A $0.98E $0.98E $1.37E
Q4 Dec $0.71A $0.94E $0.86E $1.23E $1.23E
Year* $2.38A $3.27E $3.25E $3.84E $4.48E
P/E Ratio 34.1x 24.8x 21.1x
Change 55.9% 37.5% 17.5%
FYE DEC FY 2017A FY 2018E FY 2019E
Revenue ($ mil.) ACTUAL CURRENT PREVIOUS CURRENT PREVIOUS
Q1 Mar $64.0A $94.5A $94.5A $115.3E $115.3E
Q2 Jun $83.7A $104.0A $104.0A $126.9E $126.9E
Q3 Sep $91.2A $104.2E $109.5E $127.1E $133.6E
Q4 Dec $93.9A $120.2E $108.0E $146.7E $131.8E
Year* $333.0A $423.0E $416.1E $516.0E $507.6E
Change 48.7% 27.0% 22.0%
* Numbers may not add up due to rounding.
* All numbers are non-GAAP.
Q3:18 Highlights
Ø Q3:18 revenues rise 14% YOY to $104.1 million, fueled by 8% organic growth
and contributions from recent acquisitions. The Company exited the quarter
with backlog up 24.6% YOY to $342.3 million and 8.6% higher sequentially.
Company Description NVEE targets FY:18 revenues 25-29% higher at $415-$430 million.
NV5 Global, Inc. is a provider of Ø EBITDA improved 10% YOY to $14 million and EBITDA margins were flat at
professional and technical engineering and
consulting solutions in the infrastructure,
17% in Q3:18 versus Q3:17.
energy, construction, real estate and Ø Adjusted EPS grew 9.3% YOY. NVEE is guiding for FY:18 adjusted EPS 36-
environmental markets. The Company’s
clients include the U.S. federal, state and 45% higher at $3.23-$3.43.
local governments, and the private sector.
Ø During Q3, the Company was awarded a $5 million contract with the New Jersey
Equity Research
DOT, a $10 million contract with the New York City DOT and a $20 million contract
with California Transportation District 10.
Ø NVEE continues to have plenty of acquisition candidates in the pipeline that can
expand its geographic footprint and service lines. The November acquisition of CHI
Engineering provides a strong platform for NVEE’s expansion in the LNG, LPG and
natural gas markets.
Ø We rate these shares BUY-Long-Term and reiterate our $100 price target.
PRIMARY RISKS
Ø An economic downturn could restrict the Company’s access to capital markets
and slow acquisition-related growth.
Please refer to the end of this report to obtain important disclosure information.
Page 17 of 1913th Annual Best of the Uncovereds 2018
Orion Energy Systems, Inc.
Close Price: 0.74
Document Date: Monday, December 10, 2018
GENERAL INFORMATION COMPANY DETAILS
ISIN Code US6862751087
Exchange Code NAQ MANITOWOC, WI, 54220-9662, United States
Address
2210 Woodland Dr
Electrical Components &
TRBC Industry
Equipment
No. of Employees 153 Telephone +1 (800) 6609340
Company Market Cap (USD) 21.28M Company Link http://www.oesx.com/
BUSINESS SUMMARY
Orion Energy Systems, Inc. is a designer and manufacturer of lighting platforms. The Company researches, develops, designs, manufactures, markets, sells and
implements energy management systems consisting primarily of commercial and industrial interior and exterior lighting systems, and related services. The Company
operates through three segments: Orion U.S. Markets Division (USM), Orion Engineered Systems Division (OES) and Distribution Services Division (ODS). The USM
division develops and sells its commercial lighting systems and energy management systems to the wholesale contractor markets. The OES division develops and sells
lighting products, and provides construction and engineering services for its commercial light emitting diode (LED) and high intensity fluorescent (HIF) lighting and
energy management systems. The ODS division focuses on selling its lighting products through manufacturer representative agencies and a network of broadline North
American distributors.
6 MONTHS 5 YEARS
SHARE DETAIL PERCENTAGE CHANGE
Close Price 0.74 1 day 1.02
52 Wk high 1.25 5 day -7.19
52 Wk low 0.68 3 months -20.59
5 day Average Volume 77,733 6 months -11.61
10 day Average Volume 53,610 Month to Date -2.50
Beta Value 0.15 Year to Date -15.62
Currency USD Year to Date relative index -16.42
Shares Outstanding 30M
ANALYST OUTLOOK RATIOS
Strong Buy 0 Dividend 0.00
Buy 1 Dividend Yield --
Hold 2 P/E (TTM) --
Sell 0
Strong Sell 0
Recommendation Hold (2.67)
Copyright Thomson Reuters 2018. All rights reserved. This content is the intellectual property of Thomson Reuters or its third party
suppliers. Republication or redistribution of content provided by Thomson Reuters is expressly prohibited without the prior written consent of
Thomson Reuters. Neither Thomson Reuters nor its third party suppliers shall be liable for any errors, omissions or delays in content, or for
any actions taken in reliance thereon. Thomson Reuters and its logo are registered trademarks or trademarks of the Thomson Reuters
group of companies around the world.
Page 18 of 1913th Annual Best of the Uncovereds 2018
Page 19 of 1913th Annual Best of the Uncovereds 2018
c
h
r Acme United Corp. (ACU)
November 6, 2018 The third quarter results were below our expectations with both revenue
se
a and EPS missing our projections. The management also lowered its 2018
e Price (as of close on Nov 5,
R 2018) guidance marginally. However, robust product pipeline and productivity
ar
l $17.75 initiatives gives us optimism for solid earnings growth beyond FY18. We
u maintain our BUY rating and lower our target price to $22.5 per share.
g
n
i Rating
S 52-Week Range $15.31 – $25.55 Total Debt $50.5 mil
BUY Shares Outstanding 3.4 million Debt/Equity 83.8%
Insider/Institutional 12.2% / 59.9% ROE (LTM) 6.4%
Price Target Public Float 2.9 million Book Value/Share $14.7
$22.5 Market Capitalization $60.3 million Daily Volume (3 mo. Avg.) 5,626
FYE DEC FY 2017A FY 2018E FY 2019E
EPS ($) ACTUAL CURRENT PREVIOUS CURRENT PREVIOUS
Jim Marrone, B. Sc., MBA, CFA Q1 Mar $0.18A $0.21A $0.21A $0.23E $0.25E
818-222-6915 Q2 Jun $0.75A $0.67A $0.67A $0.72E $0.75E
research@singularresearch.com Q3 Sep $0.32A $0.23A $0.36E $0.30E $0.54E
Q4 Dec $0.16A $0.18E $0.19E $0.24E $0.24E
Year* $1.42A $1.30E $1.53E $1.49E $1.78E
P/E Ratio 12.5x 13.7x 12.0x
Change -13.1% -8.8% 14.8%
FYE DEC FY 2017A FY 2018E FY 2019E
Revenue ($ mil.) ACTUAL CURRENT PREVIOUS CURRENT PREVIOUS
Q1 Mar $27.7A $31.7A $29.8E $33.9E $33.9E
Q2 Jun $38.8A $39.7A $39.7A $40.9E $40.9E
Q3 Sep $33.8A $34.7A $36.3E $36.8E $38.6E
Q4 Dec $30.1A $32.5E $32.5E $34.5E $34.7E
Year* $130.5A $138.7E $140.3E $146.2E $148.2E
Change 4.8% 6.3% 5.4%
* Numbers may not add up due to rounding.
* All numbers are non-GAAP.
Q3:18 Highlights
Ø Q3:18 revenues were $34.7 million, up 3% from Q3:17, on account of strong
performance across US (+3% YOY), Europe (+2% YOY) and Canada (+2%
YOY). The results were driven by strong sales of first aid products, Camillus and
DMT sharpening tools.
Ø Online sales were strong in 3Q18 though slightly weak compared to previous quarters.
Online sales have increased in excess of 100% annually for the past three years.
Ø Gross Margins for Q3:18 were 36%, which was flat compared to 36% in Q3:17.
Ø Earnings per share in Q3:18 was $0.23 vs. $0.32 in Q3:17, a decrease of ~28%
YOY.
Ø The management guided for sales of ~$139 million, net income of $4.7 million
and earnings per share of $1.30.
Company Description Ø We lower our earnings estimates for FY:18 to $1.30 per share factoring in the
latest management commentary. We maintain our BUY rating and lower our
Acme United Corporation is one of the
largest worldwide suppliers of innovative
target price to $22.5, with an implied capital appreciation potential of ~26%.
cutting devices, measuring instruments
and safety products for the school, home, PRIMARY RISKS
office and industrial markets. The company
has facilities in the U.S., Canada, England, Ø ACU’s results can be negatively impacted by weak economic activity; rising
Germany, Hong Kong and China. Acme commodity input costs; timing of customer orders; foreign exchange fluctuations;
sells its products in countries. It had 421 and competitor pricing
Equity Research
employees at the end of 2017.
Ø There are significant competitors in the firm's operating segments, including
J&J and Fiskars, and barriers to entry are relatively low
Please refer to the end of this report to obtain important disclosure information.
Page 20 of 1913th Annual Best of the Uncovereds 2018
Page 21 of 1913th Annual Best of the Uncovereds 2018
c
h
r EVIO Inc. (EVIO)
October 4, 2018 EVIO announced subdued Q3:18 results with revenues decreasing 18.3%
se
a to $634,338 much below our estimates. However, we remain optimistic on
e Price (as of close on Oct 3,
R 2018) EVIO’s growth prospects amid the rollout of new laboratories and
ar
l $0.85 equipment upgrades at existing facilities. Favorable sector tailwinds
u (cannabis industry set to double by 2021) should drive growth as well. We
g
ni Rating maintain our BUY rating and lower our target price of $1.75 per share.
S
BUY 52-Week Range $0.47 – $2.70 Total Debt $4.2 mil
Shares Outstanding 22.8 million Debt/Equity 20.6%
Price Target Insider/Institutional 19.9% / 0.0% ROE (LTM) (288.7%)
$1.75 Public Float 20.0 million Book Value/Share $0.21
Market Capitalization $20.3 million Daily Volume (3 mo. Avg.) 139,749
FYE SEP FY 2017A FY 2018E FY 2019E
Staff
EPS ($) ACTUAL CURRENT PREVIOUS CURRENT PREVIOUS
818-222-6234
research@singularresearch.com Q1 Dec $(0.09)A ($0.04)A $(0.04)A ($0.04)E ($0.01)E
Q2 Mar $(0.06)A ($0.05)A $(0.05)A ($0.04)E ($0.04)E
Q3 Jun $(0.05)A ($0.11)A $(0.05)E ($0.04)E ($0.04)E
Q4 Sep $(0.17)A ($0.04)E $(0.05)E ($0.04)E ($0.03)E
Year* $(0.37)A ($0.25)E $(0.19)E ($0.16)E ($0.12)E
P/E Ratio NM NM NM
Change -25.4% -31.4% -35.0%
FYE SEP FY 2017A FY 2018E FY 2019E
Revenue ($ mil.) ACTUAL CURRENT PREVIOUS CURRENT PREVIOUS
Q1 Dec $0.7A $0.9A $0.9A $1.6E $1.6E
Q2 Mar $0.8A $0.7A $0.7A $1.2E $1.2E
Q3 Jun $0.8A $0.6A $1.7E $1.0E $2.9E
Q4 Sep $0.7A $1.5E $1.5E $2.5E $2.5E
Year* $3.0A $3.8E $4.8E $6.4E $8.4E
Change 438.5% 26.2% 69.9%
* Numbers may not add up due to rounding.
* All numbers are non-GAAP.
Q3:18 Highlights
➢ Q3:18 revenues were $634,338, down 18.3% from Q3:17, on account of subdued
performance of testing services segment. Testing service segment revenues were
down 22.4% to $595,701. While consulting services segment was up ~313.5% to
$38,637.
➢ EVIO suffered a gross loss of $195,113 in Q3:18 vs. gross profit of $122,954 during
Q3:17. This was primarily attributable to lower revenues and higher cost of revenue.
➢ EVIO was focused greatly on broadening its footprint. The company expanded its
presence in California by acquiring additional labs as well as have plans to open
Company Description two more labs in the region by the end of 2018.
EVIO Inc. is a leading provider of quality ➢ EVIO invested heavily in new equipment upgrades at its labs which should result
control testing, consulting and advisory in increased testing volumes and higher operating efficiency.
services to the cannabis industry. The ➢ The management does not provide any guidance, though company’s CEO, Mr.
company owns 9 laboratories serving five William Waldrop sounded optimistic about the growth in 2018.
states in the US – California, Colorado,
Massachusetts, Oregon and Florida.
➢ We adjust our estimates based on the results and management commentary. We
maintain our BUY rating and lower our target price of $1.75, with an implied capital
appreciation potential of 97%.
Equity Research
PRIMARY RISKS
➢ Delay in executing the planned expansion or improvement projects at its
properties remains a concern
➢ The growth of cannabis testing market is subjected to favorable regulatory
environment. Any adverse regulation could materially impact growth trajectory.
Please refer to the end of this report to obtain important disclosure information.
Page 22 of 19Dallas Midwestern Values Conference 2018
Conference
Personal Notes Section
THANK YOU FOR ATTENDING & YOUR PARTICIPATION
Page 23 of 19Dallas Midwestern Values Conference 2018
22287 Mulholland Highway, #417
Calabasas, CA 91302
(626) 405-0245
www.singularresearch.com
Page 24 of 19You can also read