UNLIMITED TRADE - Export Development Canada
←
→
Page content transcription
If your browser does not render page correctly, please read the page content below

Export Development Canada
Quarterly Financial Report
March 31, 2018
Unaudited

                             TRADE
                                UNLIMITED
TABLE OF CONTENTS
  MANAGEMENT’S DISCUSSION AND ANALYSIS
    Overview ................................................................................................................................. 2
    Summary of Financial Results ................................................................................................ 3
    First Quarter Highlights .......................................................................................................... 7
    Financial Results – Year to Date
                Prior Year Comparison ......................................................................................... 7
                Corporate Plan Comparison ................................................................................. 8
    Non-IFRS Performance Measures ......................................................................................... 10
    Statement of Management Responsibility.............................................................................. 11
  CONDENSED CONSOLIDATED FINANCIAL STATEMENTS
    Condensed Consolidated Statement of Financial Position ..................................................... 12
    Condensed Consolidated Statement of Comprehensive Income ............................................ 13
    Condensed Consolidated Statement of Changes in Equity .................................................... 14
    Condensed Consolidated Statement of Cash Flows ............................................................... 15
    Notes to the Condensed Consolidated Financial Statements ................................................. 16
                Note 1. Significant Accounting Policies ......................................................... 16
                Note 2. Loans and Allowance for Losses ....................................................... 20
                Note 3. Recoverable Insurance Claims ........................................................... 25
                Note 4. Derivative Instruments ....................................................................... 26
                Note 5. Premium and Claims Liabilities ......................................................... 26
                Note 6. Contingent Liabilities ......................................................................... 27
                Note 7. Equity ................................................................................................. 27
                Note 8. Fair Value of Financial Instruments ................................................... 28
                Note 9. Financial Instrument Risks ................................................................. 30
                Note 10. Loan Revenue..................................................................................... 31
                Note 11. Interest Expense ................................................................................. 31
                Note 12. Net Insurance Premiums and Guarantee Fees .................................... 32
                Note 13. Claims-Related Expenses ................................................................... 32
                Note 14. Other (Income) Expenses .................................................................. 32
                Note 15. Administrative Expenses .................................................................... 33
                Note 16. Related Party Transactions ................................................................. 33

  Caution regarding forward-looking statements
  This document contains projections and other forward-looking statements regarding future events. Such statements require us to make assumptions and
  are subject to inherent risks and uncertainties. These may cause actual results to differ materially from expectations expressed in the forward-looking
  statements.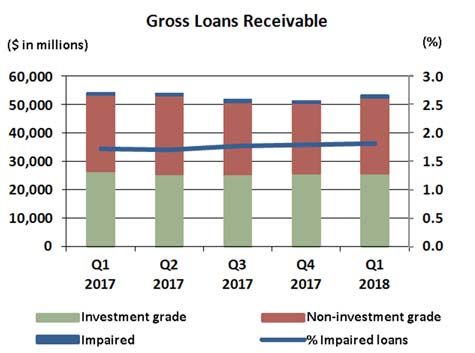
MANAGEMENT’S DISCUSSION AND ANALYSIS

OVERVIEW
Export Development Canada (EDC) is Canada's export credit agency. Our mandate is to support and develop Canada’s export
trade, and the capacity of Canada to engage in trade and respond to international business opportunities, as well as to provide
development financing in a manner consistent with Canada’s international development priorities. We provide insurance and
financial services, bonding products, small business solutions as well as online credit risk management tools. Our customers are
Canadian exporters, investors and their international buyers. We place a particular emphasis on small and medium enterprises by
developing tools to help them succeed in international markets. EDC is a Crown corporation, wholly owned by the Government
of Canada and accountable to Parliament through the Minister of International Trade. We are financially self-sustaining and do
not receive parliamentary appropriations; our revenue is generated primarily by collecting interest on our loans, fees on our
guarantee products and premiums on our insurance products.

Economic Environment
The first quarter of 2018 continued the trend witnessed over the past two years, which has seen global economic growth
strengthen, spread to more countries, and consistently exceed forecasters’ expectations, despite the heightened risk of U.S. trade
protectionism.

Globally, there have been recent improvements in the economies of both the United States and the European Union. Labour
markets have tightened as unemployment rates have fallen below pre-crisis levels, resulting in spare capacity being fully
utilized. Global trade growth has picked up in recent quarters and forward-looking indicators of production are also positive,
notwithstanding recent concerns of escalating U.S.-China retaliatory tariffs.

In Canada, recent data suggests that while a small subset of Canadian exporters are apprehensive that the NAFTA talks are
having a negative impact on their operations, the majority do not appear to be overly concerned, despite the fact that these talks
are expected to result in a new agreement on North American trade rules. Overall, Canadian exporters remain relatively
optimistic about the strength and durability of the ongoing global recovery.

2      EXPORT DEVELOPMENT CANADA
MANAGEMENT’S DISCUSSION AND ANALYSIS

Business Facilitated
                                                                                                                     For the three months ended
Financing business facilitated increased by 61%
                                                                                                                               Mar         Mar
when compared to the same period in 2017 primarily
due to increases in the oil and gas and the                                      (in millions of Canadian dollars)             2018       2017
infrastructure and environment sectors.                                          Business Facilitated
                                                                                  Direct lending                            4,192       2,415
Business facilitated within our financial institutions                            Project finance                             469         391
insurance product group declined by 54% due to a                                  Loan guarantees                             310         294
decrease in demand for the product by an existing                                 Investments                                  49           4
policyholder.                                                                    Total financing and investments            5,020       3,104
                                                                                  Credit insurance                         13,750      13,826
                                                                                  Financial institutions insurance          1,302       2,818
                                                                                  Contract insurance and bonding            1,447       1,142
                                                                                  Political risk insurance                    231         177
                                                                                 Total insurance                           16,730      17,963
                                                                                 Total business facilitated               $21,750     $21,067

SUMMARY OF FINANCIAL RESULTS
EDC adopted the impairment requirements as per IFRS 9 Financial Instruments (IFRS 9) effective January 1,
2018. This adoption resulted in an increase to the opening retained earnings of $400 million. We did not restate
the prior comparative period, as permitted by the standard. Accordingly, the current period results are based on
IFRS 9, while prior period results are based on IAS 39 Financial Instruments: Recognition and Measurement (IAS
39). For this reason, the allowance and provision for credit losses are not directly comparable. Further disclosure
on the transition to the impairment requirement as per IFRS 9 is provided in Note 1 of the Condensed
Consolidated Financial Statements.

Financial Performance
                                                                          For the three months ended
                                                                     Mar              Dec           Mar
(in millions of Canadian dollars)                                    2018            2017          2017
Net financing and investment income                                    305                306                334
Net insurance premiums and guarantee fees(1)                            63                 62                 60
Realized gains (losses)(2)                                               5                (10)                (4)
                                                                       373                358                390
Administrative expenses                                                116                115                104
Provision for (reversal of) credit losses(3)                           (32)              (181)                83
Claims-related expenses                                                 23                  8                 35
Income before unrealized (gains) losses                                266                416                168
Unrealized (gains) losses on financial
   instruments(2)                                                      (55)              (30)                76
Net income                                                           $321              $446                 $92
Period average U.S.$ equivalent of CAD 1.00                          0.791             0.787              0.756
(1)
    Includes loan guarantee fees.
(2)
    Included in Other (Income) Expenses on the Condensed Consolidated Statement of Comprehensive Income.
(3)
    The current period has been prepared in accordance with IFRS 9. Prior period amounts have not been restated
    and are reported in accordance with IAS 39.

We experienced fluctuations in our net income between periods largely caused by changes in provisioning
requirements and volatility in the fair value of our financial instruments due to market conditions. These changes
are further discussed beginning on page 7.

                                                                                                           QUARTERLY FINANCIAL REPORT       3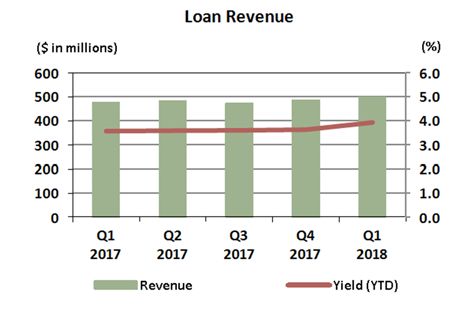
MANAGEMENT’S DISCUSSION AND ANALYSIS
Total loan revenue and loan yield has increased since
the fourth quarter of 2017 mainly due to increases in
U.S. interest rates as the majority of our loans are
denominated in U.S. dollars.
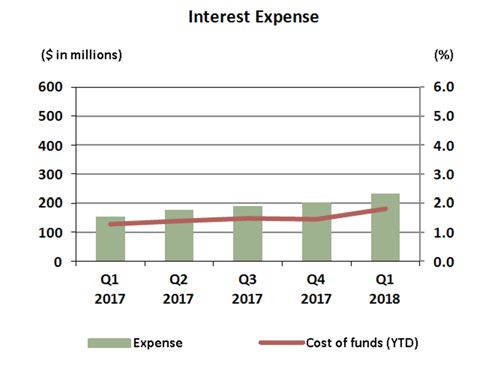
Interest expense increased during the first three months
of 2018 mainly as a result of the increase in U.S.
interest rates, along with increased borrowings to
finance the growth in our marketable securities (refer
to page 9). The majority of our funding is floating rate
and denominated in U.S. dollars, consistent with our
loan assets.
Financial Position
As at Mar Dec Mar
(in millions of Canadian dollars) 2018 2017 2017
Total assets 68,220 60,120 62,129
Total liabilities 58,447 50,080 53,038
Equity 9,773 10,040 9,091
Gross loans receivable 53,162 51,199 54,102
Total allowances* 1,524 1,903 2,212
Period-end U.S.$ equivalent of CAD 1.00 0.776 0.795 0.752
*
The current period has been prepared in accordance with IFRS 9. Prior period amounts have not been restated and
are reported in accordance with IAS 39.
4 EXPORT DEVELOPMENT CANADA
MANAGEMENT’S DISCUSSION AND ANALYSIS

Gross loans receivable has increased in the first
quarter primarily due to foreign exchange translation
and net disbursements. The increase in non-investment
grade exposures in the first quarter of 2018 is
primarily due to downward credit migration of an
obligor in the aerospace sector.

Total loan allowance as a percentage of total financing
related exposure decreased when compared to the
prior quarter due to the adoption of the impairment
model requirements of IFRS 9 which resulted in a
decrease of $400 million to the opening loan
allowance.

                                                                   QUARTERLY FINANCIAL REPORT   5
MANAGEMENT’S DISCUSSION AND ANALYSIS
Impact of Foreign Exchange Translation on Financial Results
Our foreign currency-denominated results are impacted by exchange rate fluctuations. In the first quarter of 2018,
the Canadian dollar average for the quarter strengthened against the U.S. dollar, which had an unfavourable
impact on our financial results, as the components of net income as well as our business facilitated are translated
at the average exchange rates. Had the average exchange rate remained stable in the first quarter, both our net
income and business facilitated would have been higher for the period.
In contrast, the Canadian dollar weakened against the U.S. dollar at the end of the first quarter relative to the prior
quarter, resulting in an increase to our assets and liabilities, which are translated at the rate prevailing on the
statement of financial position date.
The following table reflects the estimated impact on our financial results for the period ended March 31, 2018 had
the Canadian dollar remained stable relative to the U.S. dollar:
Closing exchange rate at
(in millions of Canadian dollars) Dec 2017 Mar 2017
Financial Position
Increase (decrease) in loans receivable (964) 1,307
Increase (decrease) in loans payable (1,259) 1,707
Average exchange rate
for the three months ended
(in millions of Canadian dollars) Dec 2017 Mar 2017
Financial Performance
Increase in net income 1 11
Increase in business facilitated 75 686
Risk Management
Our business activities expose us to a wide variety of risks including strategic, financial and operational risks. We
manage risk with a three lines of defence risk governance structure, which emphasizes and balances strong central
oversight and control of risk with clear accountability for and ownership of risk within the “front lines”. The
structure supports the cascade of EDC’s risk appetite throughout the organization and provides forums for risks to
be appropriately considered, discussed, debated and factored into business decisions at all levels and across all
functions. For a more comprehensive discussion on our risk management, please refer to pages 62-71 of our 2017
Annual Report. Refer to Note 9 of the accompanying financial statements for details on financial instrument risks.
6 EXPORT DEVELOPMENT CANADAMANAGEMENT’S DISCUSSION AND ANALYSIS
FIRST QUARTER HIGHLIGHTS
Net income was $321 million, a decrease of $125
million when compared to the previous quarter
primarily due to changes in provisioning Three months ended
requirements. Mar Dec
(in millions of Canadian dollars) 2018 2017
We recorded a provision release of $32 million in Income before provisions, claims-
the first quarter of 2018 compared to a provision related expenses and unrealized
release of $181 million in the previous quarter. The (gains) losses 257 243
$32 million provision release is mainly due to Reversal of provision for credit losses(1) (32) (181)
improved credit quality in our loan guarantee Claims-related expenses 23 8
portfolio. In the fourth quarter of 2017, we recorded Unrealized (gains) losses on financial
instruments(2) (55) (30)
a provision release of $181 million largely due to the
impact of updates to the models used to generate the Net income $321 $446
(1)
The current period has been prepared in accordance with IFRS 9. Prior
loss given default assumptions used in the allowance period amounts have not been restated and are reported in accordance with
calculation and the impact of updating the (2)
IAS 39.
disbursement assumption on our loan commitments. Included in Other (Income) Expenses on the Condensed Consolidated
Statement of Comprehensive Income.
Other items of note in the first quarter:
In the first quarter of 2018, we paid a dividend of $969 million to the Government of Canada (2017 – $786
million).
FINANCIAL RESULTS – YEAR TO DATE
Prior Year Comparison
Net income for the first three months of 2018 was $229 million higher than net income reported for the same
period in 2017. We experienced variances in other (income) expenses as well as a reduction in the provision for
credit losses.
Other income for the first three months of 2018 was $140 million higher when compared to the same period in
2017. The variance is largely due to the volatility associated with our financial instruments carried at fair value
through profit or loss.
We recorded a provision release of $32 million for the first quarter of 2018 compared to a provision charge of
$83 million in the prior year period. In 2017, the provision charge was mainly due to downward credit migration
in the loan portfolio whereas in 2018, improved credit quality in our loan guarantee portfolio resulted in a
provision release.
QUARTERLY FINANCIAL REPORT 7MANAGEMENT’S DISCUSSION AND ANALYSIS
Corporate Plan Comparison
Financial Performance
Three months ended Year ended
Mar 2018 Mar 2018 Dec 2018
(in millions of Canadian dollars) Actual Results Corporate Plan Corporate Plan
Net financing and investment income 305 325 1,295
Net insurance premiums and guarantee fees* 63 58 252
Other (income) expenses (60) - (2)
Administrative expenses 116 121 527
Provision for (reversal of) credit losses (32) 2 11
Claims-related expenses 23 23 91
Net income 321 237 920
Other comprehensive income (loss) (19) 22 89
Comprehensive income $302 $259 $1,009
*
Includes loan guarantee fees.
Net income for the first three months of 2018 was $84 million higher than the Corporate Plan primarily due to an
increase in other (income) expenses and a reduction in the provision for credit losses.
Other income was $60 million higher than the Corporate Plan for the first three months of 2018. The variance is
largely due to the volatility associated with our financial instruments carried at fair value. Due to the volatility and
difficulty in estimating fair value gains or losses on financial instruments, a forecast for these items is not
included in the Corporate Plan.
We recorded a provision release of $32 million for the first quarter of 2018 compared to a provision charge of $2
million in the Corporate Plan. The $32 million provision release is mainly due to improved credit quality in our
loan guarantee portfolio which was not contemplated in the Corporate Plan.
We recorded an other comprehensive loss of $19 million for the first three months of 2018 mainly due to
negative returns on plan assets as we re-measured our retirement benefit assets and liabilities. The Corporate Plan
had projected that the discount rate used to value our pension obligation would increase resulting in other
comprehensive income; however, the discount rate remained constant in 2018.
8 EXPORT DEVELOPMENT CANADAMANAGEMENT’S DISCUSSION AND ANALYSIS
Financial Position
As at Mar 2018 Mar 2018 Dec 2018
(in millions of Canadian dollars) Actual Results Corporate Plan Corporate Plan
Cash and marketable securities 13,301 11,361 10,664
Derivative instruments 382 280 280
Loans receivable 53,137 53,990 54,687
Allowance for losses on loans receivable (1,040) (1,297) (1,201)
Investments at fair value through profit or loss 1,209 1,142 1,236
Other assets 1,231 758 823
Total Assets $68,220 $66,234 $66,489
Loans payable 55,470 53,226 52,794
Derivative instruments 1,718 2,107 2,107
Allowance for losses on loan commitments 30 25 25
Premium and claims liabilities 670 663 579
Other liabilities 559 623 644
Equity 9,773 9,590 10,340
Total Liabilities and Equity $68,220 $66,234 $66,489
Cash and marketable securities totalled $13.3 billion at March 31, 2018, $1.9 billion higher than Corporate
Plan. Our liquidity policy requires us to hold a liquidity portfolio to meet anticipated cash requirements. In 2018,
as a result of changes to the policy, the period required to be covered by the liquidity portfolio has increased from
a minimum of two weeks to a minimum of one month. While the numbers in the Corporate Plan reflected the
change in policy, our balance is higher than Corporate Plan mainly due to increased cash requirements for
anticipated loan disbursements and debt maturities.
Loans payable totalled $55.5 billion at March 31, 2018, $2.3 billion higher than Corporate Plan mainly due to the
funding required for the increase in our marketable securities portfolio as well as foreign exchange translation.
QUARTERLY FINANCIAL REPORT 9MANAGEMENT’S DISCUSSION AND ANALYSIS
NON-IFRS PERFORMANCE MEASURES
Claims Ratio – Credit Insurance Product Group
The claims ratio expresses net claims incurred as a percentage of net written premium. Net claims incurred
include claims paid net of recoveries, estimated recoveries and changes in actuarial liabilities. This ratio only
includes credit insurance activities.
Reinsurance ceded reflects various partnerships we have with reinsurers in offering and managing insurance
capacity.
Net claims incurred include claims paid net of recoveries and estimated recoveries of $6 million (2017 – $18
million) and an increase in actuarial liabilities of $3 million (2017 – decrease of $1 million).
Three months ended
Mar Mar
(in millions of Canadian dollars) 2018 2017
Premiums earned 26 25
Reinsurance ceded (2) (1)
Net written premium $24 $24
Net claims incurred $9 $17
Claims ratio 38% 71%
10 EXPORT DEVELOPMENT CANADAMANAGEMENT’S DISCUSSION AND ANALYSIS
STATEMENT OF MANAGEMENT RESPONSIBILITY
Management is responsible for the preparation and fair presentation of these condensed consolidated quarterly
financial statements in accordance with the Treasury Board of Canada Standard on Quarterly Financial Reports
for Crown Corporations and for such internal controls as management determines is necessary to enable the
preparation of condensed consolidated quarterly financial statements that are free from material misstatement.
Management is also responsible for ensuring all other information in this quarterly financial report is consistent,
where appropriate, with the condensed consolidated quarterly financial statements.
These condensed consolidated quarterly financial statements have not been audited or reviewed by an external
auditor.
Based on our knowledge, these unaudited condensed consolidated quarterly financial statements present fairly, in
all material respects, the financial position, results of operations and cash flows of the corporation, as at March
31, 2018 and for the periods presented in the condensed consolidated quarterly financial statements.
Benoit Daignault, Ken Kember,
President and CEO Senior Vice-President & Chief Financial Officer
Ottawa, Canada
May 4, 2018
QUARTERLY FINANCIAL REPORT 11CONDENSED CONSOLIDATED FINANCIAL STATEMENTS (UNAUDITED)
Export Development Canada
Condensed Consolidated Financial Statements
CONDENSED CONSOLIDATED STATEMENT OF FINANCIAL POSITION
As at
(in millions of Canadian dollars)
Mar Dec Mar
Notes 2018 2017 2017
Assets
Cash 296 157 141
Marketable securities 13,005 8,057 6,937
Derivative instruments 4 382 315 256
Assets held-for-sale 35 34 47
Loans receivable 2 53,137 51,127 53,994
Allowance for losses on loans receivable 2 (1,040) (1,363) (1,604)
Investments at fair value through profit or loss 1,209 1,124 1,048
Recoverable insurance claims 3 70 65 56
Reinsurers' share of premium and claims liabilities 5 130 103 103
Other assets 648 138 791
Retirement benefit assets 57 69 72
Property, plant and equipment 53 54 53
Intangible assets 106 106 96
Building under finance lease 132 134 139
Total Assets $68,220 $60,120 $62,129
Liabilities and Equity
Accounts payable and other credits 119 123 86
Loans payable 55,470 47,114 49,226
Derivative instruments 4 1,718 1,690 2,438
Obligation under finance lease 153 154 157
Retirement benefit obligations 191 185 245
Allowance for losses on loan commitments 2 30 14 82
Premium and claims liabilities 5 670 608 633
Loan guarantees 2 96 192 171
Total Liabilities 58,447 50,080 53,038
Financing commitments (Note 2) and contingent liabilities (Note 6)
Equity
Share capital 7 1,333 1,333 1,333
Retained earnings 8,440 8,707 7,758
Total Equity 9,773 10,040 9,091
Total Liabilities and Equity $68,220 $60,120 $62,129
The accompanying notes are an integral part of these consolidated financial statements.
These financial statements were approved for issuance by the Board of Directors on May 4, 2018.
Herbert M. Clarke Benoit Daignault
Director Director
12 EXPORT DEVELOPMENT CANADACONDENSED CONSOLIDATED FINANCIAL STATEMENTS (UNAUDITED)
CONDENSED CONSOLIDATED STATEMENT OF COMPREHENSIVE INCOME
(in millions of Canadian dollars)
For the three months ended
Mar Dec Mar
Notes 2018 2017 2017
Financing and Investment Revenue:
Loan 10 498 486 475
Marketable securities 42 28 20
Investments 2 2 2
Total financing and investment revenue 542 516 497
Interest expense 11 229 200 152
Financing related expenses 8 10 11
Net Financing and Investment Income 305 306 334
Loan Guarantee Fees 12 11 10
Insurance premiums and guarantee fees 60 62 61
Reinsurance ceded (9) (11) (11)
Net Insurance Premiums and Guarantee Fees 12 51 51 50
Other (Income) Expenses 14 (60) (20) 80
Administrative Expenses 15 116 115 104
Income before Provision and Claims-Related Expenses 312 273 210
Provision for (Reversal of) Credit Losses 2 (32) (181) 83
Claims-Related Expenses 13 23 8 35
Net Income 321 446 92
Other comprehensive income (loss):
Retirement benefit plans re-measurement (19) 34 22
Comprehensive Income $302 $480 $114
The accompanying notes are an integral part of these consolidated financial statements.
QUARTERLY FINANCIAL REPORT 13CONDENSED CONSOLIDATED FINANCIAL STATEMENTS (UNAUDITED)
CONDENSED CONSOLIDATED STATEMENT OF CHANGES IN EQUITY
(in millions of Canadian dollars)
For the three months ended
Mar Dec Mar
Notes 2018 2017 2017
Share Capital 7 1,333 1,333 1,333
Retained Earnings
Balance beginning of period 8,707 8,227 8,430
IFRS 9 impairment transition adjustment 1 400 - -
Revised balance at beginning of period 9,107 8,227 8,430
Net income 321 446 92
Other comprehensive income (loss)
Retirement benefit plans re-measurement (19) 34 22
Dividend paid 7 (969) - (786)
Balance end of period 8,440 8,707 7,758
Total Equity at End of Period $9,773 $10,040 $9,091
The accompanying notes are an integral part of these consolidated financial statements.
14 EXPORT DEVELOPMENT CANADACONDENSED CONSOLIDATED FINANCIAL STATEMENTS (UNAUDITED)
CONDENSED CONSOLIDATED STATEMENT OF CASH FLOWS
(in millions of Canadian dollars)
For the three months ended
Mar Dec Mar
2018 2017 2017
Cash Flows from (used in) Operating Activities
Net income 321 446 92
Adjustments to determine net cash flows from (used in) operating activities
Provision for (reversal of) credit losses (32) (181) 83
Actuarial change in the net allowance for claims on insurance 14 (56) 12
Depreciation and amortization 10 10 7
Realized (gains) and losses (10) 9 (7)
Changes in operating assets and liabilities
Change in accrued interest and fees on loans receivable (47) 1 -
Change in accrued interest and fair value of marketable securities 61 29 6
Change in accrued interest and fair value of loans payable (49) (121) 57
Change in derivative instruments (169) 134 (189)
Other (67) (49) (43)
Loan disbursements (7,795) (9,024) (5,086)
Loan repayments and principal recoveries from loan asset sales 7,266 9,948 6,003
Net cash from (used in) operating activities (497) 1,146 935
Cash Flows from (used in) Investing Activities
Disbursements for investments (84) (67) (71)
Receipts from investments 49 44 22
Purchases of marketable securities (4,745) (2,287) (589)
Sales/maturities of marketable securities 1,458 886 649
Purchases of property, plant and equipment (1) (13) -
Purchases of intangible assets (6) (33) -
Net cash from (used in) investing activities (3,329) (1,470) 11
Cash Flows from (used in) Financing Activities
Issue of long-term loans payable 5,960 3,467 4,226
Repayment of long-term loans payable (3,020) (2,547) (2,686)
Issue of short-term loans payable 11,126 6,833 6,010
Repayment of short-term loans payable (7,614) (7,885) (7,900)
Disbursements from sale/maturity of derivative instruments (90) 4 -
Receipts from sale/maturity of derivative instruments - (4) -
Dividend paid (969) - (786)
Net cash from (used in) financing activities 5,393 (132) (1,136)
Effect of exchange rate changes on cash and cash equivalents 46 26 -
Net increase (decrease) in cash and cash equivalents 1,613 (430) (190)
Cash and cash equivalents
Beginning of period 1,627 2,057 1,891
End of period $3,240 $1,627 $1,701
Cash and cash equivalents are comprised of:
Cash 296 157 141
Cash equivalents included within marketable securities 2,944 1,470 1,560
$3,240 $1,627 $1,701
Operating Cash Flows from Interest
Cash paid for interest $192 $165 $127
Cash received for interest $436 $480 $432
The accompanying notes are an integral part of these consolidated financial statements.
QUARTERLY FINANCIAL REPORT 15CONDENSED CONSOLIDATED FINANCIAL STATEMENTS (UNAUDITED)
Notes to the Condensed Consolidated Financial Statements
1. Significant Accounting Policies
Basis of Presentation
Our condensed consolidated financial statements comply with the Standard on Quarterly Financial Reports for
Crown Corporations issued by the Treasury Board of Canada.
Except as indicated below, these condensed interim consolidated financial statements follow the same accounting
policies and methods of computation as our audited consolidated financial statements for the year ended
December 31, 2017. They should be read in conjunction with the audited consolidated financial statements for the
year ended December 31, 2017 and the accompanying notes as set out on pages 88-141 of our 2017 Annual
Report.
Basis of Consolidation
Our consolidated financial statements include the assets, liabilities, results of operations and cash flows of our
wholly owned subsidiaries and those structured entities consolidated under IFRS 10 – Consolidated Financial
Statements. Intercompany transactions and balances have been eliminated.
Application of New and Revised International Financial Reporting Standards
(a) New standards, amendments and interpretations adopted in the quarter
The following standards issued by the IASB were adopted during the quarter:
IFRS 9 – Financial Instruments – In July 2014, the IASB issued the final version of IFRS 9 - Financial
Instruments (IFRS 9), which is applicable for reporting periods beginning on or after January 1, 2018 and
replaces the guidance in IAS 39 Financial Instruments: Recognition and Measurement (IAS 39). As we early
adopted the classification and measurement requirements of IFRS 9 upon transition to IFRS in 2011 and do
not apply hedge accounting to our derivatives, we only implemented the impairment requirements on
January 1, 2018.
IFRS 9 does not require restatement of comparative period financial statements except in limited
circumstances relating to the hedge accounting provisions of the standard. We chose not to restate
comparative figures on transition and recognized the measurement difference of $400 million through an
adjustment to opening retained earnings.
The impairment requirements under IFRS 9 are calculated using an expected credit loss (ECL) model as
opposed to the incurred loss model under IAS 39 and impacts the allowance on our loans receivable, loan
commitments and loan guarantees. Our updated accounting policy is as follows:
Allowance for Losses on Loans Receivable, Loan Commitments and Loan Guarantees
The allowance for losses on loans receivable, loan commitments and loan guarantees represents
management’s best estimate of probable credit losses and is based on the expected credit loss model.
Financial assets subject to an impairment assessment include loans held at amortized cost. The allowance for
credit losses related to loans receivable are presented in the allowance for losses on loans receivable in the
condensed consolidated statement of financial position.
Off-balance sheet items subject to an impairment assessment include loan commitments and loan guarantees.
The allowance for credit losses related to loan commitments are presented in allowance for losses on loan
commitments and allowances for credit losses related to loan guarantees are included in the liability for loan
guarantees in the condensed consolidated statement of financial position.
16 EXPORT DEVELOPMENT CANADACONDENSED CONSOLIDATED FINANCIAL STATEMENTS (UNAUDITED)
Changes in the allowance for credit losses on loans receivable, loan commitments and loan guarantees as a
result of originations, repayments and maturities, changes in risk parameters, remeasurements and
modifications are recorded in the provision for (reversal of) credit losses in our condensed consolidated
statement of comprehensive income.
Expected Credit Loss Impairment Model
The expected credit loss model applies a three-stage approach to measure our allowance for credit losses. At
initial recognition financial instruments are placed in Stage 1. Expected credit losses are measured based on
the stage assignment of the financial instrument:
Stage 1 - Where there has not been a significant increase in credit risk since origination, the allowance
recorded is based on the expected credit losses resulting from defaults over the next 12-months;
Stage 2 - Where there has been a significant increase in credit risk since origination, the allowance
recorded is based on the expected credit losses over the remaining lifetime of the financial instrument;
and
Stage 3 - Where a financial instrument is considered impaired, the allowance recorded is based on the
expected credit losses over the remaining lifetime of the instrument and interest revenue is calculated
based on the carrying amount of the instrument, net of the loss allowance, rather than on its gross
carrying amount.
Impairment and Write-off of Financial Instruments
Under EDC’s definition of default on loans receivable and loan commitments, financial instruments are
considered to be in default and placed in Stage 3 when they meet one or both of the following criteria which
represent objective evidence of impairment:
there has been a deterioration in credit quality to the extent that EDC considers that the obligor is
unlikely to pay its credit obligations to EDC in full; or
the obligor is past due more than 90 days on any material credit obligation to EDC.
Loan guarantees with impaired obligors are identified using the same criteria on the underlying loan as used
to assess the impairment of direct loans carried at amortized cost. When the underlying loan is individually
assessed to be impaired, it is probable that a call on the guarantee will be made representing an outflow of
economic benefits that would be required to settle our obligation under the guarantee. Should there be a cash
outflow related to a call on an impaired guarantee, in most cases we would not consider the associated newly
originated loan to be a purchase or origination of a credit impaired asset.
Loans and the related allowance for credit losses are written off, either partially or in full, when all collection
methods, including the realization of collateral, have been exhausted and no further prospect of recovery is
likely.
Measurement of Expected Credit Losses
The ECL calculation along with the stage assignment considers reasonable and supportable information
about past events, current conditions and forecasts of future economic events. The estimation and application
of forward-looking information, using both internal and external sources of information, requires significant
judgement.
The ECL model is a function of the probability of default (PD), loss given default (LGD), and exposure at
default (EAD) of a specific obligor or group of obligors with like characteristics such as industry and country
classification as well as credit risk rating, discounted to the reporting date using the effective interest rate, or
an approximation thereof. In determining the expected life of a financial instrument, the contractual terms as
well as significant judgements on historical behaviour patterns are considered. In order to satisfy the
requirements of IFRS 9, we leverage the risk inputs from our existing regulatory capital models and make
adjustments, where appropriate.
QUARTERLY FINANCIAL REPORT 17CONDENSED CONSOLIDATED FINANCIAL STATEMENTS (UNAUDITED)
Significant Increase in Credit Risk
At each reporting date, an assessment of whether a significant increase in credit risk has taken place since the
initial recognition of the financial instrument is performed. The assessment does not use the low credit risk
exemption stated in the standard, requires significant judgement and considers the following factors:
a threshold based on a relative change in the probability of default for the remaining expected life of the
instrument relative to the corresponding probability of default at origination;
qualitative information available as at the reporting date; and
days past due.
Any exposure that is 30 days past due is placed in Stage 2. Any exposure that is 90 days past due is
considered impaired and placed in Stage 3.
Assets can move in both directions through the stages of the impairment model. If, in a subsequent period,
the credit quality improves for an instrument in Stage 2 such that the increase in credit risk since initial
recognition is no longer considered significant, the instrument will move to Stage 1 and the loss allowance
shall revert to being recognized based on the 12-month expected credit losses.
Modifications
In situations where a borrower experiences financial difficulty, we may grant certain concessionary
modifications to the terms and conditions of a loan. An assessment is done to determine if the loan should be
derecognized. If the modification does not result in derecognition, the date of origination continues to be
used to assess significant increase in credit risk. If the modification results in derecognition, a new loan is
recognized based on the new contractual terms and the date of modification is used to assess significant
increase in credit risk.
Forward-Looking Information
Expected credit losses are calculated using forward looking information determined from reasonable and
supportable forecasts of future economic conditions as at the reporting date. The ECL model does not
consider every possible scenario but reflects a representative sample of three possible outcomes. The
scenarios used are not biased towards extremes, reflect consistency among variables and are probability-
weighted.
In addition to a baseline macroeconomic outlook, EDC also produces two alternative outlooks. These
alternative forecasts leverage our country risk and sector analysts in our economics group to identify and vet
key upside and downside scenario possibilities, considering their impacts and probability of occurrence. The
scenarios are reviewed quarterly for ongoing relevance.
The macroeconomic variables considered in the determination of the scenarios have been established to be
key drivers of a global macroeconomic outlook and influential to EDC’s loan portfolio and include, but are
not limited to, gross domestic product, commodity prices, equity indices, bond yields and unemployment
rates. The macroeconomic variables are applied in the ECL model based on the industry, country and the
credit risk rating that is applicable to each obligor. We also assess the extent to which these variables may
not reflect recent economic events that may result in credit deterioration. In these cases we will estimate the
potential impact on our allowances and apply market overlays to specific industries or other exposure
categories that we deem appropriate.
18 EXPORT DEVELOPMENT CANADACONDENSED CONSOLIDATED FINANCIAL STATEMENTS (UNAUDITED)
Transition Impact
The following table reconciles the closing impairment allowance under IAS 39 to the opening impairment
allowance for credit losses under IFRS 9 as at January 1, 2018:
Impairment allowance under Impairment allowance under
IAS 39 as at December 31, 2017 IFRS 9 as at January 1, 2018
Transition
(in millions of Canadian dollars) Collective Individual Total Adjustment Stage 1 Stage 2 Stage 3 Total
Loans receivable 835 528 1,363 (339) 113 388 523 1,024
Loan commitments 14 - 14 (5) 4 5 - 9
Loan guarantees 82 53 135 (56) 16 9 54 79
Total $931 $581 $1,512 $(400) $133 $402 $577 $1,112
IFRS 7 – Financial Instruments: Disclosures – In July 2014, the IASB issued amendments to the standard
requiring entities to provide additional qualitative and quantitative disclosure when an entity applies IFRS 9.
As EDC implemented IFRS 7 amendments related to classification and measurement in 2011, only
amendments related to impairment disclosures are required. We implemented the disclosure amendments on
January 1, 2018 in conjunction with the implementation of IFRS 9, as noted above.
IFRS 15 – Revenue from Contracts with Customers – In May 2014, the IASB issued the new standard which
establishes a comprehensive framework for the recognition, measurement and disclosure of revenue and cash
flows arising from an entity’s contracts with customers except for revenue arising from items such as
financial instruments, insurance contracts and leases. Loan guarantee fees were assessed to be in scope of
IFRS 15, however the adoption of the new standard did not have an impact on the consolidated financial
statements.
IFRIC 22 – Foreign Currency Transactions and Advance Consideration – In December 2016, the IASB
issued this interpretation to provide guidance on how to determine the “date of the transaction” for purposes
of identifying the exchange rate to use in transactions within the scope of IAS 21 The Effects of Changes in
Foreign Exchange Rates involving the payment or receipt of consideration in advance. This interpretation,
which resulted in no change to our financial statements, was adopted on January 1, 2018.
(b) New standards, amendments and interpretations issued but not yet in effect
The following amendments issued by the IASB during the quarter have been assessed as having a possible
effect on EDC in the future.
IAS 19 – Employment Benefits – In February 2018, the IASB issued amendments to this standard requiring
current service cost and net interest to be determined using the assumptions used for the remeasurement if a
plan amendment, curtailment or settlement occurs. Amendments also require the effect of a plan
amendment, curtailment or settlement on the requirements regarding the asset ceiling be clarified. The
amendments are effective for reporting periods beginning on or after January 1, 2019 and will only impact
EDC upon a plan amendment, curtailment or settlement occurring.
Use of Estimates and Key Judgments
The preparation of financial statements requires the use of estimates and key judgments. Judgment is required in
the selection of accounting policies, and their application requires the use of estimates and assumptions to arrive
at the reported carrying values of our assets and liabilities. Areas where management has made use of significant
estimates and exercised judgment include the allowance for losses on loans receivable, loan commitments and
loan guarantees, assets held-for-sale, premium and claims liabilities, recoverable insurance claims, retirement
benefit plans and financial instruments measured at fair value. Refer to page 90 of our 2017 Annual Report for
details.
QUARTERLY FINANCIAL REPORT 19CONDENSED CONSOLIDATED FINANCIAL STATEMENTS (UNAUDITED)
2. Loans and Allowance for Losses
Loans Receivable
Mar Dec Mar
(in millions of Canadian dollars) 2018 2017 2017
Performing:
Past due* 39 99 76
Current year and beyond 52,161 50,185 53,098
Performing gross loans receivable 52,200 50,284 53,174
Individually impaired loans 962 915 928
Gross loans receivable 53,162 51,199 54,102
Accrued interest and fees receivable 273 241 255
Deferred loan revenue and other credits (298) (313) (363)
Total loans receivable $53,137 $51,127 $53,994
*
Receivables of $39 million were less than 30 days past due. In the first week of April 2018, we received
payments of $36 million (December 2017 - $99 million; first week of January 2018 - $93 million and
March 2017 - $72 million; first week of April 2017 - $67 million).
The following reflects the movement in gross loans receivable during the period:
(in millions of Canadian dollars) 2018 2017
Balance at January 1 51,199 55,375
Disbursements 7,795 5,086
Principal repayments (7,266) (5,890)
Principal recoveries from loan asset sales - (113)
Loans written off - (19)
Transferred to held-for-sale - (5)
Capitalized interest 1 1
Foreign exchange translation 1,433 (333)
Balance at March 31 $53,162 $54,102
Individually Impaired Loans Receivable
Mar Dec Mar
(in millions of Canadian dollars) 2018 2017 2017
Gross loans receivable
Sovereign 9 9 8
Commercial 953 906 920
962 915 928
Less: Deferred loan revenue and other credits 15 17 17
Individual allowance 558 528 521
Carrying amount of individually impaired loans $389 $370 $390
20 EXPORT DEVELOPMENT CANADACONDENSED CONSOLIDATED FINANCIAL STATEMENTS (UNAUDITED)
The following reflects the movement in individually impaired gross loans receivable during the period:
(in millions of Canadian dollars) 2018 2017
Balance at January 1 915 1,037
Loans classified as impaired 22 21
Disbursements on loan guarantees called 17 -
Loans reinstated to performing* (7) (92)
Principal repayments (5) (10)
Loans written off - (14)
Transfer to assets held-for-sale - (5)
Foreign exchange translation 20 (9)
Balance at March 31 $962 $928
*
Includes loans made performing following the restructuring of credit agreements.
Financing Commitments
The following table shows our outstanding financing commitments by type:
Mar Dec Mar
(in millions of Canadian dollars) 2018 2017 2017
Signed loan commitments 20,593 20,784 18,693
Letters of offer 4,125 3,756 3,179
Unallocated confirmed lines of credit 130 112 154
Total financing commitments $24,848 $24,652 $22,026
Allowance for Losses
The following table shows the gross and net carrying amount of our loans receivable, loan commitments and loan
guarantees:
Mar Dec Mar
2018 2017(1) 2017(1)
Gross Net Gross Net Gross Net
(in millions of Canadian carrying Allowance carrying carrying Allowance carrying carrying Allowance carrying
dollars) amount for losses (2) amount amount for losses amount amount for losses amount
Loans receivable 53,162 1,040 52,122 51,199 1,363 49,836 54,102 1,604 52,498
Loan commitments 20,593 30 20,563 20,784 14 20,770 18,693 82 18,611
Loan guarantees 2,635 40 2,595 2,616 135 2,481 2,532 108 2,424
Total $76,390 $1,110 $75,280 $74,599 $1,512 $73,087 $75,327 $1,794 $73,533
(1)Prior period amounts have not been restated and are reported in accordance with IAS 39.
(2)Includes allowance on other receivables of $2 million (December 2017 - $4 million, March 2017 - $5 million).
The following tables reconcile the opening and closing allowance for losses on loans receivable, loan
commitments and loan guarantees for the quarter ended March 2018. Reconciling items include the allowance
impact due to the following:
The impact of transfers between stages before any corresponding re-measurement of allowance;
Re-measurement as a result of transfers between stages;
QUARTERLY FINANCIAL REPORT 21CONDENSED CONSOLIDATED FINANCIAL STATEMENTS (UNAUDITED)
New originations during the period, which include newly disbursed loans, newly signed loan commitments,
and newly signed loan guarantees and also include loan assets that were originated due to recognition
following a modification;
Net disbursements or repayments and maturities, which include loan disbursements and repayments on
existing loans receivable, loan commitments and loan guarantees and include loan assets that were
derecognized due to a modification;
Changes in risk parameters including credit risk rating changes, changes in model inputs, collateral values
and assumptions that did not result in a transfer between stages;
Write-off of assets deemed uncollectible; and
Effect of changes in foreign exchange rates.
22 EXPORT DEVELOPMENT CANADACONDENSED CONSOLIDATED FINANCIAL STATEMENTS (UNAUDITED)
During the quarter, changes to the allowance for losses on loans receivable, loan
commitments and loan guarantees were as follows:
2018
(in millions of Canadian dollars) Stage 1 Stage 2 Stage 3 Total
Loans receivable
Balance at January 1 113 388 523 1,024
Provision for (reversal of) credit losses
Transfer to stage 1 24 (20) (4) -
Transfer to stage 2 (3) 3 - -
Transfer to stage 3 - (1) 1 -
Re-measurements (10) 3 (2) (9)
New originations 17 2 11 30
Net repayments and maturities (13) (11) (2) (26)
Changes in risk parameters (12) (14) 19 (7)
Total provision for (reversal of) credit
losses 3 (38) 23 (12)
Foreign exchange translation 3 13 12 28
Balance at March 31 119 363 558 1,040
Loan commitments
Balance at January 1 4 5 - 9
Provision for credit losses
Transfer to stage 2 (1) 1 - -
Re-measurements - 8 3 11
Changes in risk parameters 1 11 (2) 10
Total provision for credit losses - 20 1 21
Balance at March 31 4 25 1 30
Loan guarantees
Balance at January 1 16 9 54 79
Reversal of provision for credit losses
Transfer to stage 1 2 (2) - -
Re-measurements (1) - 4 3
New originations 4 - - 4
Net repayments and maturities - (1) (34) (35)
Changes in risk parameters (12) (1) - (13)
Total reversal of provision for credit losses (7) (4) (30) (41)
Foreign exchange - 1 1 2
Balance at March 31 9 6 25 40
Total allowance for losses on loans
receivable, loan commitments and
loan guarantees $132 $394 $584 $1,110
QUARTERLY FINANCIAL REPORT 23CONDENSED CONSOLIDATED FINANCIAL STATEMENTS (UNAUDITED)
The following tables reflect the movement in the allowance for losses on loans receivable, loan
commitments and loan guarantees during the period:
2017(3)
Foreign
Balance at Provision for Write- exchange Balance at
(in millions of Canadian dollars) January 1 credit losses offs translation March 31
Loans receivable(1) 1,552 76 (14) (10) 1,604
Loan commitments 78 4 - - 82
Loan guarantees(2) 105 3 - - 108
Total $1,735 $83 $(14) $(10) $1,794
(1)
Includes allowance on other receivables of $5 million.
(2)
Included in the liability for loan guarantees.
(3)
Prior period amounts have not been restated and are reported in accordance with IAS 39.
The following table shows the breakdown of our provision for (reversal of) credit losses
for the prior quarters:
Three months ended
Dec Mar
(in millions of Canadian dollars) 2017(1) 2017(1)
Updated probability of default and loss given default models(2) (123) -
Changes in portfolio composition(3) (55) 5
Update to allowance assumption(2) (46) -
Increased concentration threshold (6) (6)
Credit migration 111 84
Provision for (reversal of) credit losses $(119) $83
(1)
Prior period amounts have not been restated and are reported in accordance with IAS 39.
(2)
Refer to Note 6 in the 2017 Annual Report.
(3)
Represents provision requirement (release) as a result of repayments, performing loan sales, disbursements and
new financing commitments. Also includes the impact of changes in collateral values for our secured loans as
these impacts should be considered in conjunction with the impact of the repayments on these loans.
24 EXPORT DEVELOPMENT CANADACONDENSED CONSOLIDATED FINANCIAL STATEMENTS (UNAUDITED)
Exposure by Credit Grade
Mar Dec Mar
2018 2017 2017
Non-credit- Credit-
impaired impaired % of % of % of
(in millions of Canadian dollars) Stage 1 Stage 2 Stage 3 $ total $ total $ total
Gross loans receivable
Investment grade* 23,158 2,432 - 25,590 48% 25,642 50% 26,344 49%
Non-investment grade 14,895 11,715 - 26,610 50% 24,642 48% 26,830 49%
Individually impaired - - 962 962 2% 915 2% 928 2%
Total gross loans receivable $38,053 $14,147 $962 $53,162 100% $51,199 100% $54,102 100%
Loan commitments
Investment grade* 12,059 1,276 - 13,335 65% 13,892 67% 10,891 58%
Non-investment grade 4,609 2,638 - 7,247 35% 6,892 33% 7,791 42%
Individually impaired - - 11 11 -% - -% 11 -%
Total loan commitments $16,668 $3,914 $11 $20,593 100% $20,784 100% $18,693 100%
Loan guarantees
Investment grade* 304 398 - 702 27% 712 27% 720 29%
Non-investment grade 1,595 299 - 1,894 72% 1,832 70% 1,776 70%
Individually impaired - - 39 39 1% 72 3% 36 1%
Total loan guarantees $1,899 $697 $39 $2,635 100% $2,616 100% $2,532 100%
* Investment grade exposure represents obligors with credit ratings of BBB- and above as determined based on our internal credit risk rating
methodology.
3. Recoverable Insurance Claims
(in millions of Canadian dollars) 2018 2017
Balance at January 1 65 63
Claims paid 17 19
Claims recovered (5) (4)
Change in recoverable portion of
cumulative claims paid (8) (22)
Foreign exchange translation 1 -
Balance at March 31 $70 $56
QUARTERLY FINANCIAL REPORT 25CONDENSED CONSOLIDATED FINANCIAL STATEMENTS (UNAUDITED)
4. Derivative Instruments
We use a variety of derivative instruments to manage costs, returns and levels of financial risk associated with our
funding, investment and risk management activities. Refer to page 108 of the 2017 Annual Report for a
description of derivative instruments that we currently use and for information on how we manage credit, interest
and foreign exchange risks arising from the use of derivatives.
The following table provides the fair values for each category of derivative financial instrument:
Mar Dec Mar
(in millions of Canadian dollars) 2018 2017 2017
Positive Negative Total Positive Negative Total Positive Negative Total
Cross currency interest rate
swaps 134 1,303 (1,169) 167 1,329 (1,162) 137 2,150 (2,013)
Interest rate swaps 231 358 (127) 95 267 (172) 106 200 (94)
Foreign exchange swaps 16 56 (40) 53 91 (38) 12 88 (76)
Foreign exchange forwards 1 1 - - 3 (3) 1 - 1
Total derivative instruments 382 1,718 (1,336) 315 1,690 (1,375) 256 2,438 (2,182)
Impact of netting agreements (333) (333) - (263) (263) - (89) (89) -
Total $49 $1,385 $(1,336) $52 $1,427 $(1,375) $167 $2,349 $(2,182)
Applicable collateral (26) (24) (21)
Net amount $(1,362) $(1,399) $(2,203)
5. Premium and Claims Liabilities
The premium and claims liabilities for our credit insurance (CI), contract insurance and bonding (CIB) and
political risk insurance (PRI) product groups were as follows:
Mar Dec Mar
(in millions of Canadian dollars) 2018 2017 2017
CI* CIB PRI Total CI* CIB PRI Total CI* CIB PRI Total
Insurance 280 40 350 670 274 45 289 608 247 29 357 633
Reinsurance (10) - (120) (130) (13) (1) (89) (103) (13) (2) (88) (103)
Net liability $270 $40 $230 $540 $261 $44 $200 $505 $234 $27 $269 $530
*
Includes financial institutions insurance.
The premium and claims liabilities are comprised of the following components:
Mar Dec Mar
(in millions of Canadian dollars) 2018 2017 2017
Deferred insurance premiums 155 146 144
Allowance for claims on insurance 515 462 489
Total premium and claims liabilities 670 608 633
Reinsurers’ share of allowance for claims on insurance (101) (71) (71)
Prepaid reinsurance (29) (32) (32)
Reinsurers’ share of premium and claims liabilities (130) (103) (103)
Net premium and claims liabilities $540 $505 $530
26 EXPORT DEVELOPMENT CANADACONDENSED CONSOLIDATED FINANCIAL STATEMENTS (UNAUDITED)
6. Contingent Liabilities
As explained on page 113 of the 2017 Annual Report, we are subject to a limit imposed by the Export
Development Act on our contingent liability arrangements. The limit is currently $45.0 billion. Our position
against this limit is provided below:
Mar Dec Mar
(in millions of Canadian dollars) 2018 2017 2017
Insurance in force:
Credit insurance 9,808 9,294 9,282
Financial institutions insurance 3,240 3,392 3,667
Contract insurance and bonding 8,187 8,297 8,126
Political risk insurance 953 915 1,287
Reinsurance ceded* (250) (250) (250)
Insurance in force 21,938 21,648 22,112
Loan guarantees 2,635 2,616 2,532
Total $24,573 $24,264 $24,644
*
Represents treaty reinsurance agreements covering most bonding obligors and the short-term export credit insurance product
group, including most foreign bank exposures.
7. Equity
EDC’s authorized share capital is $3.0 billion consisting of 30 million shares with a par value of $100 each. The
number of shares issued and fully paid is 13.3 million (2017 – 13.3 million). In the first quarter of 2018, a
dividend of $969 million was paid to the Government of Canada (2017 – $786 million paid in the first quarter).
QUARTERLY FINANCIAL REPORT 27CONDENSED CONSOLIDATED FINANCIAL STATEMENTS (UNAUDITED)
8. Fair Value of Financial Instruments
Fair value represents our estimation of the price that would be received to sell an asset or paid to transfer a
liability in an orderly transaction between market participants at the measurement date. For a full description of
our controls, policies and valuation techniques surrounding fair value of financial instruments refer to Note 26 on
page 124 of the 2017 Annual Report.
As with any estimate, uncertainty is inherent due to the unpredictability of future events. In the case of estimating
the fair value of our financial instruments, this uncertainty is magnified due to the large number of assumptions
used and the wide range of acceptable valuation techniques. Estimates of fair values are based on market
conditions at a certain point in time, and may not be reflective of future market conditions. Therefore, the
estimates of the fair value of financial instruments outlined as follows do not necessarily reflect the actual values
that may occur should the instruments be exchanged in the market.
Mar Dec
(in millions of Canadian dollars) 2018 2017
Carrying Fair Carrying Fair
value value value value
Assets
Performing fixed rate loans* 13,440 13,193 12,303 12,461
Performing floating rate loans* 38,270 38,843 37,094 38,046
Total performing loans receivable 51,710 52,036 49,397 50,507
Impaired loans* 389 389 370 370
Loans receivable and accrued interest and fees 52,099 52,425 49,767 50,877
Marketable securities 13,005 13,005 8,057 8,057
Derivative instruments 382 382 315 315
Investments at fair value through profit or loss 1,209 1,209 1,124 1,124
Recoverable insurance claims 70 70 65 65
Other assets 648 647 138 136
Liabilities
Accounts payable and other credits 119 121 123 125
Loans payable 55,470 55,332 47,114 47,021
Derivative instruments 1,718 1,718 1,690 1,690
Loan guarantees 96 57 192 154
*
Balances are net of loan allowance.
Unobservable Inputs – Investments at Fair Value Through Profit or Loss
In the process of assessing the fair value for certain investment instruments, estimates determined in a manner
consistent with industry practice are employed in the models which cannot be directly observed in the market.
EDC’s unobservable estimates are outlined in the following table:
(in millions of Canadian dollars)
Fair value at
Valuation technique Unobservable input Range (average) Mar 2018(1)
Multiples Multiple (Sales or EBITDA(2)) 0.0 – 10.0 (7.2) 85
Liquidity discount 0% – 55% (55%) 7
Discount rate 16% – 35% (23%) 15
Discounted cash flows Discount rate 0% – 10% (9%) 1
(1)
The valuation of an investment may use multiple unobservable inputs and therefore its fair value can be included multiple times in
the fair value amounts.
(2)
Earnings before interest, taxes, depreciation and amortization.
28 EXPORT DEVELOPMENT CANADAYou can also read