TELECOMMUNICATION February 2018

Page created by Stacy Rogers
 
CONTINUE READING
TELECOMMUNICATION February 2018
TELECOMMUNICATION

For updated information, please visit www.ibef.org   February 2018
TELECOMMUNICATION February 2018
Table of Content

   Executive Summary……………….….…….3

   Advantage India…………………..….……..4

   Market Overview …………………….……..6

   Recent Trends and Strategies …………..21

   Growth Drivers…………………….............25

   Opportunities…….……….......……………38

   Success Stories…………….......…………42

   Industry Associations……………...……...46

   Useful Information……….......…………….48
TELECOMMUNICATION February 2018
EXECUTIVE SUMMARY

     Second-largest                              With a subscriber base of nearly 1,185.88 million, as of November 2017, India accounted for the 2nd largest
     subscriber base                              telecom network in the world

     Third-highest number of                     With 429.23 million internet subscriber, as of September 2017, India stands 2nd highest in terms of total
     internet users                               internet users.

     Most of the Internet                       Mobile based Internet is a key component of Indian Internet usage, with 7 out of 8 users accessing internet
     accessed through                            from their mobile phones

     mobile phones                              Since 2012, the share of time spent on watching videos on mobile devices has grown by 200 hours a year

                                                As of November 2017, urban tele-density stood at 167.72 per cent and rural tele-density at 56.54 per
     Rising penetration rate
                                                 cent

     Affordability and lower                    Availability of affordable smartphones and lower rates are expected to drive growth in the Indian telecom
     rates                                       industry

    Source: Telecom Regulatory Authority of India, Aranca Research

3        Telecommunication                                                                               For updated information, please visit www.ibef.org
TELECOMMUNICATION February 2018
Telecommunication

ADVANTAGE INDIA
ADVANTAGE INDIA

       India is the world’s 2nd largest telecommunications market,                                      Telecom penetration in the nation’s rural market reached 56.54
        with 1.186 billion subscribers as of November 2017                                                per cent, as of November 2017.

       With 70 per cent of the population staying in rural areas, the                                            India became the 2nd largest internet market in
        rural market would be a key growth driver in the coming                                                    December 2014
        years
                                                                                                                           The government of India has introduced
                                                                                                                            Digital India programme under which all the
                                                                                                                            sectors such as healthcare, retail, etc. will
                                                                                                                            be connected through internet

                                                                                     ADVANTAGE
                                                                                        INDIA
           The country has a strong                                                                                              The government has been proactive
            telecommunication infrastructure                                                                                       in its efforts to transform India into a
                                                                                                                                   global telecommunication hub;
           In terms of telecommunication ratings, India
                                                                                                                                   prudent regulatory support has also
            ranks ahead of its peers in the West and Asia
                                                                                                                                   helped

                                                                                                                                  National Telecom Policy 2012 calls
                                                                                                                                   for unified licensing, full MNP and free
                                                                                                                                   roaming

    Notes: MNP - Mobile Number Portability
    Source: BMI (Business Monitor International) Report, Internet Mobile Association of India (IAMAI)

5         Telecommunication                                                                                            For updated information, please visit www.ibef.org
Telecommunication

MARKET OVERVIEW
THE TELECOM MARKET SPLIT INTO THREE
                    SEGMENTS

                                                         Telecom

                      Mobile (wireless)             Fixed-line (wireline)                        Internet services

                 Comprises                       Consists of companies                     Includes Internet Service
                  establishments                   that operate and                           Providers (ISPs) that
                  operating and                    maintain switching and                     offer broadband internet
                  maintaining switching            transmission facilities to                 connections through
                  and transmission                 provide direct                             consumer and corporate
                  facilities to provide direct     communications through                     channels
                  communications via               landlines, microwave or
                  airwaves                         a combination of
                                                   landlines and satellite
                                                   link-ups

    Source: Aranca Research

7        Telecommunication                                                      For updated information, please visit www.ibef.org
TELECOM SUBSCRIBER BASE EXPANDS
                    SUBSTANTIALLY

      India is currently the 2nd largest telecommunication market and has             Visakhapatnam
                                                                                              Growth in
                                                                                                      port
                                                                                                        total
                                                                                                           traffic
                                                                                                              subscribers
                                                                                                                   (million tonnes)
       the 3rd highest number of internet users in the world.

      India’s telephone subscriber base expanded at a CAGR of 19.22 per       1,400                                                                                                                            100
       cent, reaching 1,194.58 million during FY07–17.                                                                                                               92.98 91.61
                                                                                                                                                                   83.36
                                                                                                                                                              79.38                                             90
      Tele-density (defined as the number of telephone connections for        1,200                                                           78.7      77.58

                                                                                                                                                                                            1194.58
       every 100 individuals) in India, increased from 17.9 per cent in FY07

                                                                                                                                                                                                      1185.88
                                                                                                                                                    74.02                                                       80
       to 91.61 per cent in FY18*.                                                                                                   70.9

                                                                                                                                                                                  1058.86
                                                                               1,000                                                                                                                            70

                                                                                                                                                                           996
                                                                                                                                                951.34
                                                                                                                                                                                                                60

                                                                                                                                                         898.02
                                                                                800                                        52.7

                                                                                                                                      846.32

                                                                                                                                                                  846.32
                                                                                                                                                                                                                50
                                                                                600                              37

                                                                                                                            621.28
                                                                                                                                                                                                                40

                                                                                                      26.2                                                                                                      30
                                                                                400

                                                                                                                  429.72
                                                                                       18.3
                                                                                                                                                                                                                20

                                                                                                       300.49
                                                                                200

                                                                                        FY07 205.86
                                                                                                                                                                                                                10

                                                                                  0                                                                                                                             0

                                                                                                       FY08

                                                                                                                  FY09

                                                                                                                            FY10

                                                                                                                                      FY11

                                                                                                                                                FY12

                                                                                                                                                         FY13

                                                                                                                                                                  FY14

                                                                                                                                                                           FY15

                                                                                                                                                                                  FY16

                                                                                                                                                                                            FY17

                                                                                                                                                                                                      *FY18
                                                                                                      Telephone Subscriber (in million)                                              Teledensity

    Note: CAGR - Compound Annual Growth Rate; *Data till November 2017
    Source: Telecom Regulatory Authority of India

8        Telecommunication                                                                                      For updated information, please visit www.ibef.org
SURGING TELECOM REVENUES

      Indian telecom sector’s revenue grew at a CAGR of 7.31 per cent                                              Visakhapatnam
                                                                                                                      Telecom Sector
                                                                                                                                  port
                                                                                                                                     Revenue
                                                                                                                                       traffic (million
                                                                                                                                                (US$ Billion)
                                                                                                                                                        tonnes)
       from US$ 19.6 billion in FY06 to US$ 42.6 billion in FY17. During the
       first half of FY18, gross revenues of telecom sector in India reached                                                                          2CAGR    7.31%
       US$ 20.4 billion.                                                                              45
      Revenues from the telecom equipment are expected to grow to

                                                                                                                                                                                                       42.6
                                                                                                      40

                                                                                                                                                                                       41.7
       US$ 26.38 billion by 2020.

                                                                                                                                                               40.8

                                                                                                                                                                                               39.2
                                                                                                                                                                       39.1

                                                                                                                                                                               38.8
      As per Union Budget 2018-19, Government of India is expecting a

                                                                                                                                                       37.7
                                                                                                      35
       58 per cent increase to Rs 48,661.42 crore (US$ 7.52 billion) in

                                                                                                                                              33.3
                                                                                                                                      33.2
                                                                                                                              32.1
       telecom sector revenue.                                                                        30

                                                                                                      25

                                                                                                                      23.3
                                                                                                      20

                                                                                                                                                                                                               20.4
                                                                                                            19.6
                                                                                                      15

                                                                                                      10

                                                                                                       5

                                                                                                       0

                                                                                                                                                                                                               1
                                                                                                            FY 06

                                                                                                                      FY 07

                                                                                                                              FY 08

                                                                                                                                      FY 09

                                                                                                                                              FY 10

                                                                                                                                                       FY 11

                                                                                                                                                               FY 12

                                                                                                                                                                       FY 13

                                                                                                                                                                               FY 14

                                                                                                                                                                                       FY 15

                                                                                                                                                                                               FY 16

                                                                                                                                                                                                       FY 17

                                                                                                                                                                                                               FY 18
    Note: CAGR - Compound Annual Growth Rate; FY – Indian Financial Year (April – March); Figures mentioned are as per latest data available, 1Up to September 2017, 2CAGR is till FY17
    Source: Telecom Regulatory Authority of India, Aranca Research

9         Telecommunication                                                                                                   For updated information, please visit www.ibef.org
WIRELESS SEGMENT DOMINATES THE MARKET

      In November 2017, India’s telephone subscriber base reached             Composition
                                                                                Visakhapatnam
                                                                                           of telephone
                                                                                                port traffic
                                                                                                          subscribers
                                                                                                             (million tonnes)
                                                                                                                        (*FY18)
       1,185.88 million.

      In November 2017, the wireless segment (98.03 per cent of total
                                                                                                1.7% 0.3%
       telephone subscriptions) dominated the market .

      Urban regions accounted for 57.20 per cent share in the wireless
       telecom subscriptions in the country, while rural areas accounted for
       the remaining share.

                                                                                    42.0%

                                                                                                                    56.1%

                                                                                        Urban Wireless         Rural Wireless
                                                                                        Urban Wireline         Rural Wireline

 Source: Telecom Regulatory Authority of India; *Data till November 2017

10      Telecommunication                                                              For updated information, please visit www.ibef.org
WIRELESS SUBSCRIPTIONS WITNESS ROBUST
                  GROWTH OVER THE YEARS

      During FY07-17, wireless subscriptions in the country increased at a                                Visakhapatnam
                                                                                                               Wireless Subscription
                                                                                                                         port traffic (million
                                                                                                                                      (in Million)
                                                                                                                                               tonnes)
       CAGR of 21.64 per cent, with the number of subscribers reaching to
       1,170.2 million in FY17.
                                                                                                                                            2CAGR     21.64%
      Wireless subscribers stood at 1,162.5 million in November 2017.                     1,400

      As of November 2017, urban wireless teledensity stood at 162.84
       while rural wireless teledensity stood at 56.15 per cent.                           1,200

                                                                                                                                                                                               1,170.2

                                                                                                                                                                                                         1162.5
      India is the world’s second largest smartphone market and is
       expected to have almost 1 billion unique mobile subscribers by 2020.

                                                                                                                                                                                     1,058.9
                                                                                           1,000

                                                                                                                                                                             969.8
                                                                                                                                                                     943.9
                                                                                                                                                     919.0

                                                                                                                                                             868.0
                                                                                                800

                                                                                                                                             812.0
                                                                                                600

                                                                                                                                    584.0
                                                                                                400

                                                                                                                            392.0
                                                                                                                   261.0
                                                                                                200

                                                                                                      FY07 165.0
                                                                                                  0

                                                                                                                   FY08

                                                                                                                            FY09

                                                                                                                                    FY10

                                                                                                                                             FY11

                                                                                                                                                     FY12

                                                                                                                                                             FY13

                                                                                                                                                                     FY14

                                                                                                                                                                             FY15

                                                                                                                                                                                     FY16

                                                                                                                                                                                               FY17

                                                                                                                                                                                                         *FY18
 Note: CAGR - Compound Annual Growth Rate, 1FY18 data up to November 2017, 2CAGR is till FY17
 Source: Telecom Regulatory Authority of India

11      Telecommunication                                                                                                  For updated information, please visit www.ibef.org
WIRELESS TELEDENSITY GROWS OVER THE YEARS

      The mobile segment’s teledensity surged from 14.6 per cent in FY07                                   Visakhapatnam
                                                                                                                  Growth inport
                                                                                                                           wireless
                                                                                                                                trafficteledensity
                                                                                                                                         (million tonnes)
       to 91.61 per cent in FY18*.

      GSM services continue to dominate the wireless market with a 98.92                      100.0%
       per cent share (as of March 2017); while CDMA services accounted
                                                                                                90.0%
       for the remaining 1.08 per cent share.

                                                                                                                                                                                                      91.6%
                                                                                                                                                                                              91.1%
                                                                                                80.0%

                                                                                                                                                                                      81.4%
                                                                                                                                                                              77.3%
                                                                                                                                                      76.0%

                                                                                                                                                                      75.4%
                                                                                                70.0%

                                                                                                                                                              70.9%
                                                                                                                                              68.0%
                                                                                                60.0%

                                                                                                50.0%

                                                                                                                                      49.7%
                                                                                                40.0%

                                                                                                                              33.7%
                                                                                                30.0%

                                                                                                20.0%

                                                                                                                    22.8%
                                                                                                            14.6%
                                                                                                10.0%

                                                                                                  0.0%

                                                                                                            FY07

                                                                                                                    FY08

                                                                                                                              FY09

                                                                                                                                      FY10

                                                                                                                                              FY11

                                                                                                                                                      FY12

                                                                                                                                                              FY13

                                                                                                                                                                      FY14

                                                                                                                                                                              FY15

                                                                                                                                                                                      FY16

                                                                                                                                                                                              FY17

                                                                                                                                                                                                      *FY18
 Note: Teledensity - The number of telephone lines for every 100 people in a country, GSM - Global System for Mobile Communications, CDMA - Code Division Multiple Access
 *Data till November 2017
 Source: Telecom Regulatory Authority of India

12      Telecommunication                                                                                                   For updated information, please visit www.ibef.org
WHILE BHARTI AIRTEL DOMINATES WIRELESS
                  SEGMENT

      As of November 2017, Bharti Airtel was the market leader, with a             Access Service Provider-wise market share in terms
                                                                                        Visakhapatnam port traffic (million tonnes)
       24.91 per cent share in the wireless subscription, followed by                        of wireless subscribers (FY18)1
       Vodafone (18.15 per cent share).
                                                                                  30%
      The top 5 players in the sector include - Bharti Airtel, Vodafone, Idea,
       Reliance Jio and BSNL – accounting for 82.08 per cent of the
                                                                                  25%
       wireless subscribers in the country.

                                                                                        24.91%
                                                                                  20%

                                                                                                        18.15%

                                                                                                                   16.69%
                                                                                  15%

                                                                                                                            13.08%
                                                                                  10%

                                                                                                                                           9.25%

                                                                                                                                                            3.75%

                                                                                                                                                                      3.27%

                                                                                                                                                                              3.05%
                                                                                                                                                   7.53%
                                                                                  5%

                                                                                                                                                                                         0.31%
                                                                                  0%

                                                                                                                                                   Aircel
                                                                                        Bharti Airtel

                                                                                                                   Idea

                                                                                                                                           BSNL
                                                                                                                            Reliance Jio

                                                                                                                                                            Telenor

                                                                                                                                                                      Tata

                                                                                                                                                                              Reliance

                                                                                                                                                                                         MTNL
                                                                                                        Vodafone

 Note: BSNL - Bharat Sanchar Nigam Limited, FY181 - Data till November 2017
 Source: Telecom Regulatory Authority of India

13      Telecommunication                                                                                     For updated information, please visit www.ibef.org
BSNL DOMINATES FIXED-LINE SEGMENT

      Total fixed-line subscription stood at 23.41 million, while teledensity                      Fixed-line segment subscription and teledensity FY181
       reached 1.81 per cent due to wide usability of the wireless segment
       as of November 2017                                                                       45       3.6
                                                                                                                          3.4                                                                                                                                4
                                                                                                                                 3.3
                                                                                                 40                                               3.1                                                                                                        3.5
      In FY181, BSNL is the market leader with a 53.64 per cent share,                                                                                     2.9

                                                                                                          41
                                                                                                 35                                                                      2.7

                                                                                                                          39

                                                                                                                                 38
                                                                                                                                                                                   2.5                                                                       3

                                                                                                                                                  37

                                                                                                                                                                  35
       followed by Bharti Airtel (16.69 per cent)                                                30                                                                                       2.3
                                                                                                                                                                                                     2.12 2.06                                               2.5

                                                                                                                                                                         32
                                                                                                                                                                                                               1.9 1.81

                                                                                                                                                                                   30
                                                                                                 25

                                                                                                                                                                                             28.00
      BSNL, MTNL and Bharti together account for 84.79 per cent of the

                                                                                                                                                                                                      7.1
                                                                                                                                                                                                                                                             2

                                                                                                                                                                                                                        6.9

                                                                                                                                                                                                                                 24.40
                                                                                                 20

                                                                                                                                                                                                                                             23.41
       total fixed-line market in FY18*.                                                         15                                                                                                                                                          1.5
                                                                                                 10                                                                                                                                                          1
                                                                                                  5                                                                                                                                                          0.5
                                                                                                  0                                                                                                                                                          0

                                                                                                          FY07

                                                                                                                          FY08

                                                                                                                                 FY09

                                                                                                                                                  FY10

                                                                                                                                                                  FY11

                                                                                                                                                                         FY12

                                                                                                                                                                                   FY13

                                                                                                                                                                                             FY14

                                                                                                                                                                                                      FY15

                                                                                                                                                                                                                        FY16

                                                                                                                                                                                                                                 FY17

                                                                                                                                                                                                                                             FY18*
                                                                                                                                 Fixed-line market share (FY18*)1

                                                                                                60%
                                                                                                50%

                                                                                                                 53.64%

                                                                                                                                  16.69%

                                                                                                                                                         14.46%
                                                                                                40%
                                                                                                30%

                                                                                                                                                                           7.91%

                                                                                                                                                                                                             1.10%

                                                                                                                                                                                                                               0.81%

                                                                                                                                                                                                                                                     0.31%
                                                                                                                                                                                          5.07%
                                                                                                20%
                                                                                                10%
                                                                                                 0%
                                                                                                                 BSNL

                                                                                                                                  Bharti Airtel

                                                                                                                                                                                                             Quadrant

                                                                                                                                                                                                                                                       Aircel
                                                                                                                                                                           Tata

                                                                                                                                                                                          Reliance
                                                                                                                                                         MTNL

                                                                                                                                                                                                                                  Vodafone
 Note: BSNL - Bharat Sanchar Nigam Limited *Data till November 2017, 1In terms of number of subscribers
 Source: Telecom Regulatory Authority of India

14      Telecommunication                                                                                                          For updated information, please visit www.ibef.org
NUMBER OF INTERNET SUBSCRIBERS INCREASING
                   AT A FAST PACE

      The number of Internet subscribers in the country increased at a                                         Visakhapatnam
                                                                                                                    Internet subscriptions
                                                                                                                               port traffic (million
                                                                                                                                            (in Million)
                                                                                                                                                     tonnes)
       CAGR of 41.62 per cent, with the number reaching 429.23* million in
       September, 2017 from 8.6 million in 2006.
                                                                                                                                        2CAGR        42.47%
      The number of internet subscribers in the country is expected to                          500
       double by 2021 to 829 million. Overall IP traffic is expected to grow
                                                                                                 450
       4-fold at a CAGR of 30 per cent by 2021.

                                                                                                                                                                                                     429.23
                                                                                                                                                                                             422.2
                                                                                                 400

                                                                                                 350

                                                                                                                                                                                     342.7
                                                                                                 300

                                                                                                                                                                             302.4
                                                                                                 250

                                                                                                                                                                     267.0
                                                                                                                                                             239.0
                                                                                                 200

                                                                                                 150

                                                                                                 100

                                                                                                                                                      25.3
                                                                                                                                              22.4
                                                                                                                                       18.7
                                                                                                                                15.2
                                                                                                                         12.9
                                                                                                                  10.4
                                                                                                   50

                                                                                                          8.6
                                                                                                    0

                                                                                                                                                                                                     1
                                                                                                         FY06

                                                                                                                  FY07

                                                                                                                         FY08

                                                                                                                                FY09

                                                                                                                                       FY10

                                                                                                                                              FY11

                                                                                                                                                      FY12

                                                                                                                                                             FY13

                                                                                                                                                                     FY14

                                                                                                                                                                             FY15

                                                                                                                                                                                     FY16

                                                                                                                                                                                             FY17

                                                                                                                                                                                                     FY18
 Note: CAGR - Compound Annual Growth Rate; BSNL - Bharat Sanchar Nigam Ltd, Internet live stats, 1As of September 2017, 2CAGR is till FY17, * As per latest available data
 Source: Telecom Regulatory Authority of India, Business Monitor International, Aranca Research Including Internet Access by Wireless Phone Subscribers,

15      Telecommunication                                                                                                For updated information, please visit www.ibef.org
STRONG GROWTH IN BROADBAND DRIVES
                  INTERNET ACCESS REVENUES

      Broadband subscription in the country witnessed an increase at a                              Wired
                                                                                                     Visakhapatnam
                                                                                                           broadband
                                                                                                                   port
                                                                                                                     subscriptions
                                                                                                                        traffic (million
                                                                                                                                      (in tonnes)
                                                                                                                                          million)
       CAGR of 17.48 per cent during FY07–17.
                                                                                                                            2CAGR     17.48%
                                                                                         25

                                                                                         20

                                                                                                                                                               20.4

                                                                                                                                                                      18.2

                                                                                                                                                                             17.9
                                                                                         15

                                                                                                                                                        15.5
                                                                                                                                          15.1
                                                                                                                                   15.0

                                                                                                                                                 14.9
                                                                                                                            13.4
                                                                                         10

                                                                                                                     10.9
                                                                                                              7.8
                                                                                         5

                                                                                                       5.5
                                                                                              3.1
                                                                                         0

                                                                                                                                                                             1
                                                                                              FY07

                                                                                                       FY08

                                                                                                              FY09

                                                                                                                     FY10

                                                                                                                            FY11

                                                                                                                                   FY12

                                                                                                                                          FY13

                                                                                                                                                 FY14

                                                                                                                                                        FY15

                                                                                                                                                               FY16

                                                                                                                                                                      FY17

                                                                                                                                                                             FY18
 Note: CAGR - Compound Annual Growth Rate, 1Data till October 2017, 2CAGR is till FY17
 Source: Telecom Regulatory Authority of India;

16      Telecommunication                                                                                     For updated information, please visit www.ibef.org
BHARTI ACCOUNTS FOR MAJOR SHARE IN
                  BROADBAND SUBSCRIPTIONS

      As of November 2017, Reliance Jio accounted for the largest share        Market break-up by broadband subscriptions
                                                                                 Visakhapatnam port traffic (million1 tonnes)
       of 43.36 per cent in the total broadband market (wired and wireless)              (wired and wireless) FY18
       of India

      Bharti Airtel accounted for the 2nd largest share of 19.67 per cent in
       the country’s broadband market (wired and wireless), during the
                                                                                                     7.08%
       same period
                                                                                             6.09%

                                                                                     9.38%

                                                                                                                        43.36%

                                                                                    14.30%

                                                                                                     19.78%

                                                                                    Reliance Jio        Bharti Airtel   Vodafone

                                                                                    Idea                BSNL            Others

 Notes: BSNL - Bharat Sanchar Nigam Ltd, 1Data till November 2017
 Source: Telecom Regulatory Authority of India

17      Telecommunication                                                                  For updated information, please visit www.ibef.org
KEY COMPANIES IN THE MARKET

                                            Company                             Ownership                   Presence

                                                                      Government (56.3 per cent), Life      Fixed-line and mobile telephony (in
                            Mahanagar Telephone Nigam Ltd (MTNL)
                                                                   Insurance Corporation (18.8 per cent)    Delhi and Mumbai), data and Internet

                                                                                                            Fixed-line and mobile telephony (GSM
                                                                               Government
                                Bharat Sanchar Nigam Ltd (BSNL)                                             – outside Delhi and Mumbai), data and
                                                                              (100 per cent)
                                                                                                            Internet in 22 circles

                                                                              ADAG Group
                                    Reliance Communications                                                 Mobile (CDMA) and broadband
                                                                      (approximately 59.00 per cent)

                                                                   Bharti Group (45.48 per cent), Pastel
                                                                                                            Broadband and mobile (GSM) in
                                           Bharti Airtel           Ltd (14.79 per cent), Indian Continent
                                                                                                            22 circles
                                                                         Investment (6.65 per cent)

                                                                    Vodafone (84.5 per cent), Piramal       Broadband and mobile (GSM) in
                                          Vodafone India
                                                                       Enterprises (11.0 per cent)          22 circles

 Source: Companies’ websites, Bloomberg

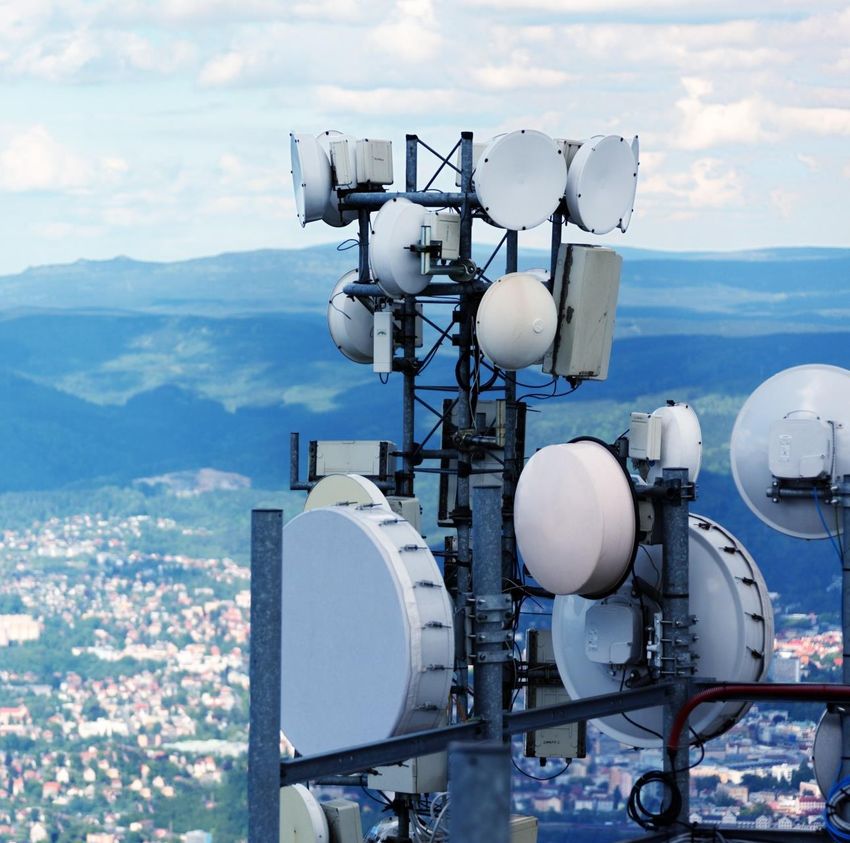
18    Telecommunication                                                                        For updated information, please visit www.ibef.org
EMERGENCE OF TOWER INDUSTRY

      A surge in the subscriber base has necessitated network expansion covering a wider area, thereby creating a need for significant investment in
       telecom infrastructure

      To curb costs and focus on core operations, telecom companies have been segregating their tower assets into separate companies. For example:
       Reliance Communications has decided to finalise a deal to sell its stake in Reliance Infratel. The value of the deal is around US$3.68 billion

      Creating separate tower companies has helped telecom companies lower operating cost and improve capital structure; this has also provided an
       additional revenue stream

      Inspired by the success seen by Indian players in towers business, most of the operators around the world are replicating the model

      To reduce the carbon footprint for telecom infrastructure, including mobile towers, on 1st January, 2017, TRAI (The Telecom Regulatory Authority
       of India), announced to bring consultation paper, that will review the issues related to carbon footprint.

     Emergence of Tower Industry

                                                                                             Focus on                           Segregation
                                                          Higher                               tower                             of towers
                       Rising                            operating                           sharing to                             into
                     competition                         cost and                             reduce                             separate
                                                        debt burden                            costs                            companies

 Source: Aranca Research

19      Telecommunication                                                                           For updated information, please visit www.ibef.org
PORTER’S FIVE FORCES FRAMEWORK ANALYSIS

                                                       Threat of Substitutes

                                                        Hardly any threat of substitute
                                                         products as there is no substitute
                                                         available in the market

             Bargaining Power of Suppliers             Competitive Rivalry                             Bargaining Power of Buyers

              High bargaining power of suppliers as    Customers’ low switching cost and             Low switching cost and mobile
               there are just a few suppliers in the     price sensitivity are increasing               number portability give customers
               sector                                    competition among players                      high bargaining power
              High cost of switching suppliers         High exit barriers are also intensifying      Customers are price sensitive
                                                         competition
                                                        There are around 6 to 7 players in
                                                         each region, leading to intense
                                                         competition

                                                       Threat of New Entrants

                                                        Strict government regulations
                                                        Extremely high infrastructure setup
     Positive Impact                                     cost
     Neutral Impact                                     Difficulty in achieving economies of
                                                         scale
     Negative Impact

 Notes: VoIP – Voice Over Internet Protocol
 Source: Aranca Research

20     Telecommunication                                                                            For updated information, please visit www.ibef.org
Telecommunication

RECENT TRENDS
AND STRATEGIES
NOTABLE TRENDS IN THE INDIAN TELECOM SECTOR
                  … (1/2)

                                              The green telecom concept is aimed at reducing carbon footprint of the telecom industry through lower
                                               energy consumption
     Green Telecom
                                              Tata has invested around US$16.38 million to convert its 10,000 base stations from indoor to outdoor to
                                               reduce energy consumption and carbon footprint across its 20 telecom circles in India so far

                                              There are over 62,443 uncovered villages in India; these would be provided with village telephone facility with
                                               subsidy support from the government’s Universal Service Obligation Fund (thereby increasing rural
     Expansion to Rural                        teledensity)
     Markets
                                              In November 2017, the rural subscriber base accounted for 42.25 per cent of the total subscriber base,
                                               thereby fuelling growth across the sector

                                              The most significant recent developments in wireless communication include BWA technologies such as
                                               WiMAX and LTE
     Emergence of BWA                         In 2015, Airtel launched its 4G services in 296 cities across the India
     Technologies
                                              In 2015, BSNL started its 1st 4G Wireless Broadband Internet Service- WiMax

                                              Reliance Jio, has launched 4G services across pan- India as on December 2015

                                              IoT is the concept of electronically interconnected and integrated machines, which can help in gathering and
     Internet Of Things (IOT)                  sharing data. The Indian Government is planning to develop 100 smart city projects, where IoT would play a
                                               vital role in development of those cities.

 Notes: BWA - Broadband Wireless Access, TRAI - Telecom Regulatory Authority of India
 Source: Aranca Research

22     Telecommunication                                                                                  For updated information, please visit www.ibef.org
NOTABLE TRENDS IN THE INDIAN TELECOM SECTOR
                  … (2/2)

                                              Vodafone and Idea, India's second and third largest operators have decided to merge.
     Consolidation
                                              Airtel’s acquisition of Tata Teleservices’ mobile business was given approval in November 2017.

                                              In 2017, Vodafone disclosed its plans to invest US$1,310 million to upgrade and expand Vodafone India
                                               network coverage and US$655 million to upgrade its technology centre
     Rising investments
                                              In February 2017, Japanese Telecom company - Docomo, re-invested US$ 1.18 billion in Tata Telecom, to
                                               gather a stake of 26.5 per cent in the company.

     Outsourcing non-core                     As part of the recent outsourcing trend, operators have outsourced functions such as network maintenance,
     activities                                IT operations and customer service

                                              Digital transactions reached an all-time high of 1.11 billion in January 2018 with mobile banking transactions
                                               reaching 102.6 million.

                                              In March 2017, the government set a target of achieving 25 billion digital transactions for banks with the help
     Mobile banking
                                               of PoS machines, transactions enabled and merchants, which have been added in firms

                                              In March 2017, Samsung launched its mobile payment service, Samsung Pay, to facilitate smooth payment
                                               at retail outlets, instead of using mobile wallets, credit or debit cards.

 Notes: NPCI - National Payment Corporation of India
 Source: ’Searching for New Frontiers of growth: Indian Banks’- PwC, Aranca Research, Reserve Bank of India

23     Telecommunication                                                                                      For updated information, please visit www.ibef.org
STRATEGIES ADOPTED

                                           Players are using innovative marketing strategies to succeed in this sector. For example,

     Marketing strategy                      •    In August 2015, Idea Cellular launched new campaign “Get idea and dance”

                                             •    Airtel launched new ad campaign “Airtel myPlan Family”

                                           Players differentiate themselves by providing different services to customers. For example,

                                              •   In 2015, Airtel India launched a mobile app “Wynk Movies”, it is a library that includes videos and movies
     Differentiation
                                              •   In November 2015, Vodafone launched “Choose Your Number” facility where prepaid and post paid
                                                  customers get numbers of their own choice

                                           Players price their products very carefully due to the price sensitive nature of customers and high competition
                                            in the sector. Players generally go for price war. For example,

                                              •   In December 2016, Micromax launched low cost 4G Volte Smartphones, with a pre-activated Reliance Jio
                                                  Sim offer of free voice calls and data. These smartphones are launched in the range of US$67.21 to
                                                  US$114.57

     Pricing strategy                         •   In September 2016, Reliance Jio 4G network plans have been launched. Free domestic voice calls have
                                                  been offered by Jio. No charge or deduction of data would be done for making voice calls to any network
                                                  across the country. Also, the company has offered cheaper data plans and tariff plans ranging
                                                  from US$2.28 to US$76.37 per month. As of October 2016, the company’s subscriber base had crossed
                                                  16 million customers

                                              •   In March 2017, CAT S60 smartphone was launched in India for US$ 966.81. The phone is loaded with a
                                                  thermal camera that can see through smoke and can be used in extreme temperatures.

 Notes: CDMA – Code Division Multiple Access, GSM - Global System for Mobile Communication
 Source: Company websites, Aranca Research

24      Telecommunication                                                                                For updated information, please visit www.ibef.org
Telecommunication

GROWTH DRIVERS
SECTOR BENEFITS FROM RISING INCOME, GROWING
                   YOUNG POPULATION

                                                                                                                                            Increasing
              Growing demand                                                    Policy support
              Growing demand                                                                                                               investments

                       Higher real
                                                                                      Reduction in
                      income and                                                                                                            Higher FDI inflows
                                                                                       license fee
                   changing lifestyles

                                                     Inviting                                                     Resulting in

                     Growing young                                                      Relaxed                                             Increasing M and
                       population                                                      FDI Norms                                                A activity

                                                                                          Encourages
                       Increasing MOU
                                                                                       firms to expand
                        and data usage
                                                                                         to rural areas

 Note: FDI - Foreign Direct Investment, MOU - Minutes of Use per month and per subscriber, M&A - Mergers and Acquisitions

26     Telecommunication                                                                                             For updated information, please visit www.ibef.org
RISING INCOME FUELS DEMAND FOR TELECOM
                  SERVICES

      Incomes have risen at a brisk pace in India and will continue rising           Visakhapatnam
                                                                                        Rising per capita
                                                                                                      portincome
                                                                                                            traffic (million
                                                                                                                    in India tonnes)
                                                                                                                             (US$)
       given the country’s strong economic growth prospects.
                                                                              2,000
      Nominal per capita income recorded a CAGR of 4.36 per cent from
       2011-12 to 2016-17.

                                                                                                                                                  1,874.90
                                                                              1,800
      Increasing income has been a key determinant of demand growth in

                                                                                                                                       1,750.60
       the telecommunication sector in India                                  1,600

                                                                                                                            1,617.30
                                                                                                                 1,600.90
      The IMF estimates nominal per capita income in India to expand at a

                                                                                       1,514.80

                                                                                                      1,504.50
                                                                              1,400
       CAGR of 4.94 per cent during FY10–FY19
                                                                              1,200
      Per capita income in the country is estimated at US$1,611.40 in
       FY17.
                                                                              1,000

                                                                               800

                                                                               600

                                                                               400

                                                                               200

                                                                                 0

                                                                                       FY12

                                                                                                      FY13

                                                                                                                 FY14

                                                                                                                            FY15

                                                                                                                                       FY16E

                                                                                                                                                  FY17F
 Notes: CAGR - Compound Annual Growth Rate, F – Forecast, E - Estimate
 Source: IMF

27      Telecommunication                                                                         For updated information, please visit www.ibef.org
INCREASING INCOME AND GROWING RURAL
                   MARKET – DEMAND DRIVERS

      The emergence of an affluent middle class is triggering demand for                         Indian residents shifting from low to high income groups (%)
                                                                                                           Visakhapatnam port traffic (million tonnes)
       the mobile and internet segments                                                                             Milion Household, 100%
                                                                                                                   209.10                   266.50                    304.80
      A young, growing population is aiding this trend (especially demand
                                                                                                  100%
       for smart phones)                                                                                            44.0%                    31.0%                    18.0%
                                                                                                    90%

                                                                                                    80%
                                                                                                                                                                      46.0%
                                                                                                    70%
                                                                                                                                             45.0%
                                                                                                    60%

                                                                                                    50%             42.0%

                                                                                                    40%

                                                                                                    30%                                                               20.0%

                                                                                                    20%                                      15.0%

                                                                                                    10%                                                               11.0%
                                                                                                                     8.0%
                                                                                                                     3.0%       1.5%          6.0%        2.0%         5.0%
                                                                                                     0%
                                                                                                                     2005                     2016                    2025F

                                                                                                                   Elite(>30800)                Affluent(15400-30800)
                                                                                                                   Aspirers(7700-15400)         Next billion(2300-7700)
                                                                                                                   Strugglers(
INCREASING INTERNET REVENUES AND
                  SUBSCRIPTIONS

      The Mobile Value Added Services (MVAS) industry has expanded at                                    Visakhapatnam
                                                                                                               MVAS revenues
                                                                                                                        port traffic
                                                                                                                               (in US$
                                                                                                                                     (million
                                                                                                                                       Billion)
                                                                                                                                              tonnes)
       a CAGR of 29.26 per cent to US$11.08 billion by 2016 from US$1.1
       billion in 2007
                                                                                                                                  CAGR 29.26%
      The share of non-voice revenues, which currently stands at around                    16
                                                                                                                                                                                 15.10
       10 per cent of telecom operators’ revenues, is estimated to rise to
       more than 30 per cent in the next 5 to 7 years                                       14
      A decline in the prices of smartphones and data subscription rates is
       likely to drive demand for MVAS                                                      12
                                                                                                                                                                         11.08
                                                                                                                                                                 9.98
                                                                                            10

                                                                                                                                                         7.80
                                                                                              8

                                                                                                                                                 6.20
                                                                                              6
                                                                                                                                          4.9
                                                                                                                                  4.2
                                                                                              4                            3.2

                                                                                                           1.7      1.9
                                                                                              2
                                                                                                   1.1

                                                                                              0
                                                                                                   2007

                                                                                                             2008

                                                                                                                    2009

                                                                                                                           2010

                                                                                                                                   2011

                                                                                                                                          2012

                                                                                                                                                  2013

                                                                                                                                                          2014

                                                                                                                                                                  2015

                                                                                                                                                                          2016

                                                                                                                                                                                  2017E
 Notes: CAGR - Compound Annual Growth Rate, MVAS - Mobile Value-Added Services, E - Estimate, F - Forecast
 Source: Wipro Technologies, IAMAI – Internet And Mobile Association of India, Aranca Research

29      Telecommunication                                                                                           For updated information, please visit www.ibef.org
STRONG POLICY SUPPORT CRUCIAL TO THE
                   SECTOR’S DEVELOPMENT … (1/3)

     To compensate the                        In October 2015, Telecom Regulatory Authority of India announced an amendment for Telecom Consumer
     consumers in case of                      Protection Regulations 2012 according to which mobile service operators have to provide compensation to
     call drop                                 the users in case of call drop.

                                              In 2015, Telecom Regulatory Authority of India made regulations to amend the Standards of quality of
     Standards of quality
                                               wireline (telephone service) and cellular mobile telephone services. These regulations has been laid down to
     wireline and wireless
                                               ensure better and effective compliance with the quality of service regulations and to protect the interest of the
     services                                  customers

                                              FDI cap in the telecom sector has been increased to 100 per cent from 74 per cent; out of 100 per cent, 49
     Relaxed                                   per cent will be done through automatic route and the rest will be done through the FIPB approval route
     FDI norms                                FDI of up to 100 per cent is permitted for infrastructure providers offering dark fibre, electronic mail and voice
                                               mail

                                              In May 2017, Microsoft India signed a Memorandum of Understanding with the Telcom Sector Skill Council
                                               (TSSC) to encourage skill development through “Project Sangam”.

     Skill Development                        In a major push for Prime Minister Narendra Modi's 'Skill India' mission, Microsoft's Indian-born CEO Satya
                                               Nadella launched a Cloud hosted platform named as "Project Sangam" to help the government not only train
                                               but also assist people get jobs via professional networking website LinkedIn, which was acquired by the
                                               company last year.

 Notes: FDI - Foreign Direct Investment, FIPB - Foreign Investment Promotion Boar
 Source: TRAI, Aranca Research

30     Telecommunication                                                                                   For updated information, please visit www.ibef.org
STRONG POLICY SUPPORT CRUCIAL TO THE
                  SECTOR’S DEVELOPMENT … (2/3)

                                             In 2015, TRAI passed the telecommunication tariff (16th amendment) order, according to which, every service
     Telecommunication
                                              provider should offer a special roaming tariff plan to its prepaid and post-paid customers and on payment of
     Tariff Order
                                              fixed charge for special roaming tariff plan national roaming should be free

                                             The Department of Information Technology intends to set up over 1 million internet-enabled common service
                                              centres across India as per the National e-Governance Plan
     Set up internet
                                             On 8th August 2016, the Telecom Regulatory Authority of India (TRAI) made the 10th amendment to the
     connections
                                              TCPR (Telecom Consumers Protection Regulations) permitting telecom companies to offer data packs
                                              having maximum validity of 365 days

                                             In January 2015, the Government of India recommended reduction in license fees of telecom operators by 6
     Reduction in license                     per cent, telecom operators currently pay 8 per cent of adjusted gross revenue as licence fee
     fees                                    The issuance of several international and national long-distance licenses has created opportunities and
                                              attracted new companies into the market

                                             In May 2017, the central government announced the Phased Manufacturing Programme (PMP) to promote
     Make in India                            domestic production of mobile handsets. This initiative will help in building a robust indigenous mobile
                                              manufacturing ecosystem in India, and incentivise large scale manufacturing.

 Notes: USOF - Universal Service Obligation Fund; OFC - Optical Fibre Cable, WiMAX - Worldwide Interoperability for Microwave Access Telecommunications
 Source: TRAI, Aranca Research

31     Telecommunication                                                                                            For updated information, please visit www.ibef.org
STRONG POLICY SUPPORT CRUCIAL TO THE
                  SECTOR’S DEVELOPMENT … (3/3)

                                             The USOF is expected to extend financial support to operators providing services in rural areas and
     Financial support
                                              encourage active infrastructure sharing among operators

                                             The prescribed limit on spectrum would be increased from 6.2MHz to 2x8 MHz (paired spectrum) for GSM
                                              technology in all areas other than Delhi and Mumbai, where it will be 2x10MHz (paired spectrum)

                                             Telecom players can, however, obtain additional frequency; there will be an auction of spectrum subject to
     Enhanced spectrum limit
                                              the limits prescribed for the merger of licenses

                                             As of October 2016, telecom operators like Vodafone and Tata Teleservices purchased spectrum worth US$
                                              1.51 billion and US$ 0.34 billion, respectively, from the government

     Telecommunication
                                              In 2015, telecom authority issued this order mandating every DTH operator to specify the tariff for supply and
     amendment order for
                                               installation of the customer premises equipment. DTH operator should specify the refundable security
     broadcasting and cable                    deposit, installation charges, monthly rental charge and activation
     services

                                              In May 2017, the Ministry of Telecommunication launched the Indian Mobile Congress 2017 (IMC 2017), the
                                               first and biggest platform in the country to bring all the stakeholders together from Telecom, Internet and
     Indian Mobile Congress
                                               Mobility ecosystem along with ICT players, app developers, innovators and start-ups. The three-day IMC will
                                               be held on 27-29 September 2017.

 Notes: USOF - Universal Service Obligation Fund; OFC - Optical Fibre Cable
 Source: TRAI, Aranca Research

32     Telecommunication                                                                                 For updated information, please visit www.ibef.org
NATIONAL TELECOM POLICY - 2012

                                                              ‘Broadband for all’ with
                                                               a minimum download
                                                                  speed of 2Mbps

                                     Increase rural                                            Liberalisation of
                                 teledensity from 39 to                                         spectrum and
                                  70 per cent by 2017,                                         convergence of
                                  and 100 per cent by                                       network, services and
                                          2020                  National Telecom                   devices
                                                                  Policy - 2012

                                                                                      Unified licensing,
                                             Aims at a ‘One Nation-
                                                                                    delinking of spectrum
                                            One license’ regime with
                                                                                  from license, online real-
                                            no roaming charges and
                                                                                    time submission and
                                              nation wide number
                                                                                          processing
                                                   portability

 Source: Digital Dawn, KPMG Report 2013

33    Telecommunication                                                                        For updated information, please visit www.ibef.org
Process of M2M Roadmap Formulation

                              Firming up of issues and
                                                                                                   Input from consultative
                                 viewpoints through            Seminars and Workshops
                                                                                                   committee and working
                                  Questionnaire to                    on M2M
                                                                                                            groups
                                    Stakeholders

          Consultation with Industry
                                                                                                        Input from various TEC
           bodies (COAL, FICCI,
                                                                                                        committees on different
           AUSPI, ASSOCHAM)
                                                                                                                 issues
            /Other Stakeholders

                                                             Policy and Regulatory
          Draft roadmap and open                                   Committee                           Inputs from DeitY and
          consultation through web                                                                     Industry stakeholders on
                                                                                                       draft documents

                                                         National Telecom M2M Roadmap

 Source: Digital Dawn, KPMG Report 2013

34    Telecommunication                                                                 For updated information, please visit www.ibef.org
FOREIGN INVESTMENTS FLOWING IN … (1/2)

      Cumulative FDI inflows into the telecom sector over April 2000 –                      Cumulative
                                                                                                     Visakhapatnam
                                                                                                        FDI inflows into
                                                                                                                      porttelecommunication
                                                                                                                            traffic (million tonnes)
                                                                                                                                                (US$ million)
       September 2017, totalled to US$ 30.03 billion.

      During this period, FDI into the sector accounted for a share of 8.40
                                                                                              35,000
       per cent of total FDI inflows into the country, till September 2017.

                                                                                              30,000

                                                                                                                                                                               30,030
                                                                                              25,000

                                                                                                                                                                      23,946
                                                                                              20,000

                                                                                                                                                             18,382
                                                                                                                                                    17,058
                                                                                              15,000

                                                                                                                                           14,163
                                                                                                                                  12,856
                                                                                                                         12,552
                                                                                              10,000

                                                                                                                10,589
                                                                                                        9,872
                                                                                               5,000

                                                                                                   0

                                                                                                        FY10

                                                                                                                FY11

                                                                                                                         FY12

                                                                                                                                  FY13

                                                                                                                                           FY14

                                                                                                                                                    FY15

                                                                                                                                                             FY16

                                                                                                                                                                      FY17

                                                                                                                                                                               FY18*
 Source: Department of Industrial Policy and Promotion (DIPP); * Data as of September 2017

35      Telecommunication                                                                                       For updated information, please visit www.ibef.org
FOREIGN INVESTMENTS FLOWING IN … (2/2)

      In March 2017, Vodafone announced its merger with Idea Cellular to become India’s biggest telecom operator. The merger will result in a
       customer base of 400 million, nearly 35 per cent market share and is expected to complete in 2018.

      NTT Communications has acquired a Virtual Network Operator – International Long Distance (VNO-ILD) license in India. This license will allow
       NTT Com to add Arcstar Universal One International Network Services in its brand. The company will be using their ICT solutions to help
       enterprise customers build its ICT environment for business expansion in India.

     Foreign investment in India

     Target                                 Acquirer                                Acquisition price (US$ million)   Division acquired
     Ascend Telecom
                                            IDFC Alternatives (2017)                             54.29                33 per cent stake
     Infrastructure Pvt. Ltd.
     Telenor                                Bharti Airtel (2017)                                  N/A                 Infrastructure and Contracts
     Videocon
     Telecommunications
                                            Bharti Airtel (2016)                                  660                 100 per cent stake
     Ltd-1800 MHz spectrum in 6
     circles
     Bharti Airtel's operations in
                                            Orange SA (2016)                                      900                 100 per cent stake
     Burkina Faso and Sierra Leone
     MTS                                    Reliance Communication (2015)                       736.98                8 – 10 per cent stake
     Augere Wireless                        Bharti Airtel (2015)                                 21.3                 100 per cent stake
                                                                                                                      Increases stakes to 32.34 per
     Bharti Airtel                          SingTel(2013)                                         302
                                                                                                                      cent
     Bharti Airtel                          Qatar Foundation Endowment(2014)                     1,260                PE deal – 5 per cent stake
                                            Vodafone International Holdings
     Vodafone India Ltd                                                                          1,641                Increases stakes to 100 per cent
                                            (2014)
     Ascend Telecom                         Ascend Telecom Infrastructure Pvt Ltd                54.29                33 per cent stake
 Notes: M&A - Merger and Acquisition, PE - Private Equity
 Source: Thomson Banker, Deal Tracker, Grant Thornton, Aranca Research

36      Telecommunication                                                                           For updated information, please visit www.ibef.org
EXPANSION AND GROWTH STRATEGIES OF LEADING
                 PLAYERS

                                          Bharti Airtel Ltd, India's largest telecom operator, has decided to buy Tikona Digital Networks Pvt Ltd’s 4G
     Bharti Airtel and Tikona
                                           business for approximately Rs 1,600 crore (US$ 248.43 million), which includes its broadband wireless
     Digital Networks
                                           access spectrum as well as 350 cellular sites in five telecom circles.

                                           In January 2016, Vodafone India launched its 4G network services in Kolkata and Kozhikode (Kerala)
                                            following its successful implementation in other parts of Kerala such as Kochi and Thiruvananthapuram
     Vodafone India 4G
     launch, Reliance Jio 4G               In September 2016, Reliance Jio launched 4G services across India, at comparatively cheaper rates. The
                                            company had targeted to acquire 100 million customers by March 2017. In addition to the existing plan India
     launch
                                            2300 MHz spectrum and 1800 MHz in 14 circles, during the auction in 2016, Jio invested over US$1,527.7
                                            million to acquire 1800 MHz spectrum in 6 circles and 800 MHz spectrum in 10 circles

                                           Vodafone India has entered into an agreement with Walmart India to make payments using M-Pesa mobile
     Mobile wallet by                       wallet services. Under this agreement, Vodafone M-Pesa will offer safe, secure and convenient transactions
     Vodafone                               and on placing an order with Walmart India, Vodafone M-Pesa agent will reach out to customer and cash in
                                            into his M-Pesa account

                                           In January 2017, gaming accessories and console manufacturer - Razer acquired Nextbit, to foray into the
     New Entrant in the                     smartphone market of India. China based companies such as Xiaomi, One Plus, OPPO, Huawei, etc. have
                                            also launched their smartphones in India.
     Smartphone Market
                                           Domestic Players such as Micromax, Karbonn and Lava are the top 3 budget smartphone companies in India

 Notes: M&A - Merger and Acquisition
 Source: Thomson Banker, Deal Tracker, Aranca Research

37     Telecommunication                                                                            For updated information, please visit www.ibef.org
Telecommunication

OPPORTUNITIES
OPPORTUNITIES ACROSS SEGMENTS IN THE
                 INDUSTRY … (1/2)

       Increasing mobile subscribers                 Untapped rural markets                            Rising internet penetration

      The number of wireless subscribers in    By November 2017, rural tele-density               Internet penetration is expected to
       India reached 1.162 billion, by           reached 56.94 per cent, growing from                grow steadily and is likely to be
       November 2017                             43.05 per cent as of March 2016                     bolstered by government policy

      Of the total 1,185.88 million            By November 2017, rural wireless tele-             Number of broadband subscribers
       subscribers as of November 2017,          density in the country increased to                 reached 350.70 million at the end of
       around 57.20 per cent subscribers are     56.54 per cent, while, the urban                    November 2017
       from urban areas and the rest (42.80      wireless tele-density reached to
                                                                                                    To encourage cash economy, Indian
       per cent), from rural areas               167.72 per cent during the same
                                                                                                     government announced to provide free
                                                 period
                                                                                                     Wi-fi to more than 1000 gram
                                                                                                     panchayats.

 Source: KPMG, TRAI, Aranca Research

39    Telecommunication                                                                   For updated information, please visit www.ibef.org
OPPORTUNITIES ACROSS SEGMENTS IN THE
                   INDUSTRY … (2/2)

      Development of telecom                       Growth in MVAS and cloud                                                               Growing Cashless
                                                                                                 Telecom equipment market
          infrastructure                                  computing                                                                         Transactions
      TRAI has made several                        The Indian Mobile Value-                      Telecom equipment market           In order to overcome the
       recommendations for the                       Added Services (MVAS)                          was estimated to be US$20           cash related problems being
       development of telecom                        industry is expected to row                    billion in FY16*                    faced by people, due to
       infrastructure, including tax                 at a CAGR of 18.3 per cent                                                         demonetisation, Paytm
                                                                                                   It is anticipated to reach
       benefits and recognising                      during the forecast period                                                         launched a service through
                                                                                                    US$ 30 billion by 2020
       telecom infrastructure as                     2015–2020 and reach US$                                                            which consumers and
       essential infrastructure                      23.8 billion by 2020.                         Under Digital India                 merchants can pay and
                                                                                                    programme, ‘every Indian            receive money instantly,
                                                    Public cloud services in
                                                                                                    has a smartphone by 2019’           without an internet
                                                     India generated US$1,316
                                                                                                    programme implemented               connection
                                                     million in 2016. Indian public
                                                     cloud services market is                                                          This has enabled non-
                                                     expected to reach US$1.9                                                           smartphone users to go
                                                     billion by 2019.                                                                   cashless

 Notes: VAS - Value-Added Services, NTP - National Telecom Policy, FY16* - as per latest data available
 Source: Press Information Bureau, Government of India, Aranca Research

40     Telecommunication                                                                                           For updated information, please visit www.ibef.org
MOBILE APPLICATION MARKET: FAST GROWING
                   SEGMENT

      The mobile app market is estimated around US$ 245.6 million in            Number
                                                                                  Visakhapatnam
                                                                                        of App downloads
                                                                                                 port traffic
                                                                                                            in(million
                                                                                                               India (intonnes)
                                                                                                                          billions)
       2015

      India’s downloads of apps grew nearly 215 per cent between 2015
       and 2017.                                                            25

      India overtook USA to reach the second position in terms of number
       of app downloads in 2017.
                                                                            20
      The segment’s growth is expected to be driven by increasing mobile

                                                                                                                                      20.10
       connections and availability of low-range smartphones

      Over 100 million apps are downloaded every month across different    15
       platforms such as iOS, Blackberry, Nokia and Android

      As of May 2017, Whatsapp users in the country spend 50 million
       minutes on chatting through WhatsApp video call feature each day.    10
       The app is available in 10 Indian languages, and more than 50
       different languages globally.

                                                                                                                      7.70
                                                                            5

                                                                                                        6.00
                                                                                      3.5
                                                                            0

                                                                                                                      2017 E
                                                                                      2015

                                                                                                        2016

                                                                                                                                      2020 F
 Notes: E – estimated, F – Forecast, *As per latest data available
 Source: Gartner, Deloitte, Assorted News Articles, Aranca Research

41      Telecommunication                                                                    For updated information, please visit www.ibef.org
Telecommunication

SUCCESS STORIES
VODAFONE: INDIA’S THIRD-LARGEST MOBILE
                 OPERATOR … (1/2)

      Established in 1994, Vodafone is one of India’s leading mobile                   Visakhapatnam
                                                                                                 Revenues
                                                                                                      port (US$
                                                                                                           trafficbillion)
                                                                                                                   (million tonnes)
       operators, with more than 209 million customers as of FY17

      Vodafone's revenues from India increased at a CAGR of 5.84 per cent                               CAGR 5.84%
       to US$75.4 billion during FY08–17.                                    8

                                                                                                                   7.4
                                                                             7

                                                                                                             6.7

                                                                                                                               6.7

                                                                                                                                            6.5
                                                                             6

                                                                                                                         6.2
                                                                                                       5.9

                                                                                                                                      5.9
                                                                             5

                                                                                                 4.9
                                                                                          4.4
                                                                             4

                                                                                  3.9
                                                                             3

                                                                             2

                                                                             1

                                                                             0
                                                                                 FY08 FY09 FY10 FY11 FY12 FY13 FY14 FY15 FY16 FY17

 Notes: CAGR - Compounded Annual Growth Rate
 Source: Company website

43      Telecommunication                                                                       For updated information, please visit www.ibef.org
VODAFONE: INDIA’S THIRD-LARGEST MOBILE
                  OPERATOR … (2/2)

      Vodafone’s customer subscription increased at a CAGR of 14.66 per                   Visakhapatnam
                                                                                                  Total subscribers
                                                                                                          port traffic(million)
                                                                                                                       (million tonnes)
       cent to 209 million during FY08–FY17. The total wireless subscriber
       base of Vodafone stood at 209.06 million in March 2017.                                                          2CAGR    14.66%
      Wireless subscriber base of Vodafone rose 1.3 per cent month-on-          250

       month to 211.03 million in November 2017 from 208.32 million in
       October 2017.

                                                                                                                                                                         211.0
      Gujarat, Uttar Pradesh, Maharashtra and West Bengal together              200

                                                                                                                                                                 209.0
                                                                                                                                                         204.6
       account for over 45 per cent of the total customer base

                                                                                                                                                 183.0
      Vodafone Group plans to invest heavily in the establishment of a fibre-

                                                                                                                                         167.0
       optic network in India                                                    150

                                                                                                                                 153.0
                                                                                                                148.0

                                                                                                                         147.0
      Vodafone has launched 4G services in Delhi, Kolkata, Karnataka and
       Kerala in February 2016. In May 2016, the company also planned to

                                                                                                        124.0
       cover four circles of Gujarat, Haryana, UP (East) and West Bengal
                                                                                 100

                                                                                               91.0
                                                                                        61.0
                                                                                  50

                                                                                   0
                                                                                       FY08 FY09 FY10 FY11 FY12 FY13 FY14 FY15 FY16 FY17 FY181

  Note: 1Up to November 2017, 2CAGR is up to FY17
 Source: Company website; CAGR - Compounded Annual Growth Rate

44      Telecommunication                                                                             For updated information, please visit www.ibef.org
MOBILE NUMBER PORTABILITY: A PARADIGM SHIFT
                  IN INDIAN TELECOM

      Mobile Number Portability (MNP) in India was introduced in November          Visakhapatnam
                                                                                       Number of MNP
                                                                                                  portrequests
                                                                                                       traffic (million
                                                                                                                 (in million)
                                                                                                                        tonnes)
       2010

      MNP allows subscribers to change their mobile service provider while   350
       retaining their old mobile number

                                                                                                                                       330.98
      The portability service was made available for both postpaid and
                                                                              300
       prepaid customers as well as on both GSM and CDMA platforms

      The implementation of MNP has brought a slew of benefits for

                                                                                                                           272.67
                                                                              250
       customers in terms of better plans and offers

      MNP requests in India increased to 330.98 million at the end of
       November 2017                                                          200

                                                                                                               209.13
                                                                              150

                                                                                                    153.85
                                                                                     117.01
                                                                              100

                                                                               50

                                                                                0
                                                                                    FY14          FY15        FY16       FY17        FY18*

 Source: TRAI Report,*Data till November 2017

45      Telecommunication                                                                     For updated information, please visit www.ibef.org
Telecommunication

KEY INDUSTRY
ORGANISATIONS
INDUSTRY ORGANISATIONS

     Association of Unified Telecom Service Providers of India
                                                                            Association of Competitive Telecom Operators (ACTO)
     (AUSPI)

     Address: B-601, Gauri Sadan 5, Hailey Road, New Delhi – 110 001,       Address: 601, Nirmal Tower, 26, Barakhamba Road, Connaught Place,
     India                                                                  New Delhi – 110 001, India
     Tel: 91 11 23358585                                                    Tel.: 91 11 43565353 / 43575353
     Fax: 91 11 23327397                                                    Fax: 91 11 43515353
     Website: http://www.auspi.in/                                          E-mail: info@acto.in
                                                                            Website: www.acto.in

     Internet and Mobile Association of India (IAMAI)                       Cellular Operators Association of India

     Address: F-36, Basement, East of Kailash, New Delhi – 110 065, India   Address: 14, Bhai Vir Singh Marg, Sector 4, Gole Market, New Delhi –
     Tel: 91 11 46570328                                                    110001, India
     E-mail: kalyan@iamai.in                                                Tel: 91 11 2334 9275
     Website: www.iwww.iamai.in                                             E-mail: contact@coai.in
                                                                            Website: www.coai.com

47      Telecommunication                                                                    For updated information, please visit www.ibef.org
Telecommunication

USEFUL
INFORMATION
APPENDIX

     BMI telecoms business environment ratings

      Industry rewards: it considers average revenue per users, number of subscribers, subscriber growth, and number of operators

      Country rewards: it considers urban/rural split, age range, GDP per capita, US$

      Industry risks: it considers regulatory independence

      Country risk: it rates the country on short-term external risk, policy continuity, legal framework corruption

      Telecom ratings: overall rating of the above indicators

49      Telecommunication                                                                               For updated information, please visit www.ibef.org
GLOSSARY

      BWA: Broadband Wireless Access

      CAGR: Compound Annual growth rate

      DoT: Department of Telecommunication

      FDI: Foreign Direct Investment

      FTTH: Fibre To The Home

      FY: Indian Financial Year (April to March)

      IMF: International Monetary Fund

      INR: Indian Rupee

      IPTV: Internet Protocol Television

      M&A: Mergers and Acquisitions

      MoU: Minutes of Use per month and per subscriber

      MPEG: Moving Picture Experts Group

      OFC: Optical Fibre Cable

      TRAI: Telecom Regulatory Authority of India

      USOF: Universal Service Obligation Fund

      US$: US Dollar

      VAS: Value-Added Services

      WiMAX: Worldwide Interoperability for Microwave access telecommunications

     Wherever applicable, numbers have been rounded off to the nearest whole number

50      Telecommunication                                                             For updated information, please visit www.ibef.org
EXCHANGE RATES

     Exchange Rates (Fiscal Year)                                              Exchange Rates (Calendar Year)

                 Year INR                          INR Equivalent of one US$               Year                  INR Equivalent of one US$
                  2004–05                                    44.81                         2005                             43.98
                  2005–06                                    44.14
                                                                                           2006                             45.18
                  2006–07                                    45.14
                                                                                           2007                             41.34
                  2007–08                                    40.27
                  2008–09                                    46.14                         2008                             43.62

                  2009–10                                    47.42                         2009                             48.42
                  2010–11                                    45.62
                                                                                           2010                             45.72
                  2011–12                                    46.88
                                                                                           2011                             46.85
                  2012–13                                    54.31
                  2013–14                                    60.28                         2012                             53.46

                  2014-15                                    61.06                         2013                             58.44
                  2015-16                                    65.46                         2014                             61.03
                  2016-17                                    67.09
                                                                                           2015                             64.15
                Q1 2017-18                                   64.46
                                                                                           2016                             67.21
                Q2 2017-18                                   64.29
                Q3 2017-18                                   64.74                         2017                             65.12

 Source: Reserve bank of India, Average for the year

51     Telecommunication                                                                      For updated information, please visit www.ibef.org
DISCLAIMER

     India Brand Equity Foundation (IBEF) engaged Aranca to prepare this presentation and the same has been prepared by Aranca in consultation
     with IBEF.

     All rights reserved. All copyright in this presentation and related works is solely and exclusively owned by IBEF. The same may not be reproduced,
     wholly or in part in any material form (including photocopying or storing it in any medium by electronic means and whether or not transiently or
     incidentally to some other use of this presentation), modified or in any manner communicated to any third party except with the written approval
     of IBEF.

     This presentation is for information purposes only. While due care has been taken during the compilation of this presentation to ensure that the
     information is accurate to the best of Aranca and IBEF’s knowledge and belief, the content is not to be construed in any manner whatsoever as a
     substitute for professional advice.

     Aranca and IBEF neither recommend nor endorse any specific products or services that may have been mentioned in this presentation and nor do
     they assume any liability or responsibility for the outcome of decisions taken as a result of any reliance placed on this presentation.

     Neither Aranca nor IBEF shall be liable for any direct or indirect damages that may arise due to any act or omission on the part of the user due to any
     reliance placed or guidance taken from any portion of this presentation.

52      Telecommunication                                                                               For updated information, please visit www.ibef.org
You can also read