ESR
Interim Results Presentation
For 1H 2020
27 August 2020
←
→
Page content transcription
If your browser does not render page correctly, please read the page content below
ESR Interim Results Presentation For 1H 2020 27 August 2020
Disclaimer
The presentation may contain projections and forward-looking statements that reflect the Company’s current views with respect
to future events and financial performance and are subject to certain risks, uncertainties and assumptions. In some cases,
these forward-looking statements can be identified by the use of forward-looking terminology, including the terms “believe”,
“continue”, “could”, “estimate”, “forecast”, “plan”, “prepare”, “project”, “anticipate”, “expect”, “intend”, “may”, “will” or “should” or,
in each case, their negative or other variations or comparable terminology, or by discussions of strategy, plans, objectives,
goals, future events or intentions. These forward-looking statements include all matters that are not historical facts. By their
nature, forward-looking statements involve known and unknown risk and uncertainty because they relate to future events and
circumstances. Forward-looking statements are not guarantees of future performance and involve risks and uncertainties, and
actual results may differ materially from those in the forward-looking statements as a result of various factors and assumptions,
many of which are beyond the Company’s control. Prospective investors are cautioned not to rely on such forward-looking
statements. Neither the Company nor any of its affiliates, advisors, representatives or underwriters has any obligation to, nor do
any of them undertake to, revise or update the forward-looking statements contained in this presentation to reflect future events
or circumstances, except where they would be required to do so under applicable law.

This presentation material includes measures of financial performance which are not a measure of financial performance under
International Financial Reporting Standards (“IFRS”), such as Adjusted EBITDA and Adjusted Net Profit. These measures are
presented because the Company believes they are useful measures to determine the Company's financial condition and
historical ability to provide investment returns. Adjusted EBITDA and Adjusted Net Profit and any other measures of financial
performance in this presentation material should not be considered as an alternative to cash flows from operating activities, a
measure of liquidity or an alternative to net profit or indicators of the Company's operating performance on any other measure
of performance derived in accordance with IFRS. Because Adjusted EBITDA and Adjusted Net Profit are not IFRS measures,
Adjusted EBITDA and Adjusted Net Profit may not be comparable to similarly titled measures presented by other companies.

                                                                                                                                     1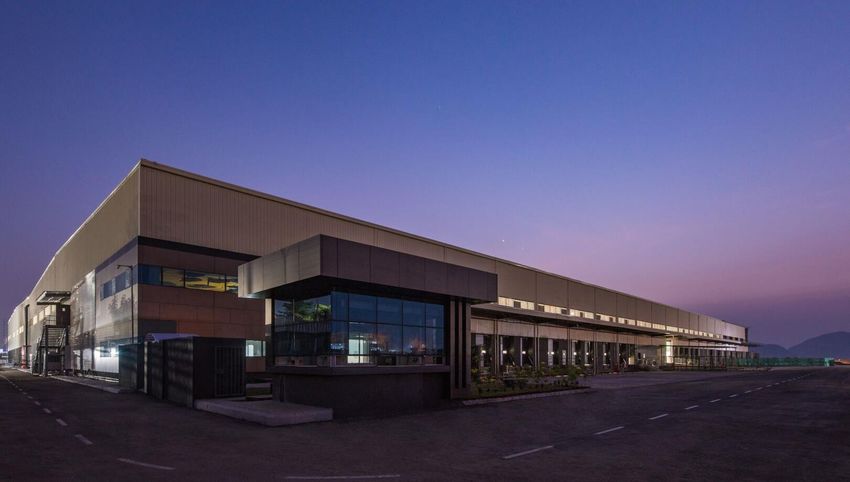
Contents
• Updates On COVID-19 Situation

• 1H 2020 Financial Highlights

• Industry Update

• 1H 2020 Operations Overview

• 1H 2020 Financial Overview

• Outlook

• Appendix

                                  2
Updates On COVID-19 Situation
   1          Continue to focus on well-being/safety of our stakeholders
              ▪     Steps to ensure safe operations continue to be in place

   2          Operations largely unaffected and developments on track with minor
              disruptions
              ▪     No sustained shutdown of projects post-Wuhan temporary closures
              ▪     Temporary delays on select development projects

   3          AUM grew 31% y-o-y in 1H 2020 to US$26.5 billion on the back of strong
              fundraising
              ▪     Raised approximately US$2.4 billion of capital from new funds across China, Australia
                    and South Korea; over US$3.6 billion of committed but uncalled capital to invest
              ▪     Capital partners are increasingly looking to increase their logistics exposure at the
                    expense of other real estate property types

   4          Maintained high occupancy of 91%1 across entire portfolio despite
              challenging market conditions brought on by COVID-19
              ▪     Leased 0.9 million sqm across portfolio in 1H 2020
              ▪     Primarily driven by demand from e-commerce players and tenants from food and
                    consumer staples

   5          Seek to leverage ESR platform to consolidate our market position in
              various geographies
              ▪     Strong balance sheet with ~US$1 billion of cash and low gearing
Note:                                                                                                       3
(1) Based on assets on balance sheet and stabilised assets
1H 2020 Financial Highlights

  Total                                                       Total                                                   Core
                                 +27.3%                                                       +75.1%                           +71.9%
  EBITDA                                                      PATMI                                                   PATMI1

US$269m                                                     US$133m                                                   US$121m
  Total                                                       Net Debt/
  AUM                             +31.1%                      Total Assets
                                                                                               -1.6pp                 Cash     +7.1%

US$26.5b                                                    28.6%                                                     US$947m
▪ Strong operating performance across three key business segments

▪ Further cemented market leading positions with continued growth in key markets

▪ Solid expansion of total AUM underpinned by new funds raised across China, South
  Korea and Australia

▪ Well-equipped with robust balance sheet and strong liquidity

▪ Disciplined capital management to capture investment opportunities that may emerge in
  this environment
Notes:
(1)    Excludes fair value on completed investment properties, pre-IPO ESOP expenses and tax effects of adjustments
                                                                                                                                        4
Section 1 Industry Update
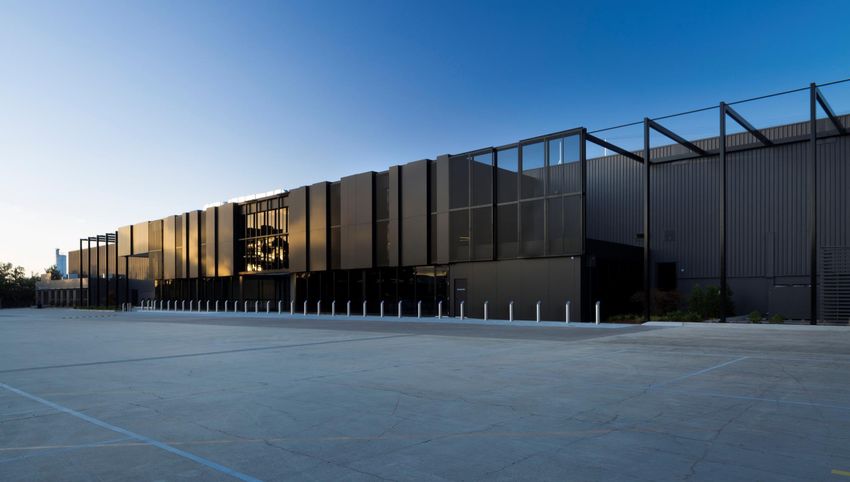
Kunshan Friend Park I, China
5
APAC Logistics – Largest Secular Growth Opportunity
In Asia

                                                                      Superior Risk /
                         Manufacturers and
                                              Paradigm Shift in   Reward Proposition of
COVID-19 Accelerating    Retailers Adapting
                                              Capital Flows For   Logistics to Drive Cap
E-commerce Adoption      Supply Chains to
                                              Region and Sector   Rate Compression and
                        COVID-19 Challenges
                                                                   Capital Value Growth

   ESR has and will continue to uniquely leverage the largest secular trends to
               further solidify its market leading position in Asia

                                                                                           6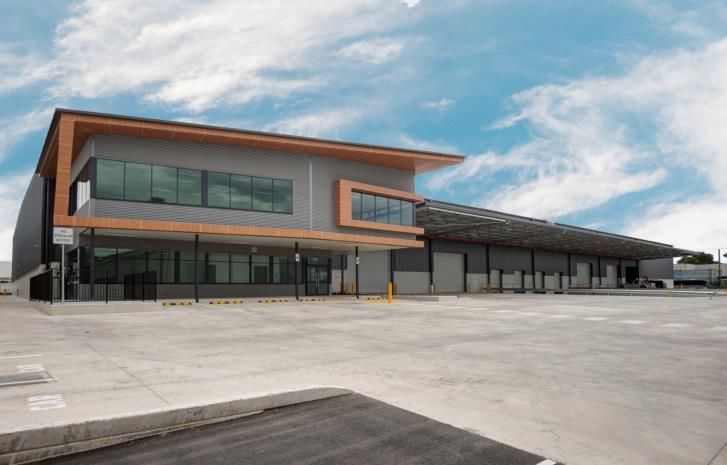
APAC Logistic Market Growth Well-Supported By
Increasing E-commerce Across The Region
E-commerce penetration across Asia
   1     China                                                              2   South Korea
                 40.4%    40.4%                                                      38.2% 39.4%
                                                                            28.2%
    28.2%

     2019        2024E    2024E                                             2019     2024E    2024E
                 before    after                                                     before    after
                 COVID    COVID                                                      COVID    COVID
    4    India
                          11.2%                                             3   Japan
                 8.5%                                                                         12.7%
                                                                                     11.6%
    4.7%                                                                    9.1%

    2019         2024E    2024E                                             2019     2024E    2024E
                 before    after                                                     before    after
                 COVID    COVID                                                      COVID    COVID
   5     Singapore                                                          6   Australia
                          17.5%
                 14.5%                                                               14.0%    15.0%
    9.2%                                                                    10.8%

    2019         2024E    2024E                                             2019     2024E    2024E
                 before    after                                                     before    after
                 COVID    COVID                                                      COVID    COVID

          Increasing e-commerce penetration, which is being further accelerated due to
        COVID-19, will continue to support long-term demand for modern logistics facilities
Source: Euromonitor                                                                                    7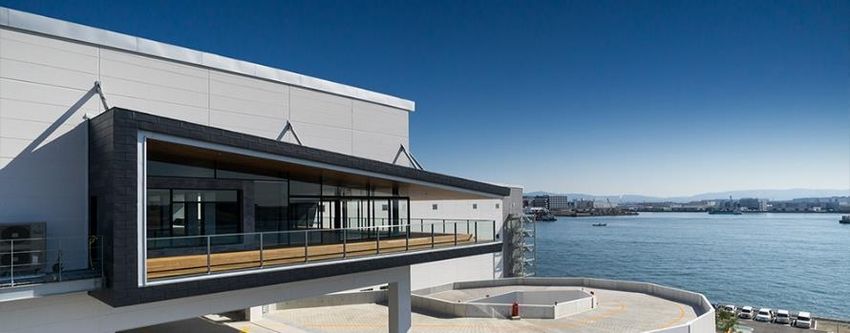
COVID-19 Is Accelerating Adoption Of E-commerce

Radically shifting consumer behavior and demand

                   65%                                                                                                                        43%
                   feel uncomfortable going
                                                                                      63%                                                     plan to do more of their
                                                                                      visiting physical stores less                           shopping online if COVID
                   to a mall
                                                                                                                                              continues

Pushing consumers to shop more online

 Online goods retail grows faster so far in 2020 1 YoY (%)                                    China’s online sales likely to grow faster in 2020
                                                                                              (%)
                                                                                                                                                     Online sales
                                                                                                                                                     growth pick-up
                                                                                                35                                                   in 2020E
  23

  18
                                                                                                25
  13

   8
                                                                                                15
   3                                                                                                                  The historical
  (2)                                                                                                                 declining
                                                                                                 5                    growth trend
  (7)

 (12)                                                                                                 2014     2015    2016   2017     2018   2019   2020F 2021F
                                                                                                -5
 (17)

 (22)
             Total retail sales          Total retail sales          Online retail sales       -15
           (googs and catering)              (goods)                      (goods)

         2M20       1Q20        4M20       5M20        Mar-20       Apr-20       May-20                                         Online goods YoY growth

 Sources:
 (1) Yotpo, How is COVID-19 Changing Consumer & E-Commerce Trends, March 2020
 (2) Fitch, China’s Structural Shift towards Online Retail, June 2020
 Note:                                                                                                                                                                   8
 (1) January and February combined (2M20) due to Chinese New Year holidays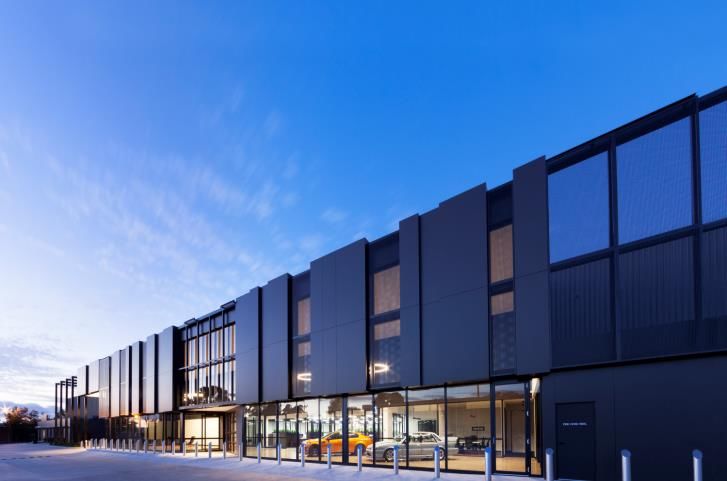
E-commerce Accelerating During COVID-19

Shopee Gross Merchandise Value            Alibaba Gross Merchandise Value
(US$ billion)                             (US$ billion)                             E-commerce has
                                                                                    witnessed a surge in
                   YoY : 70.2%                               YoY : 15.1%            new demand as
                                  20.2                                     948.8    customers are
            11.9                                                                    increasingly adopting a
                                                     824.6                          habit of buying online

                                                                                    • Tmall fast-moving
      CY1Q19 LTM             CY1Q20 LTM         CY1Q19 LTM             CY1Q20 LTM     consumer goods and
                                                                                      consumer electronics
Shopee e-commerce revenue                 Alibaba e-commerce revenue
                                                                                      combined Gross
(US$ million)                             (US$ million)
                                                                                      Merchandise Value

                                                             YoY : 34.8%
                                                                                      (GMV) grew +25%
                   YoY : 148.0%                                            62,795     YoY
                                  954.8
                                                    46,566
                                                                                    • Over 60% Freshippo’s
           384.9                                                                      GMV coming from
                                                                                      online purchases in
                                                                                      the March 20 quarter
      CY1Q19 LTM             CY1Q20 LTM         CY1Q19 LTM             CY1Q20 LTM

                                                                                                              9
Momentum Is Building Up For Cold Storage
Pandemic caused demand jump in food and grocery delivery, coupled with rising
awareness of food safety standards
Market size of China’s online fresh grocery market
Online grocery channel behavior net increase (%) (RMB billion)
During COVID-19 vs before After COVID-19 vs during
Visit frequency Spend Visit frequency
564.0
China 21 Accelerating
74 15
growth
South Korea 51 11 7
404.7
India 40 31 38
279.6
Thailand 28 29 25
204.5
Indonesia 16 16 16 130.8
Restrictions
on online
Austraila 6 grocery 4 10
imposed
Japan (1) 16 4
2017 2018 2019 2020E 2021E
Market Size YoY Growth
Source: McKinsey, How Chinese Consumers are Changing Shopping Habits in Response to Source: iResearch, Statista
COVID-19, May, 2020
10Manufacturers Are Shifting Away From “Just-In-Time”
Inventory Model To “Just-In-Case” Inventory Model
“Companies should shift from ‘just in time’ to ‘just in case’ . The Covid-19 outbreak has exposed the thin margins on which much of global
business runs. Highly indebted companies, working from lean inventory, supported by just-in-time supply chains and staffed by short-term
contractors, have borne the brunt of the sudden blow. Ideally, companies should aim for what Nassim Nicholas Taleb has called an
‘antifragile’ approach, going ‘beyond resilience and robustness’ so that they can adapt to, and even thrive on, disorder.”
—— Financial Times, April 21, 2020
“As the situation began to unfold, we built inventory in both raw materials and finished goods to mitigate risk and to help us to continue
meeting demand… This proactive approach coupled with our experienced and dedicated team, has enabled us to consistently deliver strong
customer service levels.”
—— Michele G. Buck, President and CEO, The Hershey Co., April, 23, 2020
“We believe that the focus of the government on infrastructure, on encouraging manufacturing, the trend of localization in supply
chains after the covid-19 crisis—all of these will create opportunities for us in the medium- to long-term. We are bullish about
these prospects.”
—— T.V. Narendran, CEO and MD at Tata Steel Ltd., April 27, 2020
“The downward trend in inventory-to-sales ratios since the early 1990s could reverse as manufacturers, wholesalers and retailers store
materials and products closer to manufacturing centers and consumers…The COVID-19 crisis has underscored the fragility of just-in-time
(JIT) production networks... These JIT systems are now susceptible to closed manufacturing facilities, ports and borders due to the COVID-
19 crisis. A March survey by the Institute for Supply Management found that nearly 75% of business respondents have experienced supply
chain disruptions and more than 80% believe they will in the future. As a result, many businesses are planning major restructuring of their
supply chain processes.”
—— CBRE, May 14, 2020
11Global Funds Are Under Allocated To APAC With Over
75% Investors Indicating Plans To Boost Allocation To The
Region
Superior growth prospects coupled with strong
Capital flows are already starting to pivot towards demographic and urbanisation trends are fuelling
APAC, but APAC still remains under-penetrated demand for APAC
Expected change in capital flows into different markets over the next five
Total cross-border investment transaction breakdown by region years
20% APAC 6.9
27% 24%
31%
Europe 6.2
51%
57%
60% 51%
Americas 6.1
29% Middle East / Africa 5.8
18% 19%
13%
2017 2018 2019 1H 2020 0 1 2 3 4 5 6 7 8 9
APAC EMEA Americas Large Stay Large
decline the same increase
Source: Real Capital Analytics Source: PwC, Emerging Trends in Real Estate, 2020
12Capital Allocation Increasingly Skewed Towards Funds
Focused On Logistics Due To E-commerce
As investors have shifted focus in favour of logistics, investments in logistics sector have surpassed retail
% of global investment
30
c.25% of investment
volume
20
10
Logistics deal activity in
1Q2020 continued to
surpass retail, evidencing
investors’ unwavering
interest in the sector
0
Q3 Q3 Q3 Q3 Q3 Q3 Q3 Q1
2008 2010 2012 2014 2016 2018 2019 2020
Retail Industrial
Logistics
Investors will continue to cycle out of retail and into logistics given the transformative
impact of e-commerce
Source: Real Capital Analytics 13“New Economy” Real Estate Has Significantly
Outperformed “Old Economy” In Public Markets
YTD share price performance (%)(1)
Europe 12.1% Japan
23.0%
(34.8%) (38.0%)
(61.1%) (27.6%) (30.1%)
Office Retail Hotel Logistics (37.2%)
Office Retail Hotel Logistics
Hong Kong
19.8%
(28.3%) (23.8%)
(45.2%)
(2)
Office Retail Hotel Logistics
US 28.3% Singapore Australia
25.5%
10.0% 13.2% 38.9%
(27.8%)
(20.2%) (24.1%)
(52.9%) (50.5%) (35.9%)
Office Retail Hotel Data Logistics Office Retail Hotel Data Logistics (28.7%)
(34.8%)
Center Center Office Retail Logistics
Notes:
(1) Market data as of August 14, 2020, each sector performance based on market cap weighted share price performance
(2) Excluding Jinmao Hotel due to privatisation
14Risk/Reward For Logistics Will Continue To Transform
Capital Values
Potential for meaningful cap rate compression in the APAC logistics real estate sector
Spreads between logistics & office cap rates 1
2.1%
1.3%
~190bps
~110bps
0.2%
US China North Asia (ex-China)
Cap rate tightening and differential shrinking will drive higher logistics asset values, generating outsized returns for the asset class
Key logistics hubs in APAC offer more attractive premia
Logistics gross rental yields over costs of debt2
(Basis points)
365 350 333 310 300
255 225
180 175
100
51
Shanghai
Singapore
Beijing
US average
Osaka
Seoul
Melbourne
Sydney
London
Tokyo
Guangzhou
APAC offers more attractive valuation premium spreads compared to more mature markets in the US and UK
Source: Real Capital Analytics, NCREIF, JLL, 4Q 2019
Notes:
(1) U.S. primary office markets (Seattle, San Francisco, Los Angeles, Boston, New York, Chicago, Washington D.C., Silicon Valley-San Jose); U.S. primary industrial markets (Atlanta, Chicago, Dallas, Inland Empire, Los Angeles,
Northern NJ, Oakland-East Bay, Philadelphia and Eastern PA). China: simple average of Beijing, Shanghai & Guangzhou; North Asia: simple average of Tokyo, Osaka & Seoul
(2) As of 2019. Debt costs are based on investment grade borrowers, core stabilized assets fixed pricing on typical market maturi ties. In the calculation of the market yield, the transaction costs of purchasing or leasing of space are 15
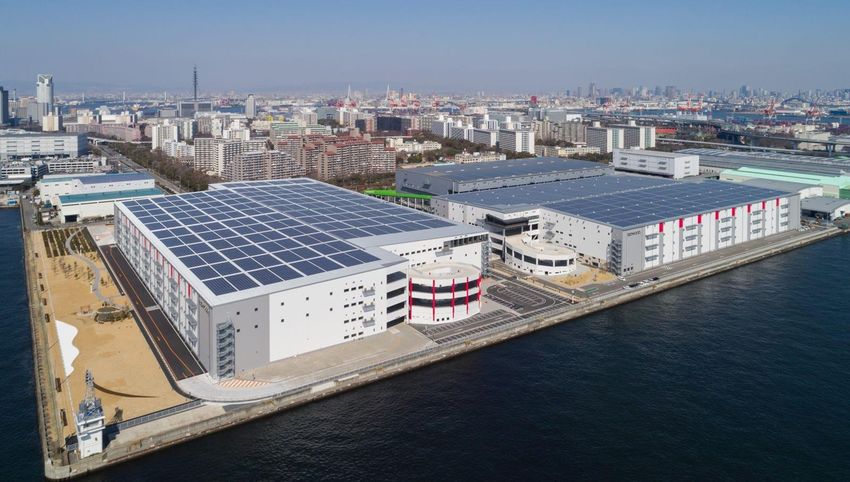
not included. The market yield therefore reflects the returns to investment before transaction costs, assuming full occupancy and that the current income being paid is the market effective rentSection 2 1H 2020
Operations
Overview
RW NankoNaka DC, Japan
16#1 APAC Focused Logistics Real Estate Platform
with Top Positions in Its Respective Markets
◼ ESR has over 18.7 million sqm GFA in operation and under development1 and a further c7.2 million
sqm GFA of development pipeline with MOUs2 signed across top tier markets with a high quality tenant base
1. China Platform 4. India Platform
Quickly emerged as one of the
leading logistics developers in
#1 e-commerce landlord4 India
1 China Formed c. US$1 billion
#1 development pipelines5 development JV with a real
estate investor based in
#2 largest portfolio of logistic Germany8
2 South Korea properties6 Over 2 million sqm GFA
with MOUs signed since 2017
2. South Korea Platform 5. Singapore Platform
3 Japan
#1 non-Temasek affiliated
#1 largest owner of logistics industrial REIT platform9 of 75
properties10
4 stock7
India Announced potential merger
with Sabana REIT
#1 development pipeline in (AUM:S$0.9 billion); combined
AUM the Seoul Metropolitan Area7 AUM of US$4 billion for
(US$ billion) 5 Singapore enlarged ESR-REIT
3
26.5
3. Japan Platform 6. Australia Platform
20.2 US$2 billion of AUM with a
6 Australia development pipeline of
US$200 million
#1 development pipeline in
the Greater Tokyo and Greater Launched two funds in YTD
Osaka regions7 2020 of A$2 billion
1H 2019 1H 2020
Largest shareholder of
Centuria11 (AUM: A$9.4 billion)
Notes:
(1) Consisting of approximately 10.6 million sqm of GFA of completed properties, approximately 4.3 (7) By GFA from 2019 to 2020
million sqm of GFA of properties under construction and approximately 3.8 million sqm of GFA to (8) Total initial capital commitments in the India Fund of US$225.9 million, with the potential to increase
be built on land held for future development as of 30 June 2020 to US$428.2 million. Based on the indicated leverage ratio of each fund, the total development size
(2) MOUs as of 31 July 2020 of the JV will be c.US$1 billion
(3) As of 30 June 2020 (9) In terms of number of assets
(4) In terms of proportion of total area occupied in China in comparison to only GLP as of September (10) Including 57 properties in ESR REIT and 18 properties in Sabana REIT as of 30 June 2020
2017 when GLP was privatised (11) 18% stake in Centuria 17
(5) In Greater Shanghai, Greater Beijing and Greater Guangzhou from 2020 to 2021
(6) As of 4Q 2019, in Greater Shanghai, Greater Beijing and Greater Guangzhou as measured by GFAYTD 2020 Strategic Achievements
Strong track record in growing AUM and deepening our presence
in core markets Completion of US$368m acquisition
of ESR Kuki Distribution Centre from
RJLF II in JV with AXA Investment
Managers - Real Assets
Plans to develop a 36-
Plans to build Plans to acre industrial &
76.84-acre develop logistics park in
logistics park in modern Chennai, India
Sohna, New Delhi logistics
facility, ESR
To invest JPY27b Ukishima
to develop ESR Distribution Jun 2020 AUM
Yatomi Kisosaki Centre on a
Distribution Centre 32,227 sqm US$26.5b
– the largest site in the
facility in Greater Greater Tokyo
Nagoya Bay Area
Completion of new
Issued S$225m Manulife-ESR JV
5.1% five-year acquisition of PGGM's
notes real estate portfolio for
FY2019 AUM RMB1.7b
US$22.1b Completion of ESR
Amagasaki Distribution
Centre, the largest
US$1b development logistics warehousing
JV (ESR-KS II) with project in APAC
APG and CPPIB in
Signed new South Korea Purchase of 79 ha site
Drawdown of in Southeast Melbourne
72,392 sqm lease US$250m 3-year
with Amazon at Launched A$1b to be held in EADP
unsecured term develop-to-hold fund
Kuki City, Saitama loan at Libor +3% ESR Australia Signed new 71,736
Development sqm lease with Daiwa
US$500m JV with Launched A$1b Partnership (EADP)
GIC for Corporation at ESR
ESR Australia
development of Kawasaki Yako
Logistics Acquisition of three
logistics facilities in Distribution Centre in
Partnership prime properties in
China Tokyo Bay, Japan
(EALP) East China’s Jiangsu
province
18Strong Performance And Momentum For 1H 2020
▪ Maintained high portfolio occupancy of 91%1
▪ Well-staggered WALE of 3.8 years2
Investment ▪ Strong leasing performance with 0.9 million sqm leased across
portfolio
▪ Achieved 4.0% rental reversion on renewed leases1
▪ Total AUM rose 31% y-o-y to US$26.5 billion3
Fund
▪ Fund AUM grew 35% y-o-y to US$23.7 billion3
Management ▪ Fund management fees increased 35% y-o-y to US$84 million
▪ New development starts of US$0.8 billion; targeting over US$2 billion
in 2H 2020
▪ Development completions of US$2.2 billion
Development ▪ Landbank of over 3.8 million sqm across portfolio
▪ Over US$601 million of capital recycled from assets on balance sheet
to ESR managed funds
Notes:
(1) Based on stabilised assets on balance sheet as at 30 June 2020
(2) Based on assets on balance sheet and portfolio assets in funds and investment vehicles by leased area as at 30 June 2020 19
(3) As at 30 June 2020Leased over 0.9 million sqm of space in 1H 2020
1H 2020 leasing highlights – top five leases by area
E-commerce E-commerce E-commerce
Cold Chain Manufacturing
& 3PL & 3PL & 3PL
Coupang Amazon ROKIN Lotte Logistics BMW
Tenant
Market Korea Japan China Korea India
Area leased in
1H 2020 74 72 71 49 25
(‘000 sqm)
Lease term
4 5 2-7 3 10
(years)
Robust demand for logistics space across platform from quality creditworthy tenant base
20Strategically Diversified In 6 Key APAC Markets
Resilient to market changes and disruptions
Revenue Contribution AUM By Region1 GFA By Region1
By Region1,2
India India
India Australia 2% 7%
3% 7%
China Australia
31% China 6% China
Australia 23% 41%
21% Singapore
11%
Singapore
10%
Singapore
8%
Japan
18%
South Korea Japan South Korea
Japan 13% 30% 27% South Korea
24% 18%
As of 30 June 2020
Notes:
(1) GFA includes completed properties, properties under construction and GFA on land held for future development. AUM includes portfolio assets owned directly by ESR and portfolio assets held in
the funds and investment vehicles
(2) Revenue excludes contribution from construction income
21Section 3 1H 2020
Financial
Overview
Goyang Logistic Park, Korea
221H 2020 Financials Key Highlights
Revenue Adjusted EBITDA1 Profit After Tax
(US$ million) (US$ million) (US$ million)
198
145
+26.9%
156 72.1%
151
+20.6%
125
84
1H 2019 1H 2020
1H 2019 1H 2020 1H 2019 1H 2020
▪ Delivered strong earnings across key business segments
▪ Well-diversified contributions from ESR’s six markets
Note:
(1) Adjusted EBITDA is calculated as profit before tax, adding back depreciation and amortization, exchange loss/(gain), finance costs, equity-settled share option, the listing expenses, and
eliminating the effect of interest income, and fair value gains on completed investment properties and investment properties under construction
23Robust Balance Sheet To Support Growth
Disciplined capital management; Continue to reduce finance costs with lower
borrowing rates
Net Debt1 Net Debt / Equity
(US$ million) (%)
1,908 73.5%
1,793 1,687
3,251 59.8%
3,189
2,804 2,855 51.9%
2,439 2,571
1,010 884 947
1H 2019 FY2019 1H 2020 1H 2019 FY2019 1H 2020
Total equity Total debt and other borrowings Cash and bank balances Net debt
Net Debt / Total Assets Finance Costs
(%) (US$ million) 185
2
30.2%
28.6% 38
26.6%
38 Redeemed
85 or repaid
18 77
1 4
11 1
26 29
10 85 3-
2 44
35
1H 2019 FY2019 1H 2020 1H 2019 FY2019 1H 2020
Interest expense on bank loans Interest expense on other borrowings
Note: Interest expense on Hana Interest expense on RCPS
(1) Excludes redeemable convertible preference shares (RCPS) Interest expense on bonds Interest expense on lease liabilities
Demonstration of Management’s ability to materially reduce borrowing costs
with healthy debt maturity profile of 3 years 24Capital Recycling Initiatives In 1H 2020
US$601 million of capital recycled from assets on balance sheet to ESR
managed funds
Gross Divestment
Transactions in 1H 2020
Value
Divestment of five on-balance assets in
US$93 million
China to ESR-GIC JV
71-91 Whiteside Rd, Clayton, Victoria
Divestment of 20 assets in Australia as part
of the Propertylink acquisition seeded into US$508 million
ESR Australia Logistics Partnership (EALP)
Total: US$601 million1 122 Newton Road, Wetherill Park, New South Wales
Disciplined strategy to enhance financial flexibility to seize potential opportunities
Note:
(1) Net cash recycled back (after deducting borrowings and other payables) are as follows:
- US$118 million from the divestment of China assets, of which US$39 million was receivable 25
- US$103 million from the divestment of Australia assets. The amount was received in July 2020Key Drivers Of Our Three Pillars Of Business
A B C
Investments Fund Management Development
– Completed B/S properties
– Base / Asset management fees – B/S development profits
➢ Rental income + revaluation gains
– Development fees ➢ Revaluation gains on U/C properties +
– Fund co-investments(1)
disposal gain on sale
Income ➢ Pro rata earnings – Acquisition fees
– Leasing fees – Funds’ development profits(1)
– Listed securities
➢ Dividend income – Promote fees – Construction income
– Solar energy income
– Direct costs for rental and solar energy income – Construction costs
Expenses – Allocated administrative expenses
– Allocated administrative expense – Allocated administrative expenses
✓ Rental growth and high occupancy ✓ Strong Fund AUM growth ✓ Significant development pipeline (B/S, funds)
✓ Cap rate compression ✓ Significant development pipeline in funds ✓ Track record of strong development profit
Key drivers margins
✓ High dividend payout from listed ✓ Promote Fee opportunity
securities ✓ Asset recycling from B/S or development
funds into core funds / REITs
1H 2020
Segmental US$109 million US$64 million US$127 million
result
% contribution % contribution % contribution
36.2% 21.5% 42.3%
Combined segmental EBITDA: US$300 million
D US$24 million corporate and other unallocated costs
Total Interim Segmental Result: US$276 million
Note:
(1) Based on allocated share of profits from FVTPL funds and JV funds to each of Investment and Development segments 26A Investment Segment
Healthy broad-based demand with strong occupancy maintained
Portfolio Lease Expiry Profile By Area1 Investment Segmental Result
Assets held on Balance Sheet Assets held in Funds (US$ million)
29%
25%
109
18% 99
15% 16%
12%
11% 9%
11% 11%
9% 9%
6% 7%
4% 4%
2% 2%
2020 2021 2022 2023 2024 2025
and beyond
As at 30 Jun 2020 Assets held
Assets held
on Balance Portfolio
in Funds
Sheet
1H 2019 1H 2020
WALE (by area) 2.9 years 4.0 years 3.8 years
WALE (by income) 3.1 years 4.0 years 3.8 years
▪ Strong WALE of 3.8 years2 by both leased area and by income
▪ Maintained high occupancy of 91%3 across portfolio
▪ Achieved positive rental reversion of 4% on renewed leases3
Notes:
(1) As at 30 June 2020
(2) Based on assets on balance sheet and portfolio assets held in the funds and investment vehicles
27
(3) Based on assets on balance sheet and stabilised assetsA Investment Segment
E-commerce remains key driver of demand representing 63% of portfolio
Portfolio Top 10 Tenants By Income1 Lease Profile By End User Industry
(%)
Others
JD.com 9.3% 10%
Retail
Coupang 8.5% 11%
Softbank Group Corp 6.1%
Lease
ZENY 3.7% Manufacturing Profile
10% by Area1
Amazon 2.9%
Mitsubishi Fuso Trucks
2.6%
and Buses Cold Chain
6%
The State of Queensland 1.7%
Askul Corporation 1.5%
Top 5 63%
E-commerce and
Samsung C&T 1.4% Portfolio tenants 3PL companies
are e-commerce
related
Carrefour 1.4%
E-commerce related
▪ E-commerce growth and expansion by repeat tenants remain key leasing drivers
▪ Healthy leasing activity with 0.9 million sqm of space2 leased across portfolio
Notes:
(1) Based on income for 1H 2020 28
(2) Based on assets on balance sheet and portfolio assets held in the funds and investment vehiclesB Fund Management Segment
Fund AUM rose 35% y-o-y to US$23.7b
Evolution in Total Assets Under Management (Dec 2018 to Jun 2020)
(US$ billion)
26.5
16.9
22.1
20.2
12.4
11.2
16.0
9.3
6.7 6.8
6.3
4.8
2.7 2.9 2.8
1.9
31 Dec 2018 30 Jun 2019 31 Dec 2019 30 Jun 2020
Balance Sheet Core Funds Development Funds Fund AUM
Accelerating growth of fund management business demonstrates strong investor confidence
29B Fund Management Segment
Strong fundraising support with US$3.6b of committed but uncalled capital
Fund Income Fund Management Segmental Result
(US$ million) (US$ million)
84
64
62 50
1H 2019 1H 2020 1H 2019 1H 2020
Fund Income 1H 2019 1H 2020 Capital Raised (US$ billion) 1H 2019 1H 2020
% of AUM (annualised)1 0.5% 0.5% Equity committed 6.3 9.0
% of invested capital 1.4% 1.5% Undrawn capital 2.0 3.6
Capital raised 1.0 2.4
Strong recurring income base from fees collected from blue chip investors
Note: 30
(1) The fund income % of AUM for FY2019 is 0.8%B ESR’s Capital Raising By Market
In 1H 2020, ESR’s total AUM increased US$4.4 billion from FY2019, capital commitments grew
US$2.4 billion and uncalled capital totaled US$3.6 billion
Japan
AUM (US$ billion)
Total 7.7 8.0
1.2
AUM (US$ billion) 3.6
26.5
22.1
Dec 19 Jun 20
South Korea
AUM (US$ billion)
7.2 1.5
Dec 19 Jun 20 4.6 New LPs in 1H2020
Dec 19 Jun 20
India1
China
AUM (US$ billion)
AUM (US$ billion)
6.1 0.6
0.1
0.5 4.8
0.4 New LPs in 1H 2020
Dec 19 Jun 20
Dec 19 Jun 20
Singapore Australia
AUM (US$ billion) AUM (US$ billion)
2.0 0.2
3.0 2.8
1.5
NA New LP in 1H 2020
AUM increase Uncalled Capital Dec 19 Jun 20
Dec 19 Jun 20
Note: 31
(1) Mainly due to foreign exchange rate and capital deployed yet to be fully leveragedB Investment Vehicles Under Management
Raised US$2.4 billion new capital in 1H 2020
Capital
Fund AUM Uncalled Capital Interest Held By GFA
Inception Date Category Commitments1
(US$ million) (US$ million) ESR (%) ('000 sqm)
(US$ million)
e-Shang Star Cayman Limited May 14 Development 1,827 863 156 25.6 2,017
RCLF I Jul 12 Development 685 440 - 2.3 1,009
China
China Invesco Core Fund Oct 17 Core 323 190 - 16.3 371
NCI Core Fund Jan 19 Core 275 159 - 10.0 325
GIC Dec 192 Development 899 500 396 51.0 637
Manulife Mar 20 Core 168 265 93 1.5 219
RJLF II Apr 18 Development 1,650 582 109 0.0 587
Japan
ESR Japan Core Fund Dec 18 Core 1,025 396 - 17.0 421
RJLF III Jun 19 Development 1,661 703 537 20.0 318
Other investment vehicles Various Development 2,836 1,134 504 Various 1,016
South Korea Development Fund I Nov 15 Development 3,224 1,150 337 20.0 2,356
South
Korea
South Korea Core Fund Jul 18 Core/Core Plus 1,248 500 153 10.0 613
South Korea Development Fund JV 2 Jun 20 Development 2,466 1,000 978 20.0 160
AMC Projects - Core 260 NA NA NA 186
Singapore
ESR REIT 2006 REIT 2,240 NA NA 9.3 1,403
Sabana REIT 2010 REIT 601 NA NA 20.9 383
PEP Aug 16 Value Add 3 48 0.0 25.0 3
50 Ann PEP May 17 Core Plus 137 62 0.0 25.0 26
PAIP II Sep 15 Core Plus 221 99 0.0 17.5 150
Australia
PCII Nov 15 Core 24 10 0.0 7.5 10
POP III Feb 19 Core Plus 90 41 0.0 11.2 20
PACT Dec 17 Value Add 216 54 0.0 15.0 15
EALT Nov 19 Core Plus 232 121 55 20.0 94
EOP IV Dec 19 Core Plus 103 45 0.0 11.2 22
EALP Jul 20 Core Plus 925 416 187 55.0 465
India
ESR India Logistics Fund Nov-18 Development 378 226 95 50.0 664
TOTAL OF ALL FUNDS 23,718 9,003 3,601 13,488
New funds announced in 2H 2020
Australia EADP3 Development 693 - 100.0 -
Notes:
(1) The commitment represents the aggregate capital commitments to the fund or investment vehicle, as applicable, including capital commitments by third-party investors and the general partner or investment manager. Foreign
currency commitments have been converted into U.S. dollars based on: (i) the foreign exchange rate at the date of purchase for each investment; and (ii) the exchange rate that prevailed on 30 June 2020, in the case of uncalled
commitments 32
(2) JV agreement was signed in December 2019 and announced in January 2020
(3) Announced in June 2020, there was no drawdown of commitment then. Hence ESR’s equity stake is at 100% but will be reduced as LP’s capital commitments are drawn down
(4) ‘C Development Segment
Asset-light on balance sheet while strengthening valuation
Development Starts Development Completions Land Bank
Estimated Investment Value (US$ billion) Estimated Investment Value (US$ billion) GFA (million sqm)
2.2 US$2.5 bil US$3.9 bil
2.1
3.8
0.8
0.7
1.4
2.8
1.4 2.3
1.6
0.3
0.2
1.5
1.2
0.1
0.04 0.02 0.1
1H 2019 1H 2020 1H 2019 1H 2020 1H 2019 1H 2020
Assets held on Balance Sheet Assets held in Funds Land held on Balance Sheet Land held in Funds
Estimated Investment Value & Investment Vehicles
GFA (million sqm) 1H 1H GFA (million sqm) 1H 1H GFA (million sqm) 1H 1H
2019 2020 2019 2020 2019 2020
Assets held on Balance Sheet 47% 12% Assets held on Balance Sheet 3% 5% Land held on Balance Sheet 43% 41%
Assets held in Funds & 53% 88% Assets held in Funds & 97% 95% Land held in Funds & 57% 59%
Investment Vehicles Investment Vehicles Investment Vehicles
Continue to leverage third party capital to fund development starts
33C Development Segment
Robust development pipeline with strong landbank for expansion
Development Pipeline Development Segmental Result
(million sqm) (US$ million)
Development Under
MOU1 Land
Pipeline Development
127
China 6.6 3.5 2.1 1.1
102
Japan 3.6 1.8 0.9 0.9
South Korea 2.7 1.5 0.5 0.8
Australia 0.5 0.04 0.08 0.3
India 1.9 0.5 0.8 0.7
Total 15.3 7.2 4.3 3.8 1H 2019 1H 2020
▪ Assembled strong landbank for sustainable and recurring development profits
▪ US$601 million of assets recycled from the balance sheet into EALP and ESR-GIC JV
Note:
(1) MOUs as of 31 July 2020
34Summary Of 1H 2020 Financial Performance
US$ million 1H 2019 1H 2020 Variance
Revenue 156 198 26.9%
Investment 56 59 4.4%
Fund Management 62 84 35.3%
Development 38 55 46.6%
Segmental Results (EBITDA) 252 300 19.1%
Investment 99 109 9.3%
Fund Management 50 64 29.0%
Development 102 127 23.8%
Corporate and other unallocated expenses (29) (24) (18.4%)
Total EBITDA 212 269 27.3%
PATMI 76 133 75.1%
Core PATMI
70 121 71.9%
(ex. revaluation from completed properties)
▪ Revenue increased by 26.9% y-o-y to US$198 million mainly due to higher fees from fund
management segment and construction income from the development segment
▪ Increase in segmental results (EBITDA) driven by increase in fee income, as well as gains
realized through investment properties and properties under development
▪ Growth in Core PATMI continues to be supported by strong recurring income such as fees
collected from fund management
35Summary Of 1H 2020 Balance Sheet
Variance Variance
US$ million 1H 2019 FY2019 1H 2020 (1H 2020 VS (1H 2019 vs
FY2019) 1H 2020)
Total Assets 5,946 6,352 6,662 4.9% 12.0%
Cash 1,010 884 947 7.1% (6.2%)
Total debt and other borrowings 2,804 2,571 2,855 11.0% 1.8%
Net Debt 1,793 1,687 1,908 13.1% 6.4%
Net Debt / Total Assets 30.2% 26.6% 28.6% 2.0pp (1.6pp)
▪ Stronger cash position of US$947 million as at June 2020, an increase of 7.1% from Dec 2019
▪ Total debt and borrowings were higher in 1H 2020 to fund the Group’ investments and ongoing
developments
▪ Healthy gearing at 28.6%
▪ Materially reduced cost of borrowings with healthy debt maturity profile of 3 years
- Issued S$225 million five-year notes at 5.1% in February 2020 – reducing borrowing costs
by 150bps since last issuance in April 2019, and two year addition to bond tenure
- Drawdown of US$250 million three-year unsecured senior term loan in March 2020 at
Libor +3%
36Section 4 Outlook
74-84 Main Road, Clayton, Victoria,
Australia
37Going Forward
E-commerce acceleration driving fundamental structural changes to consumption
patterns which will benefit the logistics sector
1 Deepen presence 2 Integrated 3 Fund 4 Capital
in APAC Platform Management Growth Management
▪ Significant ▪ Largest APAC ▪ Continued strong ▪ Demonstrated
undersupply of focused logistics demand from best- ability to raise
modern real estate platform in-class institutional attractive debt
warehouses in the investors to invest in
▪ Healthy ▪ Well-capitalised
Asia Pacific region logistics sector in
development balance sheet with
Asia
▪ Actively exploring pipeline going strong liquidity
opportunities in key forward and an ▪ Agile and strategic in position
markets and growth active capital sourcing capital
▪ Diversified sources
locations recycling model ▪ On track to grow of funding
▪ Network of high- ▪ Integrated fund management
▪ Disciplined capital
quality tenants and development business through
management to
best-in-class capital platform to meet new funds
support growth and
partners tenants’ growing
investment
demand
capabilities
Well-positioned to participate in M&A and partnership opportunities
across the Asia Pacific region
38Section 1 The End
Kunshan Friend Park I, China
39Section 5 Appendix
ESR Chakan 1 Industrial & Logistics
Park, India
40Statements Of Profit Or Loss
Interim period ended 30 June
US$ million 2019 2020
Revenue 156 198
Cost of sales (42) (61)
Gross profit 114 137
Other income and gains, net 165 169
Administrative expenses (91) (86)
Finance costs (83) (72)
Share of profits and losses of joint ventures, net 18 44
Profit before tax 123 192
Income tax expense (39) (47)
Profit for the year 84 145
Attributable to:
Owners of the parent 76 133
Non-controlling interests 8 12
84 145
41Statements Of Financial Position
31 December 30 June
US$ million 2019 2020
Non-current assets
Property, plant and equipment 31 31
Right-of-use assets 12 15
Investments in joint ventures 698 911
Financial assets at fair value through profit or loss 589 611
Financial assets at fair value through other comprehensive income 543 534
Investment properties 2,786 2,586
Goodwill and other intangibles 433 429
Other non-current assets 64 57
Total non-current assets 5,156 5,174
Current assets
Trade receivables 89 104
Prepayments, other receivables and other assets 129 298
Cash and bank balances 884 947
Assets held for sale 94 139
Total current assets 1,196 1,488
Current liabilities
Bank loans and other borrowings 232 570
Lease liabilities 6 6
Trade payables, accruals and other payables 230 276
Liabilities held for sale 21 47
Total current liabilities 489 899
Net current assets 707 589
Total assets less current liabilities 5,863 5,763
42Statements Of Financial Position (Cont’d)
31 December 30 June
US$ million 2019 2020
Non-current liabilities
Deferred tax liabilities 211 234
Bank loans and other borrowings 2,339 2,284
Lease liabilities 17 9
Other non-current liabilities 45 47
Total non-current liabilities 2,612 2,574
Net assets 3,251 3,189
Equity
Equity attributable to owners of the parent
Issued capital 3 3
Perpetual capital securities 97 -
Other reserves 2,926 2,979
Non-controlling interests 225 207
Total equity 3,251 3,189
43ESG Strategy & Achievements Corporate Performance
In 2019
People & Partners Property Portfolio
People & Partners Property Portfolio Corporate Performance
Creating a positive and supportive Develop and manage modern, state- Effective corporate governance is
environment is our social responsibility of-the-art logistics facilities for the new critical to our success, providing the
to the communities in which we economy and help create the foundation for sustained growth over
operate, and to our employees, our backbone for the 21st century the long term
tenants and our suppliers commerce across Asia Pacific
Diversity Solar Power Corporate Governance
Implemented Board diversity policy • Robust pipeline of rooftop solar ESR Australia development and
and workplace diversity power initiatives providing a total of implementation of a new Modern
50MW of clean energy installed Slavery Policy to eradicate all forms of
Customer Engagement capacity modern slavery throughout our value
6 day care centres in our Japan • ESR Australia installed energy- chain
properties efficient lighting in 12 properties,
representing 23% of portfolio by Disclosure & Reporting
Corporate Social Responsibility GFA 7 unlisted portfolios in Australia, China,
▪ ESR Smart Program in India Japan and South Korea were
equips local schools with Climate Risk Assessment submitted for GRESB, which revealed
computer centres and ESR Australia is developing a climate opportunities for better alignment
scholarships for high-performing risk assessment framework (mid-2020) across the Group
graduates from local secondary
schools Sustainable Building Certifications Risk Management
▪ >60hours of community service ▪ 50 properties obtained certifications Implemented group wide risk
(South Korea office) in 2019 in accordance with globally management system and ESG
▪ Qin Charity Fund provides recognised standards including screening for supply chain and
educational and extracurricular LEED and CASBEE customers
courses for underprivileged ▪ WELL Gold Certification for Bucheon
children living in rural China Logistics Park (South Korea) 44You can also read