Technical Assistance Consultant's Report - Asian ...
←
→
Page content transcription
If your browser does not render page correctly, please read the page content below
Technical Assistance Consultant’s Report

Project Number: 43079
September 2013

Mongolia: Updating the Energy Sector Development
Plan
(Financed by the Japan Fund for Poverty Reduction)

Prepared by E. Gen Consultants Ltd. Bangladesh in association with MVV decon GmbH,
Germany, and Mon-Energy Consult, Mongolia

For Ministry of Energy, Mongolia

This consultant’s report does not necessarily reflect the views of ADB or the Government concerned, and
ADB and the Government cannot be held liable for its contents. (For project preparatory technical
assistance: All the views expressed herein may not be incorporated into the proposed project’s design.
Updating Energy Sector Development Plan
               EXECUTIVE SUMMARY

Prepared for
The Asian Development Bank
and
The Mongolian Ministry of Mineral Resources and Energy

                          Prepared by

                         in association with

                  S e p t e m b e r 2 013
ADB Mongolia
Updating Energy Sector Development Plan (TA No. 7619-MON)                         Executive Summary

                                   CURRENCY EQUIVALENTS
                                       (As of June 2013)

                             Currency Unit             –        Tugrik (MNT)
                                 USD 1.00              =        1,435 MNT
                                 EUR 1.00              =        1,880 MNT
                                 USD 1.00              =        0.759 EUR

                                              ABBREVIATIONS

                         ADB              –        Asian Development Bank
                         AuES             –        Altai-Uliastai Energy System
                         CES              –        Central Energy System
                         CFB              –        Circulating Fluidized Bed
                         CHP              –        Combined Heat Power
                         CO2              –        Carbon Dioxide
                         CPI              –        Consumer Price Index
                         EA               –        Energy Authority
                         EHV              –        Extra High Voltage
                         ERES             –        Eastern Energy System
                         EUR              –        European currency unit EURO
                         GHG              –        Greenhouse Gases
                         HOB              –        Heat Only Boilers
                         IDC              –        Interest during construction
                         LCOE             –        Levelized Cost of Energy
                         MoE              –        Ministry of Energy
                         MNT              –        Mongolian Tugrik
                         NOx              –        Nitrogen Oxides
                         O&M              –        Operation and Maintenance
                         PPA              –        Power Purchase Agreement
                         PV               –        Photovoltaic
                         SOx              –        Sulfur Oxides
                         USD              –        United States Dollars
                         VAT              –        Value Added Tax
                         WACC             –        Weighted Average Cost of Capital
                         WRES             –        Western Energy System

                                               1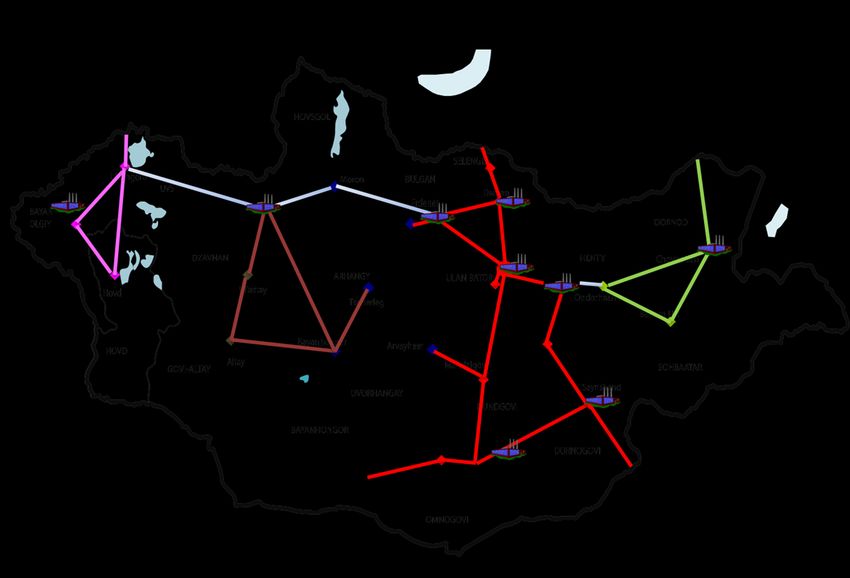
ADB Mongolia
Updating Energy Sector Development Plan (TA No. 7619-MON)                          Executive Summary

                                       UNITS OF MEASURE

                            GCal          -       Gigacalorie (one million kilocalories)
                            GJ            -       Gigajoule (one thousand megajoules)
                            kJ            -       Kilojoule
                            kWh           -       Kilowatt-hour
                            MWh           -       Megawatt-hour
                            MWel          -       Megawatt electric
                            MWth          -       Megawatt thermal
                            PJ            -       Petajoule
                            TSC (TPU)     -       Tons of standard coal
                            TJ            -       Terajoule

                                   WEIGHTS AND MEASURES

                     GW (giga watt)               –     1,000,000,000 calories
                     GJ (giga joules)             –     1,000,000,000 joules
                     GW (giga watt)               –     1,000,000,000 watts
                     kVA (kilovolt-ampere)        –     1,000 volt-amperes
                     kW (kilowatt)                –     1,000 watts
                     kWh (kilowatt-hour)          –     1,000 watts-hour
                     MW (megawatt)                –     1,000,000 watts
                     W (watt)                     –     unit of active power

                                     CONVERSION FACTORS

                     1 GCal               =       4.19 GJ
                     1 BTU                =       1.05506 kJ
                     1 Gcal               =       1.1615 MWh = 4.19 GJ = 1.75 steam tons/hour
                     1 GJ                 =       0.278 MWh = 0.239 Gcal = 0.42 steam tons/hour
                     1 MW                 =       0.86 Gcal/hour = 3.6 GJ = 1.52 steam tons/hour
                     1 TSC                =       7 Gcal = 29.3 GJ = 8.15 MWh

                                              2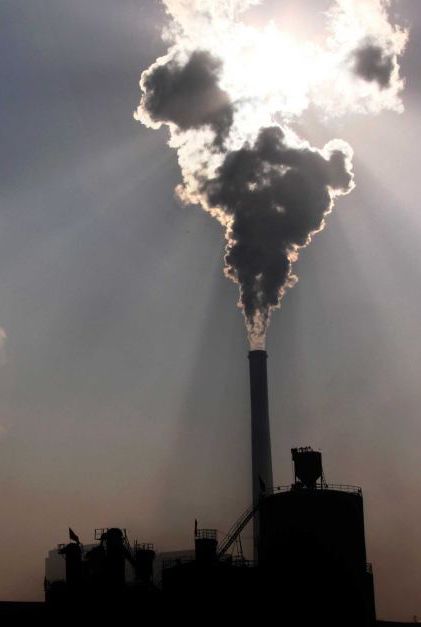
ADB Mongolia
Updating Energy Sector Development Plan (TA No. 7619-MON)                    Executive Summary

                                         I.       INTRODUCTION

A.     Energy Masterplan

1.     The Energy Masterplan is organized as an Executive Summary with three parts A, B and C
comprising a total of 10 volumes. Part A deals with past performance, current situation and
demand projections to the end of the planning horizon, Part B deals with expansion plans, and
Part C deals with implementation issues. The detailed structure of the Energy Masterplan is as
follows:-

       Executive Summary
       PART A
       Volume I:     Energy Sector Policy Review
       Volume II:    Economic Scenarios
       Volume III:   Electricity Forecasts
       Volume IV:    Heat Forecasts
       PART B
       Volume V:     Primary & Secondary Energy
       Volume VI:    CES Expansion Plan
       Volume VII: Aimag Heat Expansion Plan
       Volume VIII: Small Energy System Expansion Plan
       Volume IX: Transmission Expansion Plan
       PART C
       Volume X: Financial Analyses

B.     Contents of Executive Summary

       Section I     This Introduction
       Section II    Heat Forecasts
       Section III   Electricity Forecasts
       Section IV    Expansion Plan
       Section V     Finance Considerations
       Section VI    Policy Note
       Section VII   Investment Long List

                                              3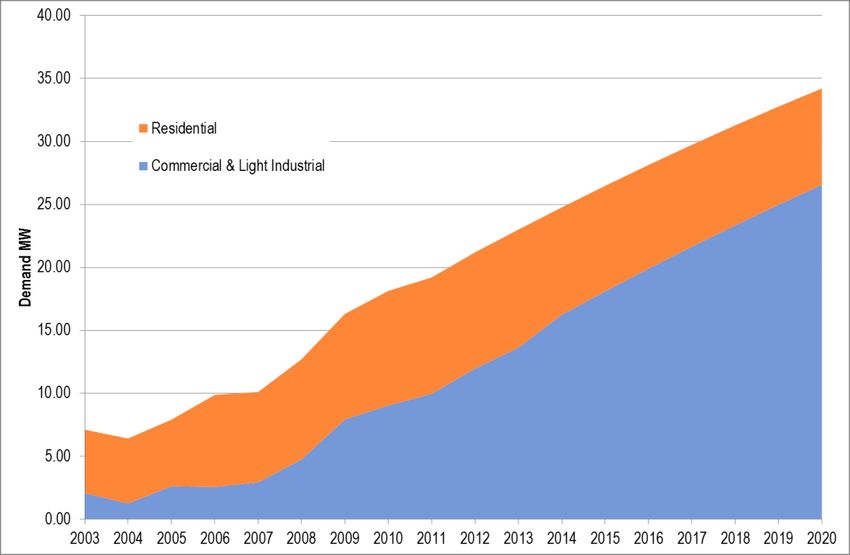
ADB Mongolia
Updating Energy Sector Development Plan (TA No. 7619-MON)                                           Executive Summary

                                                 II.         HEAT FORECASTS

C.          UB Heat Demand

1.     Heat production determines the amount of cogeneration and condensing power that can be
generated by each power plant. In the case of space heat, the heat production is determined by
outdoor temperature relative to a target indoor temperature, accordingly space heat is a variable
quantity. Hot tap water is a relatively constant quantity throughout the year. Heat losses are
also a relatively constant quantity.
2.     The heat production requirement has been modelled based on temperature records,
according to heat degree day concept, to which has been added hot tap water, steam and heat
losses as constant quantities. In the latter case it has been assumed that these quantities grow
throughout the planning horizon, according to the forecast change in drivers, notably the
population driver.
3.     The ‘must run’ cogeneration power and net available condensing power was determined
according to the ‘turbine’ curves of each thermal power plant. In the interconnected CES, the
available power has been determined separately for CHP2, CHP3, CHP4, Darkhan, Erdenet
CHPs and for the future CHP5.
4.      Cogeneration power is highest in the winter months, from November to February, and
lowest in the summer. In the summer period, the CHPs mainly produce inefficient condensing
power. It should be noted that the summer heat and power production reduces the average
annual efficiency of the CHPs. The efficiency in the winter months is closer to typical CHP
efficiencies observed in other countries.
D.          UB City Heat Capacity Expansion

5.     Two heat capacity expansion scenarios are envisaged. Scenario 1 is based on a CHP
expansion strategy using standard blocks of capacity of 168 GCal / hour. Scenario 2 is based on
a large Heat Only Boiler (HOB) strategy.
6.      The modelled heat capacity expansion is shown in Table 1:-
                                Table 1: Scenario 1 – Capacity Expansion Plan

               Forecast Deficit     New Capacity       Avail Capacity   New Deficit       Reserve Margin

                   Gcal/hr            Gcal/hr             Gcal/hr        Gcal/hr                %

     2013                      9                   -           1,585                  9               1%                -
     2014                    (44)                  -           1,585            (44)                 -3%                -
     2015                    (98)               300            1,885            202                 12%       +HOB300
     2016                (154)                  180            2,065            326                 19%    +PP#4 ext180
     2017                (212)                     -           2,065            268                 15%                 -
     2018                (271)                  336            2,401            545                 29%      +CHPX336
     2019                (333)                     -           2,401            483                 25%                 -
     2020                (397)                     -           2,401            419                 21%                 -
     2021                (463)                  168            2,569            521                 25%      +CHPX168
     2022                (531)                     -           2,569            453                 21%                 -
     2023                (601)                  168            2,737            551                 25%      +CHPX168

                                                         4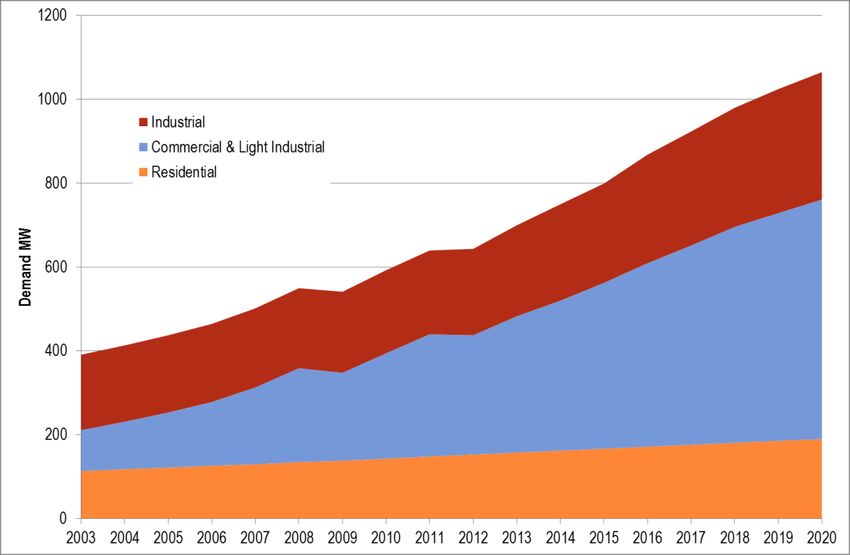
ADB Mongolia
Updating Energy Sector Development Plan (TA No. 7619-MON)                                         Executive Summary

               Forecast Deficit    New Capacity       Avail Capacity   New Deficit     Reserve Margin

                   Gcal/hr           Gcal/hr             Gcal/hr        Gcal/hr              %

     2024                  (674)                  -           2,737              478              21%                   -
     2025                  (749)               168            2,905              571              24%      +CHPX168
Source: Consultant’s analyses

7.      The modelled heat capacity expansion for Scenario 2 is shown in the following table:-
                               Table 2: Scenario 2 – Capacity Expansion Plan

                Forecast Deficit   New Capacity       Avail Capacity   New Deficit     Reserve Margin

                    Gcal/hr          Gcal/hr             Gcal/hr         Gcal/hr             %

     2013              9                -                1,585              9               1%                -
     2014            (44)               -                1,585            (44)              -3%               -
     2015            (98)              300               1,885            202              12%            +HOB300
     2016           (154)              180               2,065            326              19%          +PP#4 ext180
     2017           (212)               -                2,065            268              15%                -
     2018           (271)              300               2,365            509              27%            +HOB300
     2019           (333)               -                2,365            447              23%                -
     2020           (397)               -                2,365            383              19%                -
     2021           (463)              300               2,665            617              30%            +HOB300
     2022           (531)               -                2,665            549              26%                -
     2023           (601)               -                2,665            479              22%                -
     2024           (674)              300               2,965            706              31%            +HOB300
     2025           (749)               -                2,965            631              27%                -
Source: Consultant’s analyses

8.    As HOBs do not produce electrical power, Scenario 2 also requires conventional coal-fired
power plants to meet power demand.
E.          Heat Allocation to Heat Plants

9.     In the case of a heat production system, the CHPs and HOBs will produce the heat
demanded by the Districts they supply individually, according to the routing of their associated
heat transmission pipelines and location of heat exchangers.
10.    In UB, the heat production does not match neatly to Districts or sub-Districts. Over time
the share of total heat production of each CHP and HOB will change according to CHP retirements
and demographics, the latter measured in terms of new household connections. In addition
hydraulic considerations limit the areas that can be served by the heat transmission network.
11.    For the purpose of modelling heat capacity expansion it has been assumed that CHP2 will
be retired in 2017. It is assumed that a 300 GCal/h HOB (Amgalan) will be required and is
committed to supply heat demand in the eastern part of UB. These assumptions are common to
both scenarios.
12.    The following charts provide the heat production assumptions for Scenarios 1 and 2.                        The
detailed report includes the production assumptions by District.

                                                        5
ADB Mongolia
Updating Energy Sector Development Plan (TA No. 7619-MON)                   Executive Summary

               Figure 3: Scenario 1 – Modelled Heat Allocation for CHP Strategy

Source: Consultant’s analyses

               Figure 4: Scenario 2 – Modelled Heat Allocation for HOB Strategy

 Source: Consultant’s analyses

                                              6
ADB Mongolia
Updating Energy Sector Development Plan (TA No. 7619-MON) Executive Summary
F. Aimag Heat Forecast
13. Aimag heat forecasts were determined from data gathered from the licensed operators.
Table 5: Aimag Heating Systems – 2025
Aimag Heat Max Rated Downstream Capacity Annual Peak Coal Distance
Center Intensity Demand Capacity Loss Production utilization price to coal
MW/km Gcal/h Gcal/h % Gcal/h Gcal/a h/a MNT/ton km
Baruun-Urt 2.16 12.3 13.1 6% 0.8 39,740 3,037 14,400 35
Bayankhongor 1.82 13.0 13.8 6% 0.8 42,399 3,066 12,727 90
Bulgan 1.38 8.7 9.2 6% 0.6 30,484 3,304 26,500 758
Zuunmod 4.63 45.4 48.3 6% 2.9 100,155 2,072 36,194 45
Mandalgov 0.85 11.1 11.8 6% 0.7 23,780 2,010 34,847 300
Muren 3.36 31.5 33.5 6% 2.0 102,213 3,050 70,401 217
Ulgii 3.30 18.8 20.0 6% 1.2 41,865 2,096 19,500 140
Ondorhaan 2.33 19.3 20.5 6% 1.2 44,091 2,153 23,742 59
Sainshand 2.11 21.4 22.8 6% 1.4 42,504 1,866 16,430 220
Suhbaatar 1.47 28.9 30.7 6% 1.8 68,161 2,218 27,816 630
Ulaangom 5.06 48.8 51.9 6% 3.1 120,138 2,316 29,770 90
Uliastai 1.29 18.4 19.5 6% 1.2 47,586 2,435 24,400 140
Hovd 3.23 25.0 26.6 6% 1.6 51,314 1,929 12,910 196
Tsetserleg 2.86 13.0 13.9 6% 0.8 33,132 2,388 35,000 402
Choir 2.29 10.8 11.5 6% 0.7 20,567 1,786 13,960 35
Nailakh 16.58 125.6 133.6 6% 8.0 388,186 2,905 - -
Baganuur 10.06 188.9 201.0 6% 12.1 281,053 1,399 - -
Choibalsan 1.24 76.2 81.1 6% 4.9 169,314 2,089 - -
Dalanzadgad 0.36 7.3 7.8 6% 0.5 14,487 1,865 - -
Sum 785.0 835.1 50.1 1,790,958 442,197
Average 3.33 37.4 39.8 6% 2.4 85,284 2,280 21,057 176
Source: Consultant’s analyses
7ADB Mongolia
Updating Energy Sector Development Plan (TA No. 7619-MON) Executive Summary
III. ELECTRICITY FORECASTS
G. Demand Growth Scenarios
14. Electricity load forecasts are based on the following scenarios:-
1. A Low or ‘organic’ forecast – this forecast includes growth associated with existing
domestic, commercial and industrial consumers. The growth has been modelled
using an end-use model applied on individual Aimag and Energy Region basis.
2. A Medium or ‘bear’ industrial forecast – this forecast includes an industrial growth
forecast added to the organic forecast; it is assumed that industrial development
takes place over a 30 year period (from 2013) centred in three industrial zones –
Northern zone (Erdenet / Darkhan), Central zone (Choir / Sainshand) and
Southern zone (Dalanzadgad / TT / OT area).
3. A High or ‘bull’ industrial forecast – this forecast assumes that the industrial
development described above takes place over a 20 year period in accordance
with mineral and minerals processing expectations.
15. Load forecasts are presented as forecasts of consumer demand, not production of power
plants. Production forecasts have also been prepared incorporating forecasts of station losses
and T&D losses.
16. Total losses in the Mongolian power system are currently high, of the order of 35%. New
plant will result in a reduction of losses. Production forecasts in 2025 can be estimated by adding
20%.
17. Load forecasts are based on the assumption that demand is realized when industrial
facilities commence operation. This means that in the early years of the industrial zone growth
forecast, demand growth is low. It will take some three to four years from today to establish major
industrial facilities, e.g. an oil refinery. This explains why demand growth in the early years is
forecast to be low.
H. Whole of Mongolia Electricity Forecasts
18. The following forecast for whole of Mongolia and includes Oyu Tolgoi and Tavan Tolgoi as
loads as well as other known spot loads.
8ADB Mongolia
Updating Energy Sector Development Plan (TA No. 7619-MON) Executive Summary
Figure 6: Electricity Consumption Forecast (GWh)
Source: Consultant’s analyses
Figure 7: Electricity Demand Forecast (MW)
Source: Consultant’s analyses
9ADB Mongolia
Updating Energy Sector Development Plan (TA No. 7619-MON) Executive Summary
19. The compound annual growth rates are Low (9.3%), Medium (9.8%) and High (10.5%).
The growth rates are high by international standards, although consistent with forecasts in
developing countries that are pursuing an industrialization strategy and where the industrial base
is low. The growth rates can be seen to be impacted significantly by Oyu Tolgoi and Tavan Tolgoi
mines in 2016.
20. The average MW additions for the medium growth forecasts can be understood as two
150MW blocks of power every two years for the next 20 years. The growth can also be
understood in terms of kWh / capita growth.
Table 8: kWh / Capita Growth
kWh per Capita
Low Medium High
2012 1,739 1,739 1,739
2015 2,269 2,272 2,503
2020 3,914 4,232 5,015
2025 4,994 5,408 6,425
2030 6,172 6,692 7,959
Source: Consultant’s analyses
I. Electricity Forecasts of the Energy Systems
21. The demand forecasts for the Energy Systems follow. The details are provided in Volume
III.
Figure 9: CES Demand Forecast (MW)
Source: Consultant’s analyses
10ADB Mongolia
Updating Energy Sector Development Plan (TA No. 7619-MON) Executive Summary
Figure 10: South Gobi Demand Forecast (MW) (including OT, TT)
Source: Consultant’s analyses
Figure 11: AuES Demand Forecast (MW)
Source: Consultant’s analyses
11ADB Mongolia
Updating Energy Sector Development Plan (TA No. 7619-MON) Executive Summary
Figure 12: ERES Demand Forecast (MW)
Source: Consultant’s analyses
Figure 13: WRES Demand Forecast (MW)
Source: Consultant’s analyses
12ADB Mongolia
Updating Energy Sector Development Plan (TA No. 7619-MON) Executive Summary
IV. EXPANSION PLAN
J. Central Energy System (CES)
22. The Central Energy System is by far the largest Energy System and the most complex.
The TA Consultant has expended considerable effort to model the CES system accurately, on
year-to-year basis for the planning horizon 2013 to 2025. An expansion plan has been
formulated against a low or ‘organic’ electricity compound annual growth rate of 8%. The plan
includes committed plants, namely CHP5, expansion of CHP 4, refurbishment of CHP 3,
expansion of the Darkhan Thermal Power Plant and the 50 MW Newcom wind farm. It is
proposed that new capacity needs are met as follows – addition of 750 MW of new CHP power by
2025, addition of Sheuren Hydropower plant (design capacity of 390 MW, operated year round at
170MW on energy basis) commencing operation in 2021, coal-fired condensing power plants
starting at 300 MW in 2018 and increasing to 600 MW by 2025, and grid connected wind power
commencing at 50 MW in 2014 and increasing to 400 MW by 2025. The planting schedule
follows:-
Figure 14: CES Expansion Plan (Scenario 2c)
Existing New CHP Coal Hydro Wind Solar PV Import Total Total System
CHPs (firm) (full) New Capacity
(2013)
MW MW MW MW MW MW MW Build
MW MW
2013 775 0 0 0 0 0 119 0 893
2014 775 0 0 0 50 0 175 50 1,000
2015 775 0 0 0 50 0 175 50 1,000
2016 879 0 0 0 50 0 175 50 1,104
2017 879 0 0 0 50 0 175 50 1,104
2018 879 300 300 0 50 0 132 650 1,661
2019 860 300 450 0 50 0 0 800 1,660
2020 860 300 450 0 150 0 0 900 1,760
2021 860 450 450 170 150 0 0 1220 2,079
2022 860 450 450 170 200 0 0 1270 2,129
2023 860 600 450 170 200 0 0 1420 2,279
2024 860 600 600 170 200 0 0 1570 2,429
2025 860 750 600 170 400 0 0 1920 2,779
Source: Consultant’s analyses
23. It has been determined that for the period 2013 to 2025 the Central Energy System
requires a capital investment of $300 million for heat supply expansion in Ulaanbaatar, and
$4 billion for electricity supply expansion.
24. The annual capital investment profiles for this plan are shown in Figures 15 to 18. The
CES expansion plan is developed in Volume VI. The power expansion plan and grid integration
13ADB Mongolia
Updating Energy Sector Development Plan (TA No. 7619-MON) Executive Summary
plan is discussed in detail in Volume IX.
Figure 15: Cumulative Capex Requirement of CES Power Sector (Scenario Plan 2c)
Source: Consultant’s analyses
Figure 16: Annual Capex Requirement of CES Power Sector (Scenario Plan 2c)
Source: Consultant’s analyses
14ADB Mongolia
Updating Energy Sector Development Plan (TA No. 7619-MON) Executive Summary
Figure 17: Cumulative Capex Requirement of CES Heat Sector (Scenario Plan 2c)
Source: Consultant’s analyses
Figure 18: Annual Capex Requirement of CES Heat Sector (Scenario Plan 2c)
Source: Consultant’s analyses
25. To this electricity and heat generation expansion estimate must be added $52 million for
expansion and refurbishment of the heat transmission network in Ulaanbaatar.
15ADB Mongolia
Updating Energy Sector Development Plan (TA No. 7619-MON) Executive Summary
26. Expansion plans for medium and high growth scenarios have also been developed. For
these scenarios the demand in excess of the low growth demand is planned to be met with
coal-fired condensing power plants offering low cost and high reliability power to industrial centers.
K. Dalanzadgad / South Gobi Energy System
27. The development of the power plants intended to supply Tavan Tolgoi and Oyu Tolgoi is
understood to have stalled for various commercial reasons. In principle these plants are needed
to supply between 900 to 1200 MW within the next five years. Without such investment and
associated mining activity, the Government stands to lose a significant share of taxes and royalties
due to reduced turnover of the companies. This supply capacity will cover the two mines power
needs, as well as other small mines in the area. The plant potentially covers electricity needs
from Dalanzadgad to Nariin Sukhait. It will also allow for dismantling of the cross-border
transmission line entering Mongolia from Inner Mongolia and supplying Oyu Tolgoi. The
investment need for the period 2013 to 2025 is potentially as high as $2 billion to establish
up to 1200 MW of capacity in the South Gobi. The electricity expansion plan for the South
Gobi area is discussed in detail in Volume VIII.
28. The timing of investment is largely a commercial matter wherein the market for gold, silver
and metallurgical coal will determine the rate at which mine development proceeds and power
needs grow. Accordingly the Consultant is not able to accurately fix the disbursement of capital
profile for this power plant development. However a potential expansion plan has been
developed based on an understanding of the development schedules of Tavan Tolgoi and Oyu
Tolgoi.
Figure 19: South Gobi Expansion Plan
Asset Capacity Year
Tavan Tolgoi units 1 – 3 450MW 2018
Tavan Tolgoi unit no. 4 +150MW 2020
Tavan Tolgoi unit no. 5 +150MW 2022
Tavan Tolgoi - Oyu Tolgoi 220kV 25MW 2016
Tavan Tologi – Dalanzadgad – Nariin Suhkait
50-100MW 2018
110kV line
Source: Consultant’s analyses
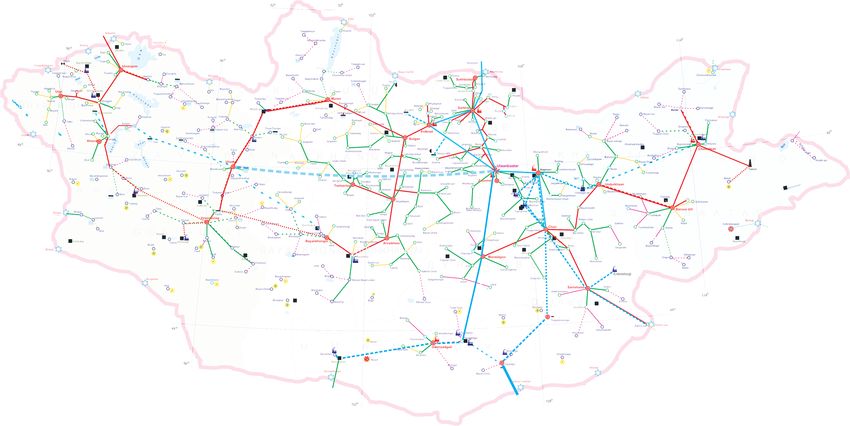
L. Eastern, Western & Altai-Uliastai Energy Systems
29. The development of the areas served by these Energy Systems is affected greatly by the
pace of mining development, and by the development of the livestock industry. The high growth
forecast would see the total load of these areas grow to around 450 MW by 2025.
30. The low end growth rate is substantially less than 450 MW, around 310 MW as shown in
Figure 20. Accordingly the actual economic development must be monitored closely. It is to be
expected that the developers of facilities that present as large spot loads, such as gasoline and
livestock processing factories, will understand the need to engage with the local electricity
distribution company or the MoE to plan for electricity needs. In this regard gathering market
intelligence on ongoing basis will identify the total pool of development activity, determine
expansion timing, and support expansion plan adjustment.
16ADB Mongolia
Updating Energy Sector Development Plan (TA No. 7619-MON) Executive Summary
Figure 20: Load Centres – 2025 (Low Growth)
Source: Consultant’s analyses
31. For AuES, ERES and WRES, the total investment need for the period 2013 to 2025
could be as high as $750 million, needed to establish 450 MW of new capacity in these
regional areas. The electricity expansion plan for the small energy systems is discussed in
detail in Volume VIII.
Figure 21: AuES Expansion Plan
Asset Capacity Year
Mogoin Gol Coal no. 1 25MW 2018
Mogoin Gol Coal no. 2 25MW 2018
Mogoin Gol Coal no. 3 (Muren) 25MW 2018
Mogoin Gol Coal no. 4 25MW 2022
Mogoin Gol Coal no. 5 25MW 2025
Mogoin Gol Coal no. 6 (Muren) 25MW 2025
220kV Interconnector – Mogoin Gol to
25MW 2018
Ulaangom
220kV Interconnector – Mogoin Gol to Erdenet
25MW 2025
via Muren
220kV line – Mogoin Gol to Altai via Uliastai 50MW 2023
17ADB Mongolia
Updating Energy Sector Development Plan (TA No. 7619-MON) Executive Summary
Asset Capacity Year
110kV line – Altai to Bayankhongor 25MW 2023
220kV line – Mogoin Gol to Bayankhongor 50MW 2025
Source: Consultant’s analyses
Figure 22: ERES Expansion Plan
Asset Capacity Year
Choibalsan CHP 3 x 10MW 2018
Baganuur / Chandgana no 1 25MW 2018
Baganuur / Chandgana no 2 25MW 2025
220kV Interconnector – Banganuur /
25MW 2018
Chandgana to Ondorhaan
110kV line – Ondorhaan to Baruun-Urt 25MW 2025
110kV line – Baruun-Urt to Choibalsan 25MW 2025
Source: Consultant’s analyses
Figure 23: WRES Expansion Plan
Asset Capacity Year
Power plant unit no. 1 25MW 2018
Power plant unit no. 2 25MW 2018
Power plant unit no. 3 25MW 2022
Power plant unit no. 4 25MW 2025
110kV line – Ulaangom to Ulgii 25MW 2018
110kV line – Ulgii to Khovd 25MW 2018
110kV line – Khovd to Ulaangom 25MW 2022
Source: Consultant’s analyses
M. Aimag Heating
32. The Aimag town centre heating systems, comprising HOB’s and piped heating networks
are in need of replacement. The Energy Masterplan update evaluated the heating systems of all
of the Aimag centres, and those of Nailakh, Baganuur and Bagakhangai. The technical life has
been exceeded in most all cases. An economic evaluation based on expected heat demand in
2025 indicates that 7 population centres have sufficient heat intensity to justify upgrade to a CHP
plant.
33. The investment need for the period 2013 to 2025 is estimated to be $258 million.
This level of investment is modest considering the economic benefits and could be expected to
attract development bank funding on social and environmental grounds.
18ADB Mongolia
Updating Energy Sector Development Plan (TA No. 7619-MON) Executive Summary
The Aimag heating expansion plan is discussed in detail in Volume VII.
N. Electricity Transmission & Distribution
34. The electricity transmission investment requirement relates to new capacity expansion and
replacement of aging assets. Capacity expansion has been modelled based on a low load
growth scenario, with demand utilization functioning as the driver of investment, i.e. as demand
utilization increases the trigger for investment is reached when reliability can no longer be met
under first contingency conditions. Transmission asset replacement needs were determined
based on the age profiles of transmission assets.
35. Distribution network replacement needs were set equal to anticipated expenditure to meet
electricity demand growth.
36. The investment need for the period 2013 to 2025 is estimated to be $2.8 billion.
The grid integration plan is discussed in Volume VIII. The power expansion plan and grid
integration plan is discussed in detail in Volume IX.
Figure 24: Cumulative Capex Requirement for T&D
Source: Consultant’s analyses
O. Integrated Energy System
37. The 2025 load forecasts for Mongolia’s Aimag centres, and associated load centres are
shown in Figure 20 above.
38. As these load centres are separated by large distances and the loads are not particularly
high in MW terms, from the perspective of adequacy and security of supply each load centre
should be supplied from a local 110kV or 220kV grid. Furthermore each load centre would be
linked by 220kV interconnectors capable of bi-directional delivery of power. It is not envisaged
that power transfers into the Central Energy System (CES) would be a feature of this
arrangement, since the security of the CES should not be compromised in any way by small
Energy Systems. A proposed arrangement is shown in Figure 25; power plants are shown sited
at local coal basins. A hydropower plant built on the Sheuren river system is included in the
future vision of the Integrated Electricity System, i.e. the CES expansion plan is included.
19ADB Mongolia
Updating Energy Sector Development Plan (TA No. 7619-MON) Executive Summary
Figure 25: Vision – Integrated Electricity System – 2025
Source: Consultant’s analyses
39. The power plants required to supply the load centres would be sized to supply the load
centre, in one case with a local 25% reserve margin, in other cases the reserve margin can be
provided by transfer from adjacent regions or potentially from Russia. The maximum size of
power plant units must be commensurate with the need to maintain adequate voltage stability
under load rejection or fault conditions, to perform power plant maintenance, to cope with forced
outages, and to provide power on emergency basis to an adjacent Energy System. In practice
these conditions could be met with units of minimum 25 MW each. Interconnection to the CES
and Russia would make the small Energy Systems ‘stiffer’ or more tolerant of loss of a 25 MW unit,
however the final arrangements and sizing would require detailed feasibility study. However, in
principle this overall supply strategy would guarantee a high level of security on the most
economical basis across widely dispersed load centres. The local 220kV grid arrangement
would provide for a high level of reliability, with an estimated annual loss of load probability due to
grid issues at less than 0.1%. Overall the loss of load probability would be no worse than
0.342%, a typical target for developing countries. Further detail of the grid expansion plan is
provided in Volume VIII.
20ADB Mongolia
Updating Energy Sector Development Plan (TA No. 7619-MON) Executive Summary
V. FINANCE CONSIDERATIONS
P. Tariff Insufficiency
40. It is an accepted fact around the world that private sector participation in energy markets
requires that tariffs support full cost recovery, allowing for reasonable returns on capital and
reasonable profits. In the coming decade Mongolia has a considerable need for capital
investment in infrastructure, not limited to energy infrastructure. Where tariffs involve subsidy (or
losses) it will hamper the involvement of the private sector with or without sovereign guarantees.
41. The Energy Master Plan defines the long-run cost of the power and heat supply sectors
based on a rigorous determination of investment needs to 2025. The plan provides a reference
against which long term tariff strategies can be developed within the context of an objective of
achieving full cost recovery. The rate of achievement of full cost recovery must be affordable for
consumers.
42. A financial viability check has been undertaken for the heat and power sectors by energy
region and sector. Financial analysis of the licensees was based on financial statements
(balance sheets, income and cash flow statements) obtained from the Electricity Regulatory
Commission. Financial statements of individual licensed operators serving Ulaanbaatar (UB)
and the Central Regional Energy System (CRES) were consolidated into single statements.
Analysis of other licensee performance was based on their original financial statements. The
result of the financial analysis shows that all companies except the Ulaanbaatar district heating
company have had poor profitability in recent years. Only four business sectors (UB and CRES
electricity and heat distribution and sales) had approved tariffs covering the full cost of sales, and
only two participants (UB DHN SOJSC, and CRES electricity distribution and sales segment) had
tariffs which were covering total operating costs.
43. Since the results of the financial analysis highlights that the main financial viability problem
of the licensees is their low or negative profitability, the Consultants carried out a retrospective
estimation of wholesale electricity and heat tariffs of major licensees, with a view to establish a
shadow tariff that would have recovered full costs and achieved reasonable profit levels in 2011
and 2012.
44. The tariff study has shown that for 2011 and 2012, the biggest change in tariffs would have
been caused by abolishing heat and power cross-subsidies at the CHP plants. This would have
had two effects:-
1. Tariffs for electricity produced at CHPs could have been reduced still allowing to achieve
2.5% net profit margin target; and
2. Tariffs for heat produced at CHPs would have significantly increased. This increase
would be especially dramatic for the older CHP plants and HOBs.
45. With exception of WRES and AuES, electricity transmission and distribution tariffs would
not have increased greatly.
46. It is clear that tariff rationalization will be necessary if private sector investment is to
increase, and if the necessary sustaining capital investment is to be made by the currently
licensed operators.
Q. Finance Sources
47. The sources of capital investment are likely to vary according to the nature of the
investment plan, e.g. it is likely that the Government will need to play a greater role in the financing
21ADB Mongolia
Updating Energy Sector Development Plan (TA No. 7619-MON) Executive Summary
of a hydropower plant, than in the case of a coal-fired plant which could be readily developed as a
merchant plant. One possible scenario for the sources of finance for the recommended CES
expansion plan follows:-
Figure 26: CES Expansion Plan by Finance Source (Scenario 2c)
Source: Consultant’s analyses
48. In this expansion plan view all coal-based condensing power plants, new HOBs and the
new CHP plant in Ulaanbaatar are assumed to be sponsored by the private sector, and all old CHP
plants, new wind power and hydropower by the public sector.
R. Forward Tariff Path
49. An analysis of the CES tariffs has been undertaken, allowing for the impact of future capital
investment. The existing tariffs allow include hardly any cost to capital, as the assets are largely
fully depreciated. Forward –looking tariffs must allow for capital investment.
50. Whilst annual capital disbursements will occur throughout the expansion period, in reality
most, if not all, projects will be financed by a mix of equity and debt, and the financial cost will be
distributed over several years beyond the planning horizon. Assuming the financing sources
shown in Figure 26, annual capital requirements are shown in Figure 27. The calculation of the
annualized capital costs assumes a harmonized capital structure of 60/40 (debt/equity) for all
projects, a real WACC of 4% for public projects and 6% for PPP and private projects, and 20 years
for the financial service period.
22ADB Mongolia
Updating Energy Sector Development Plan (TA No. 7619-MON) Executive Summary
Figure 27: Annualized Investment for CES Expansion Plan (Scenario 2c)
Source: Consultant’s analyses
51. The Full Cost Tariffs shown in Figure 28 and Figure 29 are based on the objective that the
full Capex and Opex expenditure is covered each year by the tariff. The tariffs are calculated
under assumption of achieving the net profit margin of 2.5% by 2020, and of 10% by 2025. The
calculations are based on the real prices and forex rates of 2012. As soon as construction of new
assets commences an immediate tariff rise is needed. If tariffs do not rise, the funding deficit
columns shown in these figures will develop over time. Obviously partial rises will lead to partial
deficits.
Figure 28: Full Cost-Based Electricity Tariff vs. Funding Deficit
Source: Consultant’s analyses
52. In 2012, residential electricity consumption was around 20% of the total electricity demand.
In the event that vulnerable consumer groups, or the residential sector as a whole, would need to
23ADB Mongolia
Updating Energy Sector Development Plan (TA No. 7619-MON) Executive Summary
be shielded from a pass through of the full cost tariffs, other sectors could absorb the increase.
This is fair and equitable because the demand is mainly driven by the commercial and industrial
sectors, their share in overall consumption is high, and tariffs would need only be increased by
another 10% (or even less in case of a bullish growth of industrial demand) in real terms by 2025
to cover the revenue loss incurred if residential tariffs were not increased.
53. The needed increase in heat tariffs is significantly greater than the increase needed for
electricity tariffs. The current tariffs average at around 8 $/ gigacalorie (GCal), the needed Full
Cost Tariff is about 19 $/ GCal.
Figure 29: Full Cost-Based Heat Tariff vs. Funding Deficit
Source: Consultant’s analyses
54. The share of residential consumption in heating demand is substantially higher than in case
of electricity demand. Therefore, the social consequences of tariff increases are more severe.
On the other hand, the stratum affected by such increase would not be the poorest, as people
living in the district heated apartment buildings of cities and Aimag centres represent on average
basis higher income groups than the population as a whole.
24ADB Mongolia
Updating Energy Sector Development Plan (TA No. 7619-MON) Executive Summary
VI. POLICY NOTE
S. Sector Background, Policies & Institutions
55. Coal dominant energy structure. Coal is a dominant source both in primary energy
(70% for Mongolia, 66% for the PRC and 22% for Japan) and secondary energy - electricity and
heat generation (over 95%). There is no natural gas available in Mongolia and all refined oil is
imported mainly from Russia with some minor import from the People’s Republic of China (PRC),
and South Korea.
56. High energy intensity. Energy intensity is more than two times higher than in
Organisation for Economic Co-operation and Development (OECD) countries, but comparable to
Kazakhstan, due to energy intensive industrial structure (mining industries) and cold climate
condition (long heating season).
57. Heat driven energy economy. The demand for heating is over two times that of
electricity due to climatic condition (8 months of heating season – winter temperatures fall in the
range below minus 20ºC to minus 40ºC). Because of this, combined heat and power (CHP) plant
is the most suitable, efficient, and economical choice to provide electricity and heat in Mongolia,
notably in Ulaanbaatar where the population density is high. In Ulaanbaatar and most Aimag
centres, it is economical to employ district heating systems to distribute heat. Heat access is a
matter of human survival for Mongolia’s citizens.
58. Aging heat and power plants. The existing facilities for providing heating and electricity
(power plants and transmission and distribution lines) are energy inefficient and vulnerable since
this infrastructure dates to the Soviet era. Two out of three CHP plants (number 2 and 3) in
Ulaanbaatar have been operating for over 40 years, and the largest CHP plant number 4 in
Ulaanbaatar has operated for more than 25 years.
59. Potential supply crisis. Electricity and heating demand has almost doubled in the last
decade due to mining developments and urbanization of Ulaanbaatar, and is expected to grow at
the rate of 8 to 10% by 2020. However, no major investments have been made to date to meet
the growing demand; as a result , which results in almost zero reserve margin of electricity and
heat supplies is almost zero. If no capacity additions are made, an electricity and heat supply crisis
may happen in the near future.
60. Rich renewable resources. Mongolia has a very high development potential in
renewable sources (solar, wind and hydro). A Mongolian private company successfully
commissioned a 50 megawatt wind farm in Salkhit in 2013, which is the first megawatt scale grid
connected wind farm in Mongolia. However, due to the intermittent nature of wind, development
of dispatchable backing sources (hydropower plant) is required to support further development.
61. Aging heating facilities in rural area. Coal based heating facilities in Aimag and Soum
centers are old and inefficient and mostly beyond refurbishment. Urgent replacement of heating
facilities is needed to provide reliable and efficient heating services to the citizens. Also, renewable
energy integration in coal fired based district heating system in rural remote areas can be
considered depending on the availability of land and high solar irradiation.
62. Central electricity system operation. In Mongolia combined heat and power plants
operate most efficiently in winter at the time of peak heat demand. It happens that in the central
electricity system the peak electricity demand also occurs in winter and is met by combined heat
and power plants. This means that in Mongolia a hydropower plant will not be required to supply
peak demand in winter, instead it is economical to use a hydropower plant, particularly in summer,
but also as a baseload power plant operating year round.
25ADB Mongolia
Updating Energy Sector Development Plan (TA No. 7619-MON) Executive Summary
63. Integrated energy system. The Government has a vision to interconnect the currently
independent energy grid systems operating in the country. Recently the Dalanzadgad area was
connected to Ulaanbaatar via Mandalgovi at 220kV, establishing integrated central and southern
grids. The eastern and western grids are currently supplied by Russia. Integration of these grids
to the central grid will increase energy independence and offers the potential to improve energy
security in an economical manner through cross-grid sharing of energy resources.
64. Large investment needs. It is estimated that $10.26 billion of investment is required by
2025 (or $840 million per year), comprising of which (i) $4.0 billion for CES electricity and
combined heat and power capacity addition, (ii) $0.35 billion for heat only boiler capacity addition
in Ulaanbaatar, (iii) $2.0 billion for electricity capacity addition in South Gobi Region, (iv) $0.75
billion for electricity capacity addition in the other grid systems, (v) $0.26 billion for heat capacity
rehabilitation and addition in Aimag centers, (vi) $1.7 billion for transmission, and (viii) $1.1 billion
for distribution.
Figure 30: Estimated Investment Requirements by 2025 by %
Source: Consultant’s analyses
65. Reasonable policies and institutional framework. Mongolia has transformed to the
modern energy market system (single buyer market model) unlike other central Asian counties.
There is also a provision of bilateral contract between power producers and end users. However,
this provision is limited to use for power supply project to the coal mines. Consumer tariffs are
regulated and have been adjusted recurrently to keep pace with domestic inflation. However,
tariffs remain below level of full cost recovery, which has led to state subsidies to sector operators
and cross-subsidies between electricity and heat consumer segments. National Renewable
Energy program (2005) set the renewable energy production target at 20 to 25 % in 2020, and
Renewable Energy Law (2007) sets reasonable feed-in-tariffs to accelerate investment. A
Renewable energy fund has been established under the law for supporting research and
development and rural electrification, but the fund needs to be populated.
26ADB Mongolia
Updating Energy Sector Development Plan (TA No. 7619-MON) Executive Summary
T. Policy Recommendations
66. Renew urgently the critical heat and power infrastructure. Investment for expansion
and modernization of the electricity facilities in central energy system and heating facilities in
Ulaanbaatar, where 90% of heat and electricity produced in Mongolia is the top priority to sustain
people’s life and economic activities, and to reduce urban air pollution in Ulaanbaatar. By
renewing the facilities, it will (i) bring supply side energy efficiency gain of up to 30% in combined
heat and power stations, and up to 50% efficiency gain in electrical transmission and distribution
networks, and (ii) guarantee to provide reliable heat and power services.
67. Aimag heat supplies. Renew the aged heating plants and district heating networks in the
Aimags, to provide adequate and reliable heating and hot tap water supplies. This will have the
effect of encouraging residents to refrain from moving to the larger population centres. New
heating systems will see improved efficiency, reduced air pollution and great improvements to the
current working conditions in many of the smaller heat plants.
68. Develop regulating power supply plant(s). Develop a large hydro power plant(s) on the
Sheuren river system as an effective measure to (i) provide low cost electricity in summer months,
to reduce import from Russia during the peak hours, and (ii) to support scaling up wind power
development. The link to Russia can be maintained to meet supply needs under emergency
conditions.
69. Introduce grid-connected wind farm capacity. The grid-connected wind farm capacity
defined by the planting schedule of Scenario 2c (refer Volume VI) will ensure that the renewable
energy contribution averages 20% on energy base during the years 2020 to 2025.
70. Develop a secure integrated energy system. Establish four energy grids linked by
transmission line interconnectors capable of providing back-up supply between adjacent grids
under conditions of first contingency supply loss. In the case of the central energy system,
long-term development will focus on securing the bulk power supplies to the industrial centres of
Darkhan, Erdenet, Ulaanbaatar, Tavan Tolgoi / Oyu Tolgoi and Sainshand Industrial Park.
Outside of the central energy system, the three smaller energy grids will each connect three Aimag
centres in a ring configuration, each ring supplied by local power generation capacity.
71. Remove subsidies and increase electricity and heating tariffs. A 70% tariff increase
for electricity and 130% for heat is advised to achieve full cost recovery, to maintain the financial
health of heat and power companies, to ensure investments in system expansion and attract
private sector participation. Subsidies provided to energy sector companies should be replaced
by channelling financial support directly to vulnerable consumer groups to mitigate the impacts of
tariff increases.
27ADB Mongolia
Updating Energy Sector Development Plan (TA No. 7619-MON) Executive Summary
VII. MONGOLIA - LONG LIST (2014 to 2025)
$
Sector Initiative By Comment
mill
5 - Year Plan: 2014 TO 2018
UB Heat
1 Construct new Ø1200 pipe line, main line No 10 from CHP-4 2014 5.8
Transmission
UB Heat
2 Construct new main pipe line for heating from CHP-4 to Yarmag direction 2015 7.7
Transmission
UB Heat
3 Improve reliability heat supply for Zaisan consumers 2014 3.9
Transmission
UB Heat
4 Extend capacity of 5а, 10в,10г,10д heat mail pipe lines from CHP-3 2015 23.1
Transmission
UB Heat
5 Extend capacity of district heating system in UB 2014 11.5
Transmission
CES / UB Heat &
6 Construct 300GCal/h HOB at Amgalan 2014 88.2
Power
CES / UB Heat &
7 Construct 300MWe CHP5 (Units 1 and 2) 2018 600.0
Power
CES / UB Heat &
8 Construct 300MW (2 X 150MW) coal plant (to East at Baganuur / Chandgana or south UB) 2018 483.0
Power
Replace power transformers - 110kV (24 off, 230MVA total) and 220kV (5 off, 438MVA
18 Power Transmission 2018 36.3
total)
21 Power Transmission Replace transmission lines - 110kV (970km total) 2018 60.0
24 Power Transmission Replace circuit breakers - 35kV (34 off) and 110kV (23 off) 2018 8.8
27 Power Transmission New Power Transformers - 220kV (320MVA total) 2018 16.2
28ADB Mongolia
Updating Energy Sector Development Plan (TA No. 7619-MON) Executive Summary
$
Sector Initiative By Comment
mill
28 Power Transmission New Transmission Lines - 220kV (460 km) 2018 90.0
29 Power Transmission New circuit breakers - 220kV (12 off) 2018 6.4
36 Power Transmission New Power Transformers - 110kV (420MVA total) 2018 25.9
37 Power Transmission New Transmission Lines - 110kV (1,092 km) 2018 87.3
38 Power Transmission New circuit breakers - 110kV (53 off) 2018 14.1
45 Power Transmission New Power Transformers - 35kV (626MVA total) 2018 45.0
46 Power Transmission New Transmission Lines - 35kV (1,676 km) 2018 46.9
47 Power Transmission New circuit breakers - 35kV (186 off) 2018 15.5
Extension & rehabilitation of heating supply in Uvs (CHP), Khuvsgul (CHP), Selenge
(Small Boilers), Bulgan (HOB), Bayankhongor (HOB), Uvurkhangai (Small Boilers),
Sukhbaatar (Small Boilers), Zavkhan (CHP), Gobi-Altai (CHP), Dornogobi (CHP),
54 Aimag Heat 2016 258.3
Dundgobi (Small Boilers), Khovd (CHP), Khentee (CHP), Tuv (CHP), Arkhangai
(HOB),Khovd (CHP), Dalanzadgad (Small Boilers), Gobi-Sumber (HOB), Nailakh (CHP),
Baganuur (CHP), Choibalsan(CHP), Bayan-Ulgii (CHP)
Altai Uliastai Energy
55 Mogoin Gol Coal no. 1 25MW unit 2018 50.0
Region Power
Altai Uliastai Energy
56 Mogoin Gol Coal no. 2 25MW unit 2018 50.0
Region Power
Altai Uliastai Energy
57 Mogoin Gol Coal no. 3 (Muren) 25MW unit 2018 50.0
Region Power
Altai Uliastai Energy
61 Region Power 220kV Interconnector – Mogoin Gol to Ulaangom; 25MW capacity 2018 Included in Item 28
Transmission
Eastern Energy
66 Choibalsan CHP 3 x 10MWe 2018 Included under Item 54
Region System Heat
29ADB Mongolia
Updating Energy Sector Development Plan (TA No. 7619-MON) Executive Summary
$
Sector Initiative By Comment
mill
& Power
Eastern Energy
67 Region System Baganuur / Chandgana no 1 25MW unit 2018 50.0
Power
Eastern Energy
Included in Item 28
69 Region System 220kV Interconnector – Banganuur / Chandgana to Ondorhaan; 25MW capacity, 580km 2018
($60m)
Transmission
Western Region
72 Energy System Power plant no. 1 25MW unit 2018 50.0
Power
Western Region
73 Energy System Power plant no. 2 25MW unit 2018 50.0
Power
Western Region
76 Energy System 110kV line – Ulaangom to Ulgii; 25MW capacity 2018 Included in Item 37
Transmission
Western Region
77 Energy System 110kV line – Ulgii to Khovd; 25MW capacity 2018 Included in Item 38
Transmission
South Gobi Energy
79 Tavan Tolgoi units 1 – 3 ( 3 x 150MW) 2018 900.0
System Power
South Gobi Energy
82 Tavan Tolgoi - Oyu Tolgoi 220kV; 25MW capacity 2016 50.0
System Power
South Gobi Energy
83 Tavan Tologi – Dalanzadgad – Nariin Suhkait 110kV line; 100MW capacity 2018 Included in Item 37
System Power
30ADB Mongolia
Updating Energy Sector Development Plan (TA No. 7619-MON) Executive Summary
$
Sector Initiative By Comment
mill
Transmission
84 Power Distribution New Line Transformers ; 6 - 10kV (940MVA total) 2018 73.0
85 Power Distribution New LV Lines ; 6 - 10kV (1,860km) 2018 32.0
90 Power Distribution New Low Voltage Systems (1,400km) 2018 14.3
5 - Year Plan: 2019 TO 2023
CES / UB Heat &
9 Construct coal plant (150MWe) 2019 282.0
Power
CES / UB Heat &
10 Construct CHP5 Unit 3 2021 300.0
Power
CES / UB Heat &
11 Construct CHP5 Unit 4 2023 284.0
Power
CES / UB Heat &
13 Construct CHP5 Unit 5 2025 284.0
Power
CES / UB Heat &
14 Construct 100MW windfarm (2 x 50MW) 2020 147.0
Power
CES / UB Heat &
15 Construct 390MW Sheuren HPP 2021 862.0
Power
CES / UB Heat &
16 Construct 50MW windfarm (1 x 50MW) 2022 74.0
Power
19 Power Transmission Replace power transformers - 110kV (4 off, 26MVA total) and 220kV (2 off, 250MVA total) 2023 14.1
22 Power Transmission Replace transmission lines - 110kV (515km total) 2023 32.0
25 Power Transmission Replace circuit breakers - 35kV (25 off) and 110kV (35 off) 2023 11.2
30 Power Transmission New Power Transformers - 220kV (270MVA total) 2023 13.5
31 Power Transmission New Transmission Lines - 220kV (382 km) 2023 74.4
31ADB Mongolia
Updating Energy Sector Development Plan (TA No. 7619-MON) Executive Summary
$
Sector Initiative By Comment
mill
32 Power Transmission New circuit breakers - 220kV (8 off) 2023 5.4
39 Power Transmission New Power Transformers - 110kV (348MVA total) 2023 21.5
40 Power Transmission New Transmission Lines - 110kV (910 km) 2023 72.8
41 Power Transmission New circuit breakers - 110kV (44 off) 2023 11.7
48 Power Transmission New Power Transformers - 35kV (521MVA total) 2023 37.5
49 Power Transmission New Transmission Lines - 35kV (1,396km) 2023 13.9
50 Power Transmission New circuit breakers - 35kV (155 off) 2023 12.9
Altai Uliastai Energy
58 Mogoin Gol Coal no. 4 25MW unit 2022 50.0
Region Power
Altai Uliastai Energy
63 Region Power 220kV line – Mogoin Gol to Altai via Uliastai; 50MW capacity 2023 Included in Item 31
Transmission
Altai Uliastai Energy
64 Region Power 110kV line – Altai to Bayankhongor; 25MW capacity 2023 Included in Item 40
Transmission
Western Region
74 Energy System Power plant no. 3 25MW unit 2022 50.0
Power
Western Region
78 Energy System 110kV line – Khovd to Ulaangom; 25MW capacity 2022 Included in Item 40
Transmission
South Gobi Energy
80 Tavan Tolgoi unit no. 4 (150MW) 2020 300.0
System Power
South Gobi Energy
81 Tavan Tolgoi unit no. 5 (150MW) 2022 300.0
System Power
32ADB Mongolia
Updating Energy Sector Development Plan (TA No. 7619-MON) Executive Summary
$
Sector Initiative By Comment
mill
86 Power Distribution New Line Transformers ; 6 - 10kV (780MVA total) 2023 61.0
87 Power Distribution New LV Lines ; 6 - 10kV (1,550km) 2023 26.0
91 Power Distribution New Low Voltage Systems (1,200km) 2023 11.9
5 - Year Plan: 2024 TO 2028
CES / UB Heat &
12 Construct coal plant (150MWe) 2024 282.0
Power
CES / UB Heat &
17 Construct 200MW wind farm (4 x 50MW) 2025 295.0
Power
Replace power transformers - 110kV (10 off, 135MVA total) and 220kV (4 off, 190MVA
20 Power Transmission 2025 17.8
total)
23 Power Transmission Replace transmission lines - 110kV (107km total) 2025 6.7
26 Power Transmission Replace circuit breakers - 35kV (10 off) and 110kV (79 off) 2025 21.4
33 Power Transmission New Power Transformers - 220kV (108MVA total) 2025 5.4
34 Power Transmission New Transmission Lines - 220kV (153 km) 2025 29.8
35 Power Transmission New circuit breakers - 220kV (3 off) 2025 2.1
42 Power Transmission New Power Transformers - 110kV (140MVA total) 2025 8.6
43 Power Transmission New Transmission Lines - 110kV (364 km) 2025 29.1
44 Power Transmission New circuit breakers - 110kV (18 off) 2025 4.7
51 Power Transmission New Power Transformers - 35kV (209MVA total) 2025 15.0
52 Power Transmission New Transmission Lines - 35kV (560 km) 2025 15.6
53 Power Transmission New circuit breakers - 35kV (62 off) 2025 5.2
Altai Uliastai Energy
59 Mogoin Gol Coal no. 5 25MW unit 2025 50.0
Region Power
Altai Uliastai Energy
60 Mogoin Gol Coal no. 6 (Muren) 25MW unit 2025 50.0
Region Power
33ADB Mongolia
Updating Energy Sector Development Plan (TA No. 7619-MON) Executive Summary
$
Sector Initiative By Comment
mill
Altai Uliastai Energy
62 Region Power 220kV Interconnector – Mogoin Gol to Erdenet via Muren; 25MW capacity 2025 Included in Item 34
Transmission
Altai Uliastai Energy
65 Region Power 220kV line – Mogoin Gol to Bayankhongor; 50MW capacity 2025 Included in Item 34
Transmission
Eastern Energy
68 Region System Baganuur / Chandgana no 2 25MW unit 2025 50.0
Power
Eastern Energy
70 Region System 110kV line – Ondorhaan to Baruun-Urt; 25MW capacity 2025 Included in Item 96
Transmission
Eastern Energy
71 Region System 110kV line – Baruun-Urt to Choibalsan; 25MW capacity 2025 Included in Item 96
Transmission
Western Region
75 Energy System Power plant no. 4 25MW unit 2025 50.0
Power
88 Power Distribution New Line Transformers ; 6 - 10kV (300MVA total) 2025 24.0
89 Power Distribution New LV Lines ; 6 - 10kV (600km) 2025 11.0
92 Power Distribution New Low Voltage Systems (500km) 2025 4.8
34You can also read