Extratropical Influence on ITCZ Shifts in Slab Ocean Simulations of Global Warming
←
→
Page content transcription
If your browser does not render page correctly, please read the page content below
720                                               JOURNAL OF CLIMATE                                                             VOLUME 25

                 Extratropical Influence on ITCZ Shifts in Slab Ocean Simulations
                                        of Global Warming

                                  DARGAN M. W. FRIERSON AND YEN-TING HWANG
                                             University of Washington, Seattle, Washington

                                  (Manuscript received 25 February 2011, in final form 9 July 2011)

                                                              ABSTRACT

               Recent studies with climate models have demonstrated the power of extratropical forcing in causing the
             intertropical convergence zone (ITCZ) to shift northward or southward, and paleoclimate data support the
             notion that there have been large shifts in the ITCZ over time. It is shown that similar notions apply to slab
             ocean simulations of global warming. Nine slab ocean model simulations from different modeling centers
             show a wide range of ITCZ shifts in response to doubling carbon dioxide concentrations, which are experi-
             enced in a rather zonally symmetric way in the tropics. Using an attribution strategy based on fundamental
             energetic constraints, it is shown that responses of clouds and ice in the extratropics explain much of the range
             of ITCZ responses. There are also some positive feedbacks within the tropics due to increasing water vapor
             content and high clouds in the new ITCZ location, which amplify the changes driven from the extratropics.
             This study shows the clear importance of simulating extratropical climate responses with fidelity, because in
             addition to their local importance, the impacts of these climate responses have a large nonlocal impact on
             rainfall in the tropics.

1. Introduction                                                        sensitive to the longitude at which the ice is prescribed.
                                                                       Yoshimori and Broccoli (2008) showed with single-forcing
   One of the most striking sets of papers in recent years
                                                                       experiments in a slab ocean model that a variety of forcing
is the work of John Chiang and other authors using
                                                                       agents can cause shifts in the ITCZ, including those with
paleoclimate data and climate models and showing that
                                                                       peaks in the extratropics, such as sulfate aerosols and black
the extratropics can be remarkably efficient in forcing
                                                                       carbon. Such extratropical–tropical connections occur in
shifts of the intertropical convergence zone (ITCZ).
                                                                       coupled models as well (Zhang and Delworth 2005;
While tropical–extratropical interactions are typically
                                                                       Broccoli et al. 2006; Cheng et al. 2007) and happen quickly
considered as the tropics driving the extratropics, with
                                                                       even in the coupled setting, within 2 yr (Chiang et al. 2008).
ENSO being the typical modern analogy (e.g., Horel and
                                                                       Observational evidence is also mounting to suggest that
Wallace 1981; Hoskins and Karoly 1981), these recent
                                                                       wide excursions of the ITCZ position have occurred in the
studies show the dramatic influence the extratropics can
                                                                       past (e.g., Lea et al. 2003; Koutavas and Lynch-Stieglitz
have on what is perhaps the most well-known climate
                                                                       2004; Pahnke et al. 2007; Sachs et al. 2009).
feature of the tropics. Chiang et al. (2003) showed that
                                                                          Two papers by Sarah Kang et al. (Kang et al. 2008,
high-latitude land ice, sea ice, or ocean heat transport
                                                                       2009) introduced a new theoretical framework for inter-
changes similar to that experienced in Last Glacial Max-
                                                                       preting the changes in ITCZ location as a response to
imum conditions result in a pronounced southward shift
                                                                       extratropical forcing alone. A key ingredient of these
of the ITCZ. Chiang and Bitz (2005) showed in particular
                                                                       theories, as in the work of Yoshimori and Broccoli (2008,
that a relatively small increase in Northern Hemisphere
                                                                       2009), is the cross-equatorial energy transport in the at-
(NH) sea ice coverage can result in a large southward shift
                                                                       mosphere, as this is strongly anticorrelated with any trop-
of the ITCZ, with the shifts occurring in all ocean basins
                                                                       ical precipitation shift. The anticorrelation occurs because
in a rather zonally symmetric way. The response is not
                                                                       in the deep tropics, the Hadley cell governs both the at-
                                                                       mospheric transport of energy (determined by the upper
  Corresponding author address: Dargan M. W. Frierson, University      branch of the cell, since the Hadley cell is a thermally direct
of Washington, Box 351640, Seattle, WA 98195-1640.                     circulation) and the transport of moisture (determined by
E-mail: dargan@atmos.washington.edu                                    the lower branch of the cell, since moisture is confined

DOI: 10.1175/JCLI-D-11-00116.1

Ó 2012 American Meteorological Society
15 JANUARY 2012 FRIERSON AND HWANG 721
to the lower atmosphere). As long as the mean cir- budget to perform an exact attribution of the cross-
culation dominates in the deep tropics, as it does in equatorial energy transports into different vertical flux
observations of the annual mean and seasonal cycle terms. In section 4 we perform an alternative attribution
(Trenberth and Stepaniak 2003), and the ratio of en- strategy using an energy balance model (EBM), which
ergy transport to moisture transport remains similar, accounts for the local temperature response to energy
such an anticorrelation is expected. fluxes in a simple way.
Simulations described in Kang et al. (2008, 2009) can
exhibit ITCZ shifts from the equator to as far as 208 off 2. Precipitation and atmospheric energy budget
the equator when forcing in the extratropics alone is ap- changes
plied. The essential argument in these studies is that an
a. Changes in precipitation in response to doubling
extratropical cooling results in increased baroclinic eddy
CO2
energy transport into the cooled region, which acts to
spread the cooling into lower latitudes. Eventually some of We utilize slab ocean simulations from the WCRP
this cooling makes its way into the subtropics, and there an CMIP3 multimodel dataset, the slab ocean control
anomalous Hadley circulation develops to assure that experiment, and the 2 3 CO2 equilibrium experiment.
upper tropospheric temperature gradients remain small We calculate climatologies using the last 20 yr of data
throughout the tropics. This anomalous Hadley circulation for each model. There are nine models that have ade-
transports energy into the cooled hemisphere, but since quate data in both of these experiments for our full
moisture is carried in the opposite direction as energy, analysis: Max Planck Institute (MPI) ECHAM5; Geo-
the ITCZ shifts away from the cooled hemisphere. physical Fluid Dynamics Laboratory Climate Model
The Kang et al. (2008) study also showed that the ITCZ version 2.0 (GFDL CM2.0); Model for Interdisciplinary
shift can be highly sensitive to parameters that affect the Research on Climate 3.2, medium-resolution version
modeled responses of clouds. For the same applied ex- [MIROC3.2(medres)] and high-resolution version
tratropical forcing, local or nonlocal cloud responses can [MIROC3.2(hires)]; Institute of Numerical Mathematics
either amplify or damp the applied forcing with different Coupled Model, version 3.0 (INM-CM3.0); Met Office
magnitudes. For instance, if low clouds increase in the Hadley Centre Global Environmental Model version 1
hemisphere, which experiences cooling, then this acts to (HadGEM1); Canadian Centre for Climate Modelling
effectively amplify the applied cooling by increasing the and Analysis (CCCma) Coupled General Circulation
shortwave radiation that is reflected away. Any variation Model, version 3 T63 resolution [CGCM3 (T63)] and T47
in the climate components that contributes to changes in resolution [CGCM3 (T47)]; and Meteorological Re-
the atmospheric energy budget—for example, changing search Institute Coupled General Circulation Model,
cloud properties, melting sea ice, or ocean heat uptake/ version 2 (MRI CGCM2).
heat transport changes—can affect energy transports in We first plot zonally averaged precipitation changes
the atmosphere and thus the ITCZ position. In Kang et al. with doubled CO2 in the nine models in Fig. 1a. Familiar
(2008), with identical extratropical forcing, changing model features are seen in the precipitation changes: moistening
parameters that affect clouds can change the ITCZ re- in the tropics and mid–high latitudes, and drying in the
sponse by a factor of 2. This result suggests that ITCZ subtropics (Held and Soden 2006). In the tropics however,
responses in GCMs may be strongly sensitive to the de- there are large differences among models in the zonally
tailed latitudinal structure of the climate components that averaged responses. For instance, near 108N, one model
contribute to changes in the atmospheric energy budget. simulates an increase in precipitation of 50 cm yr21,
In this paper we attempt to identify the causes of ITCZ while another model shows a decrease of more than
shifts within slab ocean simulations of global warming 10 cm yr21. Large precipitation disparities are not con-
from the World Climate Research Programme (WCRP) fined to the NH either. More than 10 cm yr21 differences
Coupled Model Intercomparison Project phase 3 (CMIP3) in simulated precipitation change are common between
multimodel dataset. While the lack of dynamical ocean 208S and the equator.
responses in these simulations imply that they are not There are two main reasons for the discrepancies in the
useful for forecasts of the future of the ITCZ, these projected change of tropical precipitation in these simula-
simulations provide a useful simplified context to study tions. First, the climatology in the control experiment is
the role of energetic source terms in shifting the ITCZ in different from model to model, with varying degrees of the
state-of-the-art atmospheric models. In section 2, we double ITCZ problem (Lin 2007), and the latitude of
calculate the changes in tropical precipitation and relate maximum zonal mean precipitation ranges from the equa-
this to the changes in cross-equatorial energy transports tor to 98N. The projected change of precipitation partly
within the models. In section 3, we utilize the energy depends on the precipitation in the control experiment, as722 JOURNAL OF CLIMATE VOLUME 25
FIG. 1. (a) Zonally averaged precipitation change (mm yr21) between the slab ocean control
experiment and the 2 3 CO2 equilibrium experiment. (b) Change in northward energy
transport in the atmosphere (PW). In both subplots, models are colored according to their
cross-equatorial energy transport in (b), with blue representing a more southward transport
and red representing a more northward transport.
already wet regions tend to moisten the most (Held and atmospheric energy budget is in steady state, so the
Soden 2006). Models that have the ITCZ farther north in equation for the change in energy budget is
the control experiment tend to have more increase in
precipitation farther north. The second main reason for $ FA 5 QS 2 QL 2 QO , (1)
discrepancies in tropical precipitation, which explains
more variance than mean state differences, is the north– where FA is the vertically integrated atmospheric moist
south shifts in the ITCZ. As shown in Fig. 1a, models static energy transport, QS is the net shortwave radiation
that increase their precipitation more on the northern at top-of-atmosphere (TOA), QL is the outgoing long-
side of the ITCZ also exhibit more of a decrease on the wave radiation (OLR), and QO is the net downward
southern side, and vice versa. The shift also extends to surface flux. Each variable represents the change be-
the subtropics, where models experiencing a northward tween doubled CO2 and the control climatology. Me-
ITCZ shift exhibit a larger drying trend in the Southern ridional energy transports are calculated in the GCMs
Hemisphere (SH) subtropics. In this paper, we will focus by integrating Eq. (1) as follows:
on understanding the discrepancies related to north–
south shifts of tropical precipitation. ðf ð 2p
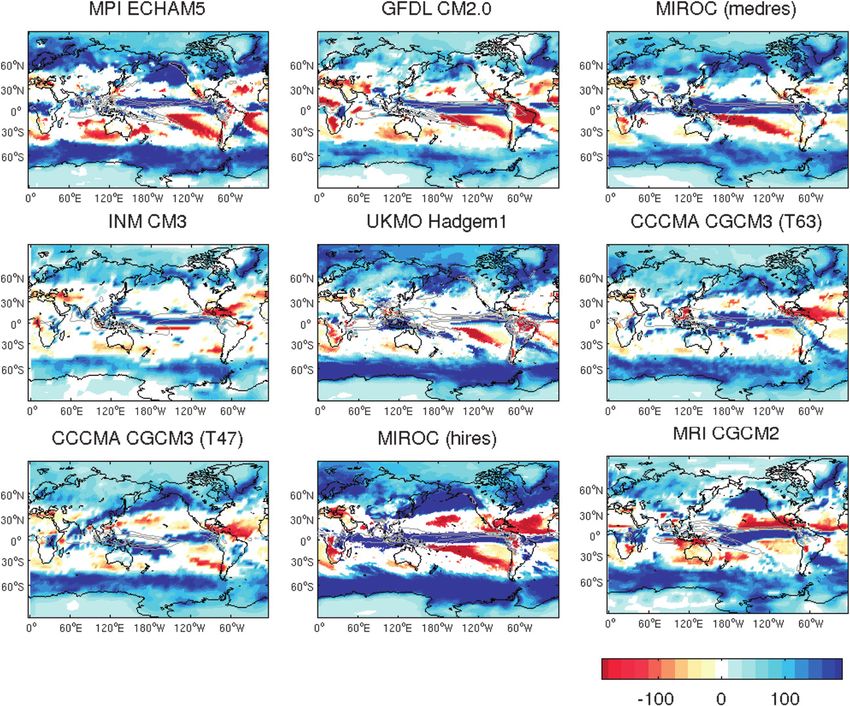
To demonstrate how zonally uniform the changes are, FAf 5 (QS 2 QL 2 QO )a2 cosf dl df, (2)
we also plot the change in precipitation as a function of 2p/2 0
latitude and longitude in Fig. 2. In most models, the shift
occurs across both land and ocean. Drying in the sub- where FA is the meridional component of the energy
tropics appears across all longitudes, with MPI, GFDL, flux, a is the radius of the earth, f is latitude, and l is
and MIROC(medres) experiencing more drying in the longitude. The primary feature of Fig. 1b is an increase
SH subtropics, and MRI and CGCM3 (T63) experiencing in poleward energy transport of varying magnitude in
more drying in the NH subtropics. both hemispheres, shown in Hwang et al. (2011) and
explained by the increased atmospheric moisture con-
b. Changes in energy transport
tent in Hwang and Frierson (2010). Model-to-model
Next we calculate the change in atmospheric energy differences are explained in Hwang and Frierson (2010)
transport, which is plotted in Fig. 1b. We assume the by differences in the climate components that contribute15 JANUARY 2012 FRIERSON AND HWANG 723
FIG. 2. Precipitation change (mm yr21, colors) and precipitation in the control experiment (contours, 1000, 1500, 2500, and
4000 mm yr21).
to changes in the atmospheric energy budget in each energy transport at the equator are the models that ex-
model, with cloud effects causing the largest spread. hibit a more northward-shifting ITCZ (blue colors), and
The change of cross-equatorial atmospheric energy models that moisten the southern side of the tropics
transport varies significantly from model to model, with have a northward transport of energy at the equator (red
four models having a northward transport at the equator colors). To quantify the ITCZ shift, we calculate the
and five models having a southward transport. Most of shift of the precipitation center, which is defined as the
the profiles are essentially linear in the deep tropics, so latitude that is the centroid of the area-integrated pre-
the cross-equatorial value is typical of any kind of sym- cipitation from 158S to 158N. We plot this precipitation
metric latitudinal average across the equator (e.g., 58N– shift index versus the cross-equatorial energy transport
58S or 108N–108S). in Fig. 3a; the correlation coefficient is 0.93. The intercept
of the best-fit line is also near zero, meaning models with
c. Changes in precipitation and cross-equatorial
no ITCZ shift also have near-zero cross-equatorial energy
fluxes
transport change. This result indicates that changes in the
Models are colored in Fig. 1a in order of their cross- mean meridional circulation (the Hadley circulation)
equatorial atmospheric energy transport change from are governing the dynamics in the deep tropics. Models
Fig. 1b. It is clear that the models with more southward that transport energy northward across the equator by724 JOURNAL OF CLIMATE VOLUME 25
d. Changes in precipitation and hemispheric
temperature changes
Another quantity that one might expect to be cor-
related with shifts in tropical precipitation is the in-
terhemispheric difference in surface warming (e.g.,
Broccoli et al. 2006; Yoshimori and Broccoli 2008;
although, the latter study found the cross-equatorial
energy flux to be more highly correlated with the tropical
precipitation shifts across a range of simulations). We
correlate the same precipitation shift index described
above with the 2-m air temperature change averaged in
the NH minus the SH in Fig. 3b. The correlation re-
mains relatively high (0.83), indicating that the models
that show more of a northward shift of tropical pre-
cipitation are indeed those that warm the NH more.
However, all models show more warming in the NH
than the SH, while four models show a southward shift
of tropical precipitation. The y intercept of the best-fit
line is thus away from zero, and the temperature change
is thus a poorer predictor of the tropical precipitation
shift as compared with the energy flux. We return to the
role of interhemispheric temperature differences later in
the paper.
3. Vertical energy fluxes and the cross-equatorial
energy transport
Having shown in section 2 that tropical precipita-
tion shifts are highly correlated with cross-equatorial
energy transports, we next perform attribution studies
to explain the cross-equatorial energy transport in
each model. In this section we use the atmospheric
energy budget to divide the cross-equatorial flux into
contributions from vertical energy fluxes at each lati-
tude. This technique is exact and has been used in
several other studies (e.g., Wu et al. 2010; Donohoe and
Battisti 2012; Zelinka and Hartmann 2012). The pri-
mary disadvantage of this technique, explained in
FIG. 3. (a) Shift of the precipitation center (degree, see text for detail in section 3c, is the fact that in response to
definition) vs change in atmospheric energy transport at the a given vertical energy flux—for example, a shortwave
equator [FA(f 5 0)]. (b) Shift in precipitation center (degree) vs 2- heating in the NH due to a reduction in cloud cover—the
m air temperature change averaged in the NH minus SH. Models
are colored as in Fig. 1.
atmosphere responds both by fluxing energy into the
SH and by increasing temperature and OLR locally
within the NH. In the technique in this section, these
the upper branch of the Hadley circulation also transport contributions are counted as separate terms—that is,
moisture southward across the equator, resulting in a the shortwave cloud warming causing a southward
southward ITCZ shift. While this result is not surprising cross-equatorial flux and the OLR increase causing
given the importance of the mean Hadley circulation in a northward flux. With this difficulty in mind, our
shaping the ITCZ in the current climate, it does imply technique in section 4 introduces an EBM that allows
that if one can explain the cross-equatorial energy trans- for the calculation of the partition into energy fluxed
port, then such a theory explains the zonally averaged away versus radiated to space locally due to each
precipitation shifts as well. term.15 JANUARY 2012 FRIERSON AND HWANG 725
FIG. 4. (a) Total change of the atmospheric energy budget (QA) in W m22. (b) Antisymmetric
component of the change of the atmospheric energy budget f½[QA(2f) 2 QA(f)]g in W m22.
Models are colored as in Fig. 1.
a. The effects of vertical energy fluxes on the latitude bands are most important in creating a cross-
cross-equatorial energy transport equatorial transport. When this diagnostic is positive at
a particular latitude, this means that the SH receives
From Eq. (2), the change of poleward energy transport
more energy input than the NH at this latitude, and the
FA can be decomposed into individual vertical energy flux
atmosphere thus requires a northward cross-equatorial
terms into the atmosphere. We plot the total energy input
transport to preserve the energy balance. In Fig. 4b, one
into the atmosphere as QA 5 QS 2 QL 2 QO in Fig. 4a,
can see that different latitude bands are important in
with the x axis scaled as sin(f) because area integration
different models in creating a cross-equatorial energy
must be performed in the meridional transport calculation.
transport. There is uniformly large intermodel variance
The change of cross-equatorial energy transport FA(f 5
at all latitudes poleward of 508, with differences of 5–
0) can be expressed as either the integral of QA from 908S
10 W m22, typical for models at these latitudes. It is also
to the equator or from the equator to 908N as follows:
notable that models that experience a more southward
ð0 ð 2p cross-equatorial transport (blue) are identifiable as more
FA (f 5 0) 5 QA a2 cosf dl df (3) negative in Fig. 4b in the extratropics, while models that
2p/2 0
experience a more northward transport (red) have pri-
ð p/2 ð 2p marily positive values. Latitudes between 308 and 458
52 QA a2 cosf dl df, (4) experience comparatively smaller variance in Fig. 4b,
0 0
with most models near zero. Two models have a large
defining the net vertical heat input into the atmosphere difference in the subtropics between 158 and 308, the
as QA 5 QS 2 QL 2 QO. As CO2 is doubled, models that MIROC(hires) and MPI ECHAM5, which appears to
have more anomalous heating in the NH and cooling in explain some of the change in cross-equatorial energy
the SH require an increase in southward cross-equatorial transport in these models. Only the MRI model has
transport to be in energy balance. One model, MRI, has a large positive value in the deep tropics.
a large heating in the deep tropics that requires a large
b. Latitudinal distribution of individual energy source
northward transport to balance. But in many models, the
terms
energetic differences come from higher latitudes. To ex-
amine the latitudes that cause the intermodel spread in Next we examine individual energy source terms and
the change of cross-equatorial energy transport in more their hemispheric asymmetry to perform a partitioning
detail, we write (3) and (4) as of the cross-equatorial energy transport change in each
ð ð 2p model using Eq. (5). We separate QA in Eq. (5) into
1 0 changes due to individual energy source terms. The
FA (f 5 0) 5 Q a2 cosf dl df
2 2p/2 0 A energy source terms we discuss in this paper refer to the
ð p/2 ð 2p changes of the atmospheric energy budget due to var-
2
2 QA a cosf dl df . (5) iations of individual climate components, such as clouds,
0 0
surface albedo, and water vapor. The global mean of
these energy source terms, if divided by global mean
Motivated by this identity, we plot the integrand temperature change, are often referred to as climate
(1/2)[QA(2f) 2 QA(f)] in Fig. 4b to identify which feedbacks in climate sensitivity studies.726 JOURNAL OF CLIMATE VOLUME 25 The change in net solar radiation QS is partitioned then acts as a positive feedback that drives a larger into three energy source terms: surface albedo (I ), cloud shift of the ITCZ in the same direction. Such a posi- shortwave effects (CS), and noncloud scattering and tive feedback to the ITCZ shifts from WV has been absorption (NS), using the approximate partial radiative previously identified in the study of Yoshimori and perturbation (APRP) method (Taylor et al. 2007) to Broccoli (2009). separate these terms accurately. The sum of the three There are two other feedbacks that result from shifts terms is the same as the difference in net incoming short- in the ITCZ, which we discuss next: when the ITCZ wave radiation between the 2 3 CO2 and the control shifts from north to south, in addition to humidifica- experiment. OLR changes (QL) are partitioned into tion of the south, there are also increases in the cloud those due to water vapor (WV), temperature (T) (in- greenhouse effect and increases in reflected shortwave cluding both Planck and lapse rate effects), and cloud (SW) radiation in the south (with opposite changes in longwave effects (CL), using the radiative kernel method the north), both resulting from the increased high cloud (Soden et al. 2008), with kernels constructed from the cover where the ITCZ has shifted. The CL also acts as GFDL model. There is a nonnegligible residual term a positive feedback for shifts. Figure 5f shows the (RL) when comparing the sum of all of the longwave hemispheric asymmetry of the cloud LW effect. Models (LW) terms with the difference in net longwave radiation show increasing high cloud coverage at the new ITCZ between the 2 3 CO2 and the control experiments, as we location, which results in decreasing OLR and a net discuss later in this section. Further experiments with heating. This also leads to a cross-equatorial energy each model would be desirable to verify the accuracy of transport in the opposite direction and shifts the ITCZ the radiative partitioning methods, but they are beyond further. The increasing cloud LW effect extends into the scope of this study. The zonal mean of each energy the subtropics in many cases. source term is plotted in Figs. 5–7. Similar to Fig. 4, the A negative feedback occurs in the deep tropics for the antisymmetric component of each term is plotted next CS (Fig. 5g). For instance, in the models that show to its latitudinal distribution. Note that if models are a northward shift (blue models), there is more negative stacked red to blue from top to bottom in the anti- cloud SW effect in the NH tropics because of increases symmetric component for a particular term, then that in cloud fraction. All of the models beside MRI (dark indicates a component that explains some of the model- red) show a strong anticorrelation between cloud LW to-model spread in the changes of cross-equatorial energy and cloud SW effects in the tropics. Therefore, summing transport. The implied cross-equator energy transport the two (Fig. 5h) eliminates much of the positive/negative change calculated by integrating each energy source term feedback of these terms. [following Eq. (5)] after removing its global mean is Outside of the tropics, it is clear that clouds are a plotted in Fig. 8. Each dot is the result of one model. primary factor influencing the cross-equatorial trans- Positive values imply this particular energy source term port. The cloud SW effect in particular dominates the requires an increase in northward energy transport at hemispheric asymmetry in mid–high latitudes. In the the equator and thus may shift the ITCZ southward. extratropics, models that experience more cooling from Again in Fig. 8, if models are stacked red to blue, then cloud SW effects in the SH compared with the NH tend it indicates a positive contribution to the model-to- to create a southward cross-equator transport and a model spread. northward ITCZ shift (blue models), and vice versa. The WV effect is greatest in the tropics and generally The largest model-to-model spread comes from differ- declines from the equator to the poles (Fig. 5a). This ences in the 508–708 latitude band, which contributes is because there are only small changes in relative approximately twice as much variance as other latitude humidity in these simulations, which implies a prefer- bands; however, essentially all latitudes contribute to ential increase in the specific humidity of the tropics. some cross-equatorial transport. As shown in CL 1 CS However, the constant relative humidity framework in Fig. 8, clouds contribute most of the spread in the is not sufficient when one wants to understand the hemi- change of cross-equator transport, even after combing spheric asymmetry of the water vapor effect. Figure 5e their SW and LW effects. shows that models with a more northward shift of the Changes in SW radiation associated with surface ITCZ (blue models) are also the models experiencing albedo also explain a large amount of the model-to- more positive water vapor effect in the NH tropics. This model spread (Figs. 6a,e; I in Fig. 8). The hemispheric feature should be considered as a response to the ITCZ asymmetry plot (Fig. 6e) demonstrates the differences shift, with higher moisture content and a larger water in changes in snow and sea ice in the two hemispheres. vapor greenhouse effect in the hemisphere into which the In midlatitudes, there is more snowpack melted in the NH, ITCZ shifts. The heating from the WV greenhouse effect which results in a negative value for the SH-minus-NH
15 JANUARY 2012                               FRIERSON AND HWANG                                                        727

                    FIG. 5. Energy source terms in the atmosphere (W m22) due to (a) the water vapor LW effect,
                  (b) the cloud LW effect, (c) the cloud SW effect, and (d) the total cloud (LW 1 SW) effect. (e)–
                  (h) Antisymmetric component of the energy source term, (½)[Q(2f) 2 Q(f)], where Q is the
                  change in atmospheric energy budget due to the terms in (a)–(d), respectively. The models are
                  colored as in Fig. 1.

asymmetry index. In high latitudes, however, all of                budget. Much of the nonzero parts of this term are near
the slab models predict more sea ice melting near                  the sea ice edge, where Q fluxes are revealed when sea
Antarctica than in the Arctic (this is very different from         ice melts (Fig. 6b), so Q fluxes are not necessarily con-
the results from coupled GCMs). Models experiencing                stant in the simulations.
more heating from melting sea ice in the SH (red models)             The noncloud SW term (NS) calculated by the APRP
tend to be the models that simulate northward cross-               method describes the changes of SW fluxes at the TOA
equator energy transport and a southward shift in the              that are not associated with clouds or surface albedo.
ITCZ (I in Fig. 8).                                                This includes absorption changes from increasing water
  Changes in upward surface flux (O) are nonnegligible             vapor and CO2, which provide an approximately glob-
despite that these are equilibrium simulations with slab           ally uniform background positive value. The APRP
ocean models (Figs. 6b,f; O in Fig. 8), where the ocean            method is less accurate in the high latitudes, where the
should not contribute to changes in atmospheric energy             surface albedo changes are particularly large.
728 JOURNAL OF CLIMATE VOLUME 25
FIG. 6. Energy source terms in the atmosphere (W m22) due to (a) the surface albedo effect,
(b) the change in upward surface flux, (c) the noncloud SW effect, and (d) the LW residual term
of the kernel method. (e)–(h) As in (e)–(h) in Fig. 5. The models are colored as in Fig. 1.
The LW residual term (RL) is the difference between term is that it is anticorrelated with the LW cloud and WV
the actual change in LW flux at TOA and the sum of the effects in the models, likely because of the nonlinear in-
water vapor effect, temperature effect, and cloud LW teractions between these two effects. The LW residual thus
effect, as shown in Fig. 6d. This term includes the radiative causes a negative feedback to the cross-equatorial flux,
forcing from doubling CO2, so all models are positive and implying that some of the positive feedbacks of these terms
have global averages from 2.5 to 5 W m22. Also included are likely slightly overestimated.
in this term are errors in the kernel method, which are
c. The role of local temperature/OLR increases
likely nonnegligible, since only the kernel calculated from
the GFDL model control climatology is used (radiative In this section we have performed an exact parti-
kernels cannot be constructed for each individual model tioning of the change of cross-equatorial transport into
with the limited data stored in the CMIP3 archive). Ad- different energy source terms, all except for the local
ditionally, nonlinear effects are included in this term, since temperature effect. Next we give a caveat to this method
the kernel method assumes the energy source terms are of partitioning, mentioned briefly in the introduction
linear. A particularly important feature of the LW residual through section 3, involving compensating local OLR15 JANUARY 2012 FRIERSON AND HWANG 729
FIG. 7. Energy source terms into the atmosphere (W m22) due to (a) the temperature effect, (b)
the sum of the water vapor and temperature effects, and (c) the total change in atmospheric energy
budget minus the water vapor and temperature effects. (d)–(f) Antisymmetric component of the
energy source term, (½)[Q(2f) 2 Q(f)], where Q is the change of the atmospheric energy budget
associated with the terms in (a)–(c), respectively. Models are colored as in Fig. 1.
changes because of the temperature response to energy In Figs. 7a–c, we plot the temperature effect, the sum
source terms. By performing a direct integration to get of temperature and water vapor effects, and the sum of
the implied cross-equator transport of each term, we all of the other terms; Figs. 7d–f show the antisymmetric
implicitly assume that the heating at a particular latitude parts of these terms. We consider the sum of temperature
would be felt uniformly at all latitudes through energy and water vapor effects since warming is typically also
transports. However, in reality, heating at a particular associated with humidification. Figure 7e shows that the
latitude is also associated with a local warming and hu- sum of water vapor and temperature effects in the ex-
midification, and increases in the OLR associated with tratropics is anticorrelated with the sum of all of the
the temperature increase. In other words, some of the other terms (Fig. 7f), and with the ITCZ shift in general.
heating will be balanced by increasing OLR and will not Models that have less anomalous heating in the SH ex-
result in a change in transport. tratropics (blue models) tend to show less increase in730 JOURNAL OF CLIMATE VOLUME 25
The local warming response to the energy source
terms is sufficient to offset a large amount of the energy
input. The partition we performed in the last section
may overestimate the importance of individual energy
source terms, particularly in high latitudes, because much
of a given heating will be balanced by local temperature
responses. This implies that for the most accurate at-
tribution, one must additionally take into account the
change in longwave flux that would occur if each energy
source term were removed. We attempt to perform
such an attribution with an EBM in the next section.
4. Prediction and attribution of ITCZ shifts
with an EBM
To consider the increasing noncloud OLR as a re-
sponse to other energy sources, we introduce an EBM to
predict the change in meridional energy transport due to
FIG. 8. Attribution of the cross-equatorial energy flux (PW) each energy source term (Hwang and Frierson 2010).
analyzed by the exact integration method to atmospheric energy The EBM responds to a localized heating at a particular
sources from CL, CS, the total cloud effect (CL 1 CS), the water latitude with both a local increase in OLR and increased
vapor plus temperature LW effect (WV 1 T ), I, O, RL, and NS.
diffusive transport away, with the partition between
Models are colored as in Fig. 1. Symbol X denotes the multimodel
mean in each column. the two determined by a diffusivity constant. There-
fore, it provides a better estimate of how the energy
transport changes because of a particular energy source
term. A downside to the EBM attribution method, of
OLR there (positive value in Fig. 7e). In the tropics, the course, is that it calculates an approximation to the
positive water vapor feedback discussed in the last sec- cross-equatorial energy flux rather than using the exact
tion dominates. Models with a southward ITCZ shift values, as in the method in section 3.
(red models) tend to show more enhanced greenhouse The EBM uses a latitudinally constant diffusivity for
effect and less OLR increase from WV and temperature moist static energy that is the same value for all models
in the SH tropics (positive value in Fig. 7e). In WV 1 T and in both the control and the 2 3 CO2 experiments,
in Fig. 8, it is shown that the anticorrelation in the ex- and is tuned to fit the multimodel mean control climate.
tratropics dominates over the positive feedback in the Longwave radiation is parameterized as a linear func-
tropics and results in a negative feedback on the ITCZ tion of temperature using a regression from the control
shifts (blue dots over red dots). experiment, and 80% surface relative humidity is as-
In addition, there is a clear tendency for WV 1 T in sumed. The EBM is run with shortwave radiation, total
Fig. 8 to be positive for all models, meaning it causes surface flux, and longwave cloud radiative forcing as
a northward cross-equatorial energy transport and a south- inputs to generate a mean climatology. The model is
ward shift of the ITCZ. This reflects the fact that noncloud then run under warmed conditions, with shortwave
OLR increases are larger in the NH than in the SH for radiation changes, longwave cloud radiative forcing
all models. This is presumably because the NH is easier changes, and surface flux changes. The model predicts
to warm and more difficult to humidify than the SH. The energy transport, temperature, and clear-sky longwave
energetic partitioning suggests an interesting mechanism radiation in both experiments.
for ITCZ shifts, proposed first by Zelinka and Hartmann Most of the energy source terms we include in the
(2012): despite the tendency of the NH to warm more EBM are the same as the integration method used in
quickly, the increased OLR resulting from the warming the last section. The only two differences are 1) we use
leads to an ITCZ shift away from the warmed hemi- the change in LW cloud radiative forcing instead of the
sphere, when this temperature effect is considered on radiative kernel method to estimate the LW cloud radi-
its own. The general anticorrelation of this component ative effect, to be consistent with the outgoing LW radi-
with the total cross-equatorial transport change shows, ation in the control experiment used to tune the EBM;
however, that models that tend to warm the NH more do and 2) we do not prescribe the water vapor and temper-
indeed have more of a northward shift of the ITCZ. ature effects but let the EBM determine the changes in15 JANUARY 2012 FRIERSON AND HWANG 731
FIG. 9. EBM-predicted change in cross-equator flux [FP(f 5 0)] FIG. 10. As in Fig. 8, but calculated from the EBM method.
in PW vs actual change in cross-equator flux [FA(f 5 0)]. Models
are colored as in Fig. 1.
Having shown that the energetic framework does a
LW associated with these two effects. The predictions good job at separating the model-to-model differences
of cross-equatorial energy transport predicted by the in ITCZ shifts, we run single-forcing experiments with
EBM versus the actual changes in the models are plotted the EBM to attribute the ITCZ shifts to individual en-
in Fig. 9. The EBM does an excellent job of separating the ergy source terms. The result is plotted in Fig. 10. Clouds
models, with correlation coefficient R 5 0.91. Combined (plotted as the sum of SW and LW effects because of
with the result from Fig. 3 that the ITCZ shift is well the cancellation of these effects in the tropics) still
correlated with the cross-equatorial MSE transport, this contribute the large majority of the spread. In the
implies that the EBM can also explain the range of multimodel mean, clouds cause no systematic effect;
ITCZ shifts in the simulations. The correlation be- however, they contribute a very large fraction of
tween ITCZ shift and EBM predicted cross-equatorial the model-to-model differences. The other terms are
transport is 0.92. nonnegligible though: predictions with cloud ener-
There is a systematic southward bias in the EBM- getic terms alone are worse than the relation given in
predicted cross-equator transport. This is likely because Fig. 9 (not shown). The effects of I and O are smaller
the EBM does not capture the fact that the NH warms than in Fig. 8 because these terms are located pri-
up more than the SH even in the absence of cross- marily in higher latitudes and less of their effect is felt
equatorial energy source differences. As shown in Fig. 7d, at the equator in the diffusive model (more of the
there is a systematic tendency toward more clear-sky energy source is offset by OLR change on the way to
OLR increase in the NH compared with the SH. The the tropics). Both surface albedo and surface flux are
EBM cannot capture this effect, and hence it has a south- still significant. Changes in surface albedo cause a sys-
ward bias in the cross-equatorial energy transport. In ad- tematic southward cross-equatorial energy transport and
dition to the bias from the temperature effect, the EBM northward ITCZ shift in nearly all models because of
treats the water vapor effect as a function of surface tem- more ice melting in the NH midlatitudes, where it can be
perature alone, and thus it only captures the enhanced communicated more easily to the equator as compared
greenhouse warming that results from increasing satura- with the high-latitude sources in the SH. Surface flux
tion vapor pressure. The EBM therefore also under- changes cause a small northward cross-equatorial trans-
estimates the changes in water vapor associated with the port in some models and a small southward transport in
ITCZ shift, leading to an error that is positively correlated others. The term NS causes a small southward energy
with the shift. Models that have more southward ITCZ transport in nearly all of the models.
shift (red models) tend to have the largest southward As a classification of the importance of different lati-
energy transport bias because they are missing the heating tude bands in the EBM, we plot the EBM prediction
in the SH from increasing water vapor content. using only tropical energy sources (setting the energy732 JOURNAL OF CLIMATE VOLUME 25 sources to be zero poleward of 208N/208S) and the pre- diction using only extratropical energy sources in Fig. 11. It is clear that considering tropical forcings alone is insufficient to explain the model-to-model spread in changes in cross-equator transport. In contrast, by pre- scribing extratropical energy sources only, the EBM is able to capture most of the spread. The correlation coefficient between the predicted change in transport and the actual change in transport in GCMs is 0.86, compared with a correlation coefficient of 0.36 for tropical forcings alone. We thus argue that the ITCZ response in the model is largely driven by the extra- tropics, with the tropics providing a positive feedback on the shifts via the water vapor and cloud LW effects. 5. Conclusions The most uncertain region for projections of pre- cipitation with global warming is the tropics (Solomon et al. 2007). In slab ocean simulations, we have shown that this is largely due to variations in the direction of the shift of the ITCZ, and precipitation changes are felt in an approximately zonally symmetric manner across the tropics. We also have demonstrated a clear relationship between cross-equatorial atmospheric en- ergy transport change and the direction of the ITCZ shift in these models, implying that one can explain the shift in the ITCZ by explaining the cross-equatorial energy transport. Southward shifts of the ITCZ occur because of more positive energy sources in the SH atmosphere than in the NH, which cause northward anomalous energy transports across the equator, and a concurrent southward shift of the ITCZ. Any change in the atmospheric energy budget has the potential to influence the cross-equatorial energy trans- port. We investigate the hemispheric asymmetry of each FIG. 11. As in Fig. 9, but using only (a) tropical energy sources and energy source and quantify its influence on the cross- (b) extratropical energy sources. equatorial energy transport with two methods: 1) in- tegrate the change in the atmospheric energy budget EBM attribution method provides a method to calculate after removing the global mean of each source to calcu- the partition between energy transported across the late the implied change in cross-equatorial transport and equator and changes in OLR, and thus gives a better 2) prescribe the energy source term in an EBM and analyze depiction of how tropical precipitation would shift if this the amount of cross-equatorial transport change assuming term were removed. However, the EBM does not simu- diffusive transport. The first method provides an exact late the changes in water vapor content associated with partitioning, where the contributions of the individual shifts in tropical precipitation, which provide a positive terms add up to the total change in cross-equatorial feedback to any shift (Yoshimori and Broccoli 2009). transport. The second method takes into account the With both attribution methods, we conclude that local change in noncloud OLR caused by each energy clouds cause most of the discrepancies among models. source term. A heating of the atmosphere is balanced Changes in both surface fluxes (which exist despite that to a large extent by increasing OLR because of local these are slab equilibrium simulations) and surface warming. Especially for energy sources far from the albedo contribute a nonnegligible amount to cross- equator, only a small fraction of a given heating will equatorial transport changes and ITCZ shifts. Using translate into a cross-equatorial energy transport. The the EBM, we also quantify the effect of tropical and
15 JANUARY 2012                                     FRIERSON AND HWANG                                                                     733

extratropical energy source terms on the shifts. Tropical                Hoskins, B. J., and D. J. Karoly, 1981: The steady linear response of
water vapor changes provide a positive feedback to any                        a spherical atmosphere to thermal and orographic forcing.
                                                                              J. Atmos. Sci., 38, 1179–1196.
shift in the ITCZ, through drying and enhanced radiative
                                                                         Hwang, Y.-T., and D. M. W. Frierson, 2010: Increasing atmo-
cooling of the hemisphere that the ITCZ shifts away                           spheric poleward energy transport with global warming. Geo-
from, and moistening and enhanced greenhouse warming                          phys. Res. Lett., 37, L24807, doi:10.1029/2010GL045440.
of the hemisphere, which the ITCZ shifts toward. By                      ——, ——, I. M. Held, and B. J. Soden, 2011: Corrigendum.
considering the changes in the atmospheric energy                             J. Climate, 24, 1559–1560.
                                                                         Kang, S. M., I. M. Held, D. M. W. Frierson, and M. Zhao, 2008: The
budget due to clouds, ice, and surface fluxes in the
                                                                              response of the ITCZ to extratropical thermal forcing: Idealized
extratropics only, however, we can explain most of the                        slab-ocean experiments with a GCM. J. Climate, 21, 3521–3532.
spread in cross-equatorial transport among GCMs. This                    ——, D. M. W. Frierson, and I. M. Held, 2009: The tropical re-
implies that most of the discrepancies in the ITCZ                            sponse to extratropical thermal forcing in an idealized GCM:
shifts are due to differences in energetic responses in                       The importance of radiative feedbacks and convective pa-
the extratropics. This result underscores the importance                      rameterization. J. Atmos. Sci., 66, 2812–2827.
                                                                         Koutavas, A., and J. Lynch-Stieglitz, 2004: Variability of the marine
of simulating climate responses from clouds, sea ice,                         ITCZ over the eastern Pacific during the past 30,000 years: Re-
snow, and water vapor with fidelity. In addition to their                     gional perspective and global context. The Hadley Circulation:
importance to local climate, they can have a strong                           Present, Past, and Future, H. F. Diaz and R. S. Bradley, Eds.,
nonlocal impact on tropical precipitation by creating                         Advances in Global Change Research, Vol. 21, Springer, 347–369.
northward or southward shifts in the ITCZ. Ocean heat                    Lea, D. W., D. K. Pak, L. C. Peterson, and K. A. Hughen, 2003:
                                                                              Synchronicity of tropical and high-latitude Atlantic tempera-
transport changes can have similar effects on shifting
                                                                              tures over the Last Glacial Maximum. Science, 301, 1361–1364.
the ITCZ, and we will quantify the importance of this                    Lin, J.-L., 2007: The double-ITCZ problem in IPCC AR4 coupled
term in future studies of coupled GCM simulations of                          GCMs: Ocean–atmosphere feedback analysis. J. Climate, 20,
global warming.                                                               4497–4525.
                                                                         Pahnke, K., J. P. Sachs, L. Keigwin, A. Timmerman, and S.-P. Xie,
                                                                              2007: Eastern tropical Pacific hydrologic changes during the past
  Acknowledgments. We acknowledge the helpful                                 27,000 years from D/H ratios in alkenones. Paleoceanography,
conversations with John Chiang, Sarah Kang, Dennis                            22, PA4214, doi:10.1029/2007PA001468.
Hartmann, and Mark Zelinka. DMWF is supported by                         Sachs, J. P., D. Sachse, R. H. Smittenberg, Z. Zhang, D. S. Battisti,
NSF Grants ATM-0846641 and AGS-0936069, and a                                 and S. Golubic, 2009: Southward movement of the Pacific in-
                                                                              tertropical convergence zone AD1400–1850. Nat. Geosci., 2,
University of Washington Royalty Research Fund grant.
                                                                              519–525, doi:10.1038/NGEO554.
                                                                         Soden, B. J., I. M. Held, R. Colman, K. M. Shell, J. T. Kiehl, and
                                                                              C. A. Shields, 2008: Quantifying climate feedbacks using ra-
                          REFERENCES
                                                                              diative kernels. J. Climate, 21, 3504–3520.
Broccoli, A. J., K. A. Dahl, and R. J. Stouffer, 2006: Response of       Solomon, S., D. Qin, M. Manning, M. Marquis, K. Averyt, M. M. B.
    the ITCZ to Northern Hemisphere cooling. Geophys. Res.                    Tignor, H. L. Miller Jr., and Z. Chen, Eds., 2007: Climate
    Lett., 33, L01702, doi:10.1029/2005GL024546.                              Change 2007: The Physical Science Basis. Cambridge Uni-
Cheng, W., C. M. Bitz, and J. C. H. Chiang, 2007: Adjustment of the           versity Press, 996 pp.
    global climate to an abrupt slowdown of the Atlantic meridi-         Taylor, K. E., M. Crucifix, P. Braconnot, C. D. Hewitt, C. Doutriaux,
    onal overturning circulation. Ocean Circulation: Mechanisms               A. J. Broccoli, J. F. B. Mitchell, and M. J. Webb, 2007: Esti-
    and Impacts, Geophys. Monogr., Vol. 173, Amer. Geophys.                   mating shortwave radiative forcing and response in climate
    Union, 295–314.                                                           models. J. Climate, 20, 2530–2543.
Chiang, J. C. H., and C. M. Bitz, 2005: Influence of high latitude ice   Trenberth, K. E., and D. P. Stepaniak, 2003: Covariability of
    cover on the marine intertropical convergence zone. Climate               components of poleward atmospheric energy transports on
    Dyn., 25, 477–496.                                                        seasonal and interannual timescales. J. Climate, 16, 3691–3705.
——, M. Biasutti, and D. S. Battisti, 2003: Sensitivity of the Atlantic   Wu, Y., M. Ting, R. Seager, H.-P. Huang, and M. A. Cane, 2010:
    intertropical convergence zone to Last Glacial Maximum                    Changes in storm tracks and energy transports in a warmer climate
    boundary conditions. Paleoceanography, 18, 1094, doi:10.1029/             simulated by the GFDL CM2.1 model. Climate Dyn., 37, 53–72.
    2003PA000916.                                                        Yoshimori, M., and A. J. Broccoli, 2008: Equilibrium response of an
——, W. Cheng, and C. M. Bitz, 2008: Fast teleconnections to the               atmosphere–mixed layer ocean model to different radiative forcing
    tropical Atlantic sector from Atlantic thermohaline adjustment.           agents: Global and zonal mean response. J. Climate, 21, 4399–4423.
    Geophys. Res. Lett., 35, L07704, doi:10.1029/2008GL033292.           ——, and ——, 2009: On the link between Hadley circulation
Donohoe, A., and D. S. Battisti, 2012: What determines meridional             changes and radiative feedback processes. Geophys. Res. Lett.,
    heat transport in climate models? J. Climate, in press.                   36, L20703, doi:10.1029/2009GL040488.
Held, I. M., and B. J. Soden, 2006: Robust responses of the hy-          Zelinka, M. D., and D. L. Hartmann, 2012: Climate feedbacks and
    drological cycle to global warming. J. Climate, 19, 5686–                 their implications for poleward energy flux changes in a warm-
    5699.                                                                     ing climate. J. Climate, 25, 608–624.
Horel, J. D., and J. M. Wallace, 1981: Planetary-scale atmospheric       Zhang, R., and T. L. Delworth, 2005: Simulated tropical response
    phenomena associated with the Southern Oscillation. Mon.                  to a substantial weakening of the Atlantic thermohaline cir-
    Wea. Rev., 109, 813–829.                                                  culation. J. Climate, 18, 1853–1860.
You can also read