Modified hydrologic regime of upper Ganga basin induced by natural and anthropogenic stressors - Nature
←
→
Page content transcription
If your browser does not render page correctly, please read the page content below
www.nature.com/scientificreports
OPEN Modified hydrologic regime
of upper Ganga basin induced
by natural and anthropogenic
stressors
Somil Swarnkar1, Pradeep Mujumdar1* & Rajiv Sinha2
Climate change and anthropogenic activities pose serious threats to river basin hydrology worldwide.
The Ganga basin is home to around half a billion people and has been significantly impacted by
hydrological alterations in the last few decades. The increasing high-intensity rainfall events often
create flash flooding events. Such events are frequently reported in mountainous and alluvial plains
of the Ganga basin, putting the entire basin under severe flood risk. Further, increasing human
interventions through hydraulic structures in the upstream reaches significantly alter the flows during
the pre-and post-monsoon periods. Here, we explore the hydrological implications of increasing
reservoir-induced and climate-related stressors in the Upper Ganga Basin (UGB), India. Flow/sediment
duration curves and flood frequency analysis have been used to assess pre-and post-1995 hydrological
behaviour. Our results indicate that low and moderate flows have been significantly altered, and the
flood peaks have been attenuated by the operation of hydraulic structures in the Bhagirathi (western
subbasin). The Alaknanda (eastern subbasin) has experienced an increase in extreme rainfall and flows
post-1995. The downstream reaches experience reservoir-induced moderate flow alterations during
pre-and post-monsoon and increasing extreme flood magnitudes during monsoon. Furthermore,
substantial siltation upstream of the reservoirs has disrupted the upstream–downstream
geomorphologic linkages.
Since 1901 the global average surface temperature has risen by 0.89° due to direct and indirect impacts caused
by human activities on earth system p rocesses1,2. In turn, global warming has significantly impacted the local
and regional hydrological cycle worldwide3–5. Significant variability in rainfall frequency and magnitude due
to changing hydrometeorological conditions has been reported across the g lobe6–9. As a result, severe flooding
to drought conditions have become more frequent and have significantly impacted socio-economic activities
in different parts of the world10. In addition, direct human activities such as changes in land cover, surface &
groundwater withdrawal, and operations of hydraulic structures have also significantly altered the river basin
hydrology in several regions11,12.
In general, dams and reservoirs play a significant role in attenuating flood peaks, frequency, duration and
magnitude globally, particularly low fl ows13,14. Further, dams and reservoirs have also disrupted the sediment
delivery to the downstream reaches, causing alteration in river channel morphology and downstream sediment
starvation15,16. Consequently, river deltas are sinking at unprecedented rates worldwide17. Apart from the hydro-
logical, ecological, and societal stresses caused by these large dams and reservoirs, previous researchers have also
questioned their economic v iability18,19.
In India, rivers largely govern freshwater resources and are considered as the lifeline of the nation. More than
70% of the rural population depends upon freshwater resources for irrigation and agricultural demands fulfilled
by several large and small rivers in India20. However, it has been observed that the changing climatic conditions
in recent decades have significantly increased the extremity of severe droughts and devastating flooding events
in several parts of the c ountry21–23. The Himalayan regions are one of the worst affected regions in the recent
decades24–27. Further, several major Himalayan Rivers, particularly the Ganga River basin, are regulated by more
than 300 hydraulic structures (planned, commissioned and under construction) to harness the hydropower
and cater for agricultural water demands28,29. As a result, the upstream–downstream linkages of hydrological,
1
Interdisciplinary Centre for Water and Research (ICWaR), Indian Institute of Science (IISc), Bangalore,
India. 2Department of Earth Sciences, Indian Institute of Technology Kanpur (IITK), Kanpur, India. *email:
pradeep@iisc.ac.in
Scientific Reports | (2021) 11:19491 | https://doi.org/10.1038/s41598-021-98827-7 1
Vol.:(0123456789)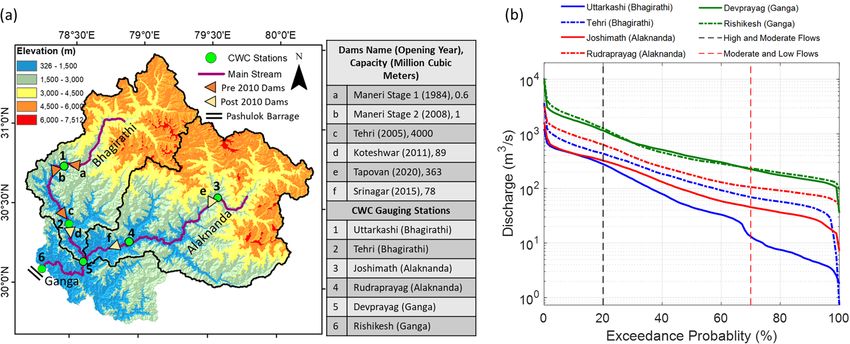
www.nature.com/scientificreports/
Figure 1. (a) Digital Elevation Model (DEM) of the UGB. The major stream network is also shown in the map
using magenta lines. The CWC stations and dams are illustrated using filled green circles, orange and yellow
triangles, respectively. Parallel black lines show the Pashulok barrage, located below the Rishikesh. Further, the
name of dams and corresponding opening year is also shown in the side table. The QGIS Version 3.2 (https://
qgis.org/en/site/forusers/download.html) was used to generate this figure. (b) Flow duration curves (FDCs) for
the period 1970–2010. The solid and dashed blue, red and green FDC lines are shown for Bhagirathi (Uttarkashi
and Tehri), Alaknanda (Joshimath and Rudraprayag) and downstream stations (Devprayag and Rishikesh),
respectively.
geomorphological and ecological processes in the Himalayan River basins are severely impacted30–34. Therefore,
river practitioners and scientists need to understand the implications of hydrological modifications caused by
changing climate and anthropogenic activities.
In the Himalayan regions of the Ganga basin, several studies have been done to assess the impacts of land
use land cover change35,36, sediment dynamics37–39, climate change hazards24–26,40, heavy metal41, water quality42
and glacier meltwater c ontribution43. Nevertheless, detailed studies focusing on hydrological alterations caused
by these hydrological structures and changing climatic conditions are currently lacking. Therefore, in this work,
we select the Upper Ganga Basin (UGB) to assess the role of changing climatic conditions and increasing human
activities on stream flows. The available hydrological dataset at different gauging stations was used to perform the
hydrological analysis for pre-and post-dam conditions in the UGB. We first estimate the changing magnitudes
of flows at those locations where large hydraulic structures were built before 1995 in the UGB. We further inves-
tigate the hydrological changes owing to changing climatic conditions and operations of hydraulic structures.
Finally, we have assessed how these upstream hydrological modifications altered the hydrological regimes of
the downstream regions of the UGB. The inferences drawn from the present study would be immensely useful
for sustainable river basin management.
Study area
The Ganga River has two major tributaries in the upper mountainous region. The western tributary, the Bha-
girathi, originates from the Gangotri glacier (30.92° N, 79.08° E) at an elevation of about 4023 m. The eastern
tributary, the Alaknanda, originates from the Satopanth glacier (30.79 N, 79.37 E), an elevation of about 4600 m.
At Devprayag, both tributaries join to form the Ganga. Here, we have selected the Upper Ganga Basin (UGB)
up to Rishikesh (area 21,000 km2) for this study (Fig. 1a). In the Bhagirathi basin, there are four dams, namely
Maneri Stage 1, Maneri Stage 2, Tehri and Koteshwar dam (Figs. 1a, 2a), and most of these became operational
before 2010. There are only two dams in the Alaknanda basin, namely Tapovan and Srinagar, which became
operational after 2015 (Fig. 1a). Further, the Pashulok barrage is present downstream of Rishikesh. Furthermore,
around 37 small and large dams are planned in the UGB (Fig. 2b), 11 in the Bhagirathi and 26 in the Alaknanda
basin44 (Fig. 2c,d). The mean annual rainfall in the UGB ranges from 840 to 1990 mm (Fig. S1a). Almost 70%
of the UGB receives 1000–1250 mm of rain annually, except for small patches in the western and eastern parts
where more than 1500 mm of the mean annual rainfall occurs (Fig. S1a). Overall, the Indian Summer Monsoon
(ISM) contribution across the UGB varies from 51 to 86% (Fig. S1b), leading to significant hydrological vari-
abilities across the basin (Fig. 1b).
Methodology
We used daily rainfall, discharge and suspended sediment load datasets for understanding the hydrological char-
acteristics of the UGB. The details of the input dataset used in this study are listed in Table S1 (Supplementary).
The exceedance probabilities were estimated in rainfall intensities, flows and sediment at each hydrological sta-
tion. These estimates are depicted using the rainfall exceedance probability analysis, flow duration curve (FDC)
and sediment duration curve (SDC). The daily rainfall, discharge, and suspended sediment datasets were divided
Scientific Reports | (2021) 11:19491 | https://doi.org/10.1038/s41598-021-98827-7 2
Vol:.(1234567890)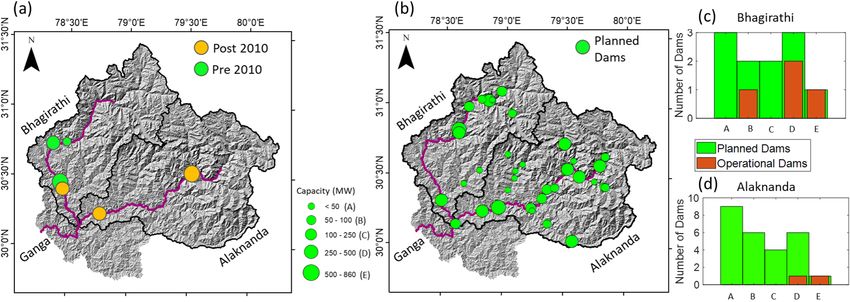
www.nature.com/scientificreports/
Figure 2. (a) Hydraulic structures in the UGB. The green and orange filled circles are showing the hydraulic
structures commissioned pre-and post-2010 on the map. All these hydraulic structures’ circle sizes vary
according to their hydropower generation capacity (MW). Further, A, B, C and D classes are defined based on
each reservoir’s hydropower generation capacity. (b) The map shows planned hydraulic structures for the near
future in the UGB. The QGIS Version 3.2 (https://qgis.org/en/site/forusers/download.html) was used to generate
these figures. Furthermore, the bar plots show the current hydraulic structures and planned hydraulic structures
for the near future in (c) the Bhagirathi and (d) the Alaknanda basin. The hill shade map of the UGB is used in
the background.
into two periods—(1) 1971–1994 (pre-1995), and (2) 1995–2010 (post-1995). This temporal division was done
based on the fact that the construction of a large hydraulic structure, i.e., Tehri dam (total capacity 4000 million
cubic meters), started in 1995 in the Bhagirathi basin, and the frequency of flash flooding events increased in the
UGB after 1995 (see Table S2). Hence, the anthropogenic and climate-induced alterations in the hydrology of the
UGB could be captured by comparing the pre-1995 and post-1995 FDCs and SDCs. The FDCs and SDCs differ-
ences (in percentages) that showed for post-1995 were estimated with reference to pre-1995 FDCs and SDCs for
all the gauge stations (see Figs. S3 and S4 in Supplementary). Further, the daily rainfall, discharge and sediments
dataset for the 1971–2015 period at six stations are used for the hydrological analyses (Fig. 1a and Table S1). The
first five years, i.e., 1971–1975, were selected in the Bhagirathi (at Uttarkashi and Tehri) and Alaknanda basin
(at Joshimath and Rudraprayag) for initial reference conditions. However, the initial reference conditions at
Devprayag and Rishikesh were considered to be 1976–1980 due to the unavailability of discharge and sediments
data for the 1971–1975 period. In addition, 5-yearly rainfall magnitudes, FDCs and SDCs were also estimated and
compared with each station’s reference condition to assess the temporal hydrological variations. The differences
(in percentage) in 5-yearly rainfall magnitudes, FDCs and SDCs were calculated by subtracting selected 5-year
periods with the initial reference condition and plotted on the 2D-contour plot for each station.
We also used the frequency analysis of extreme flows (annual maximum discharge) with the Generalized
Extreme Value Type-1 (Gumbel) d istribution45 at each station to estimate extreme discharge between 10- and
100-year return periods for pre-and post-1995. The Gumbel distribution for each station was selected based on
Akaike Information Criterion (AIC) by comparing five widely used distributions, namely, (1) Lognormal, (2)
Gamma, (3) Gumbel, (4) Weibull, and (5) Generalized Extreme Value (GEV; Table S3). The scale and location
parameters of the Gumbel distribution were estimated using the Maximum Likelihood Estimation (MLE) method
using the ‘FAmle’ package (https://github.com/tpetzoldt/FAmle) in R programming (see Fig. S5 in Supplemen-
tary). The differences between pre-and post-1995 extreme flows at different return periods were estimated and
compared for all six gauging stations of the UGB (see Fig. S9 in Supplementary). It should be noted here that
the credible extrapolation interval in flood frequency analysis is generally up to twice the record length. Hence,
the 95% confidence bounds were also assessed and plotted in the return level graph for pre-1995, post-1995 and
whole time series at each station of the UGB (see Figs. S6, S7 and S8 in Supplementary).
Results and discussion
Pre‑and post‑1995 hydrological scenarios. The UGB has experienced a widespread increase in high-
intensity rainfall events after 1995 (Fig. 3a,b). These are statistically increasing (p < 0.05) trends predominantly
in the Alaknanda basin (Fig. 3b). It is also noted that the Alaknanda basin has been experiencing a rising trend
of high-intensity rainfall events compared to the Bhagirathi basin since 1995. The observed records also sug-
gest an increase in extreme flooding events in the UGB (Fig. 3c,d and Table S2). A total of 9 and 25 extreme
flooding events are reported for the two basins together during the pre-and post-1995 period, respectively. The
Bhagirathi basin has experienced 2 and 11 extreme flooding events during the pre-and post-1995 period (Fig. 3c
and Table S2). The Alaknanda basin has undergone 7 and 14 extreme flooding events during the pre-and post-
1995 period (Fig. 3d and Table S2). In terms of temperature, the Bhagirathi and the Alaknanda basins show
statistically significant increasing trends. However, these increasing trends detected by the statistical tests are
likely driven by the step-change that occurred between pre-and post-2000, possibly suggesting a shift in the
Scientific Reports | (2021) 11:19491 | https://doi.org/10.1038/s41598-021-98827-7 3
Vol.:(0123456789)
www.nature.com/scientificreports/

                                            Figure 3.  (a) Pre-and (b) post-1995 average 95th percentile rainfall magnitudes for 1970–2019. The different
                                            sizes of green filled circles represent the increasing Sen’s slope for the 95th percentile rainfall events at the 5%
                                            significance level. There is one orange-filled circle present in the Bhagirathi basin, which shows decreasing
                                            Sen’s slope for the 95th percentile rainfall events at a 5% significance level. (c,d) Shows bar plots 95th percentile
                                            rainfall of the Bhagirathi and Alaknanda basins for each year between 1970 and 2019. The blue and red bars
                                            show pre-and post-1995 annual cumulative rainfall magnitudes. The horizontal grey line shows the mean value
                                            of 95th percentile rainfall for the pre-and post-1995 period in both the bar plots. The mean (µ) and standard
                                            deviation (σ) of annual rainfall are also shown in both figures. Based on the available literature (see Table S2
                                            in Supplementary Section), the extreme flooding events are also mentioned for the corresponding plots of the
                                            Bhagirathi and Alaknanda River basins.

                                            instrumentation (Fig. S2a,c). Further, there is no step-change or significant trend detected in the maximum
                                            temperature for both the basins (Figs. S2b,d).
                                                In the Bhagirathi basin, the difference of post-and pre-1995 FDCs suggests a substantial reduction of up to
                                            80% in very low flows (> 90% exceedance probability) at Uttarkashi (Fig. 4 and Table S4). The 5-yearly rainfall
                                            magnitude differences suggest around 50–100% reduction in low and moderate magnitude rainfall events from
                                            the reference period (Fig. 5a). Further, the 5-yearly differences of FDCs reveal around 60–90% decline in low
                                            and moderate flows at Uttarkashi (Fig. 5b). Coincidently, upstream of Uttarkashi, the Maneri Stage 1 dam con-
                                            struction was started in the 1960s, and this dam became operational in 1984 (Fig. 1a). Therefore, a very sharp
                                            reduction in the low and moderate flows from the reference condition can be directly correlated to the operation
                                            of the Maneri Stage 1 dam. However, a decrease in the magnitude of low and moderate rainfall after 1991 (Fig. 5a)
                                            further attenuated the low and moderate flows at Uttarkashi station (Fig. 5b). Furthermore, the Maneri Stage 2
                                            dam, located immediately downstream of the Uttarkashi, became operational in 2008 (Fig. 1a), and this might
                                            have also started influencing the hydrology at Uttarkashi since then.
                                                In contrast, at Tehri, the flows between 30 and 85% exceedance probability (moderate to low flows) have
                                            increased by 80% in post-1995 (Figs. 4, 5d) with reference to pre-1995. The difference in the FDCs of pre-and
                                            post-1995 FDCs suggests that the moderate and low flows increased rapidly downstream of the Tehri dam after
                                            becoming operational (Fig. 4). Additionally, the very low flows (> 90% exceedance probability) have decreased
                                            by 90% at Tehri (Fig. 5d). The 5-yearly differences in rainfall magnitudes suggest that the moderate and low
                                            rainfall magnitudes decreased significantly after 1991 (30% to 100%; Fig. 5c). The magnitude of very high rainfall
                                            (< 10% exceedance probability) has increased up to 30% at Tehri. In comparison, the characteristics of high and
                                            moderate flows behaviour after 1995 do not match those of high and moderate rainfall magnitudes (Fig. 5c,d).
                                            Such anomalous hydrological behaviour of the Bhagirathi River at Tehri strongly suggests alteration of flow
                                            regime caused by the Tehri dam operation. Hence, the existence of dams in the Bhagirathi basin has reduced
                                            the extreme flows and floods downstream. Further, the moderate and low flows have significantly increased
                                            up to 125% post-2005. These abrupt increments and decrements in the flows are not observed anywhere in the

          Scientific Reports |   (2021) 11:19491 |               https://doi.org/10.1038/s41598-021-98827-7                                                         4

Vol:.(1234567890)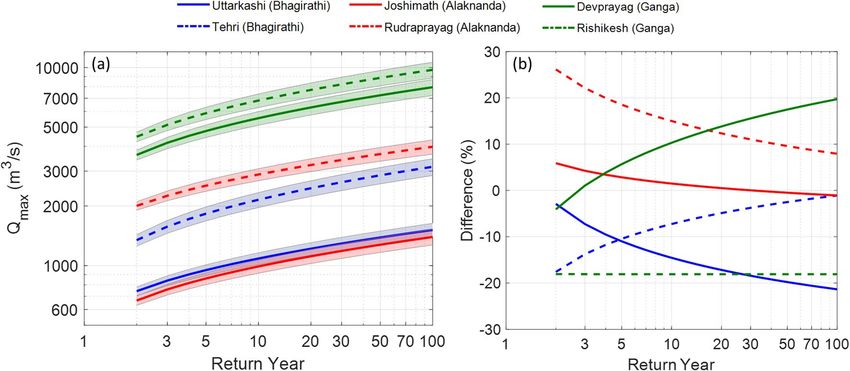
www.nature.com/scientificreports/
Figure 4. Difference between post-and pre-1995 flow duration curves (FDCs). These differences (%) are
plotted for Uttarkashi (blue line), Tehri (dashed blue line), Joshimath (red line), Rudraprayag (dashed red line),
Devprayag (green line) and Rishikesh (green dashed line) stations of the UGB. The division between high and
moderate (at 20%) and moderate and low (at 70%) flows are shown by dashed black and dashed red vertical
lines.
UGB (Figs. 4, 5). Besides, the upstream (Uttarkashi) and downstream (Tehri) stations in the Bhagirathi behave
differently. These distinct and abrupt hydrological behaviour indicate the significant impact of Maneri and Tehri
dams in modifying the water outflux from the Bhagirathi basin.
In the Alaknanda basin, there was no dam before 2010 (Fig. 1a). The Srinagar dam and Tapovan dam became
operational in 2015 and 2020, r espectively46. Thus, the possibility of anthropogenically altered river flow due to
reservoir operation can be ruled out before 2010. The differences in the post-and pre-1995 FDCs suggest that
the high and moderate flows increased at Joshimath and Rudraprayag (Fig. 4 and Table S4). These differences are
more predominant at Rudraprayag (up to 40%). In particular, the 5-yearly differences of FDCs from their refer-
ence condition also reveal that the high flows increased significantly after 1995 at both locations (Fig. 5f,h). High
flows at Rudraprayag show an increasing trend until 2010. However, a sudden increase (up to 100% or doubled)
in high flows is observed between 1995 and 2005 for Joshimath station. The 5-yearly rainfall differences suggest
increasing high magnitude rainfall after 1995 at Joshimath (up to 150%) and Rudraprayag (up to 50%; Fig. 5e,g).
It is also evident that the increasing trends (p < 0.05) of high rainfall intensities (95th percentile) have doubled
(0.6 mm/y in pre-1995 and 1.2 mm/y in post-1995) and are more widespread in the Alaknanda basin (Fig. 3b).
Therefore, we argue that the increase in the high flows is linked to increasing intensities of high-intensity rainfall
events in the Alaknanda basin. Further, the reported extreme events strongly suggest an increase of extreme
rainfall linked to flooding events in this basin (Fig. 3d), which have doubled (7 events in pre-1995 and 14 events
in post-1995). These observations indicate that the changing climatic conditions, remarkably increasing trends
of high-intensity rainfall events primarily controlled the hydrology of the Alaknanda basin until 2010. However,
after the opening of the Srinagar dam (in 2015) and the Tapovan dam (in 2020; Fig. 1a), the current flows might
have been anthropogenically modified in addition to the impact of changing climatic conditions.
In the downstream reaches, high and very low flows (20% < and > 90% exceedance probability) are governed
by increasing and decreasing flows from the Alaknanda and Bhagirathi basins, respectively (Fig. 4). However,
the moderate and low flows (20–90% exceedance probability) at Devprayag and Rishikesh are predominately
influenced by the moderate flows coming out from the Tehri (Bhagirathi). The 5-yearly FDCs differences at
Devprayag and Rishikesh further suggest a substantial increase in moderate and low flows (> 40%), particularly
after 2005 (Fig. 5j,l and Table S4). However, there are no such substantial increments observed in the moderate
and low rainfall magnitudes at both downstream stations (Fig. 5i,k). These patterns strongly correlate with Tehri’s
post-2005 moderate and low flows fluctuations (Fig. 5d). Therefore, these observations suggest that the Tehri
dam’s water flux increased the moderate and low flows at Devprayag and Rishikesh since 2005, although these
fluctuations became more significant post-2010 (Fig. 5j,l).
Further, sediment duration curves (SDCs) suggest that high sediment fluxes are nearly similar for downstream
stations. However, moderate and low sediment fluxes are an order of magnitude higher for the Devprayag and
Rishikesh stations (Fig. 6a). These differences indicate that a significant amount of sediments has been deposited
between Devprayag and Rishikesh, possibly due to reduced inflow. The post- and pre-1995 differences suggest
that high sediment fluxes (50% < exceedance probability) have decreased up to 50% at both locations (Fig. 6b).
Scientific Reports | (2021) 11:19491 | https://doi.org/10.1038/s41598-021-98827-7 5
Vol.:(0123456789)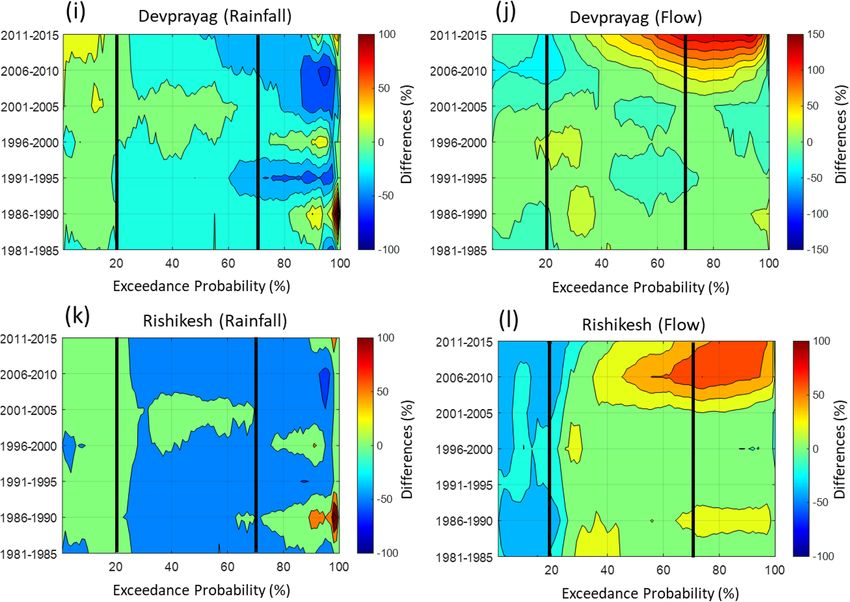
www.nature.com/scientificreports/

          Scientific Reports |   (2021) 11:19491 |   https://doi.org/10.1038/s41598-021-98827-7   6

Vol:.(1234567890)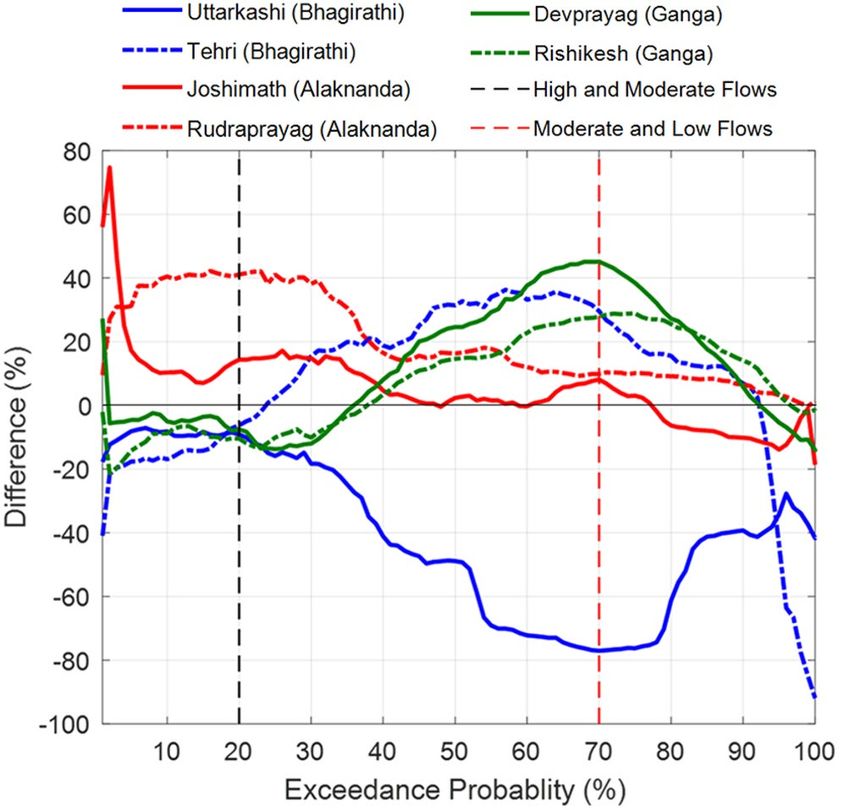
www.nature.com/scientificreports/
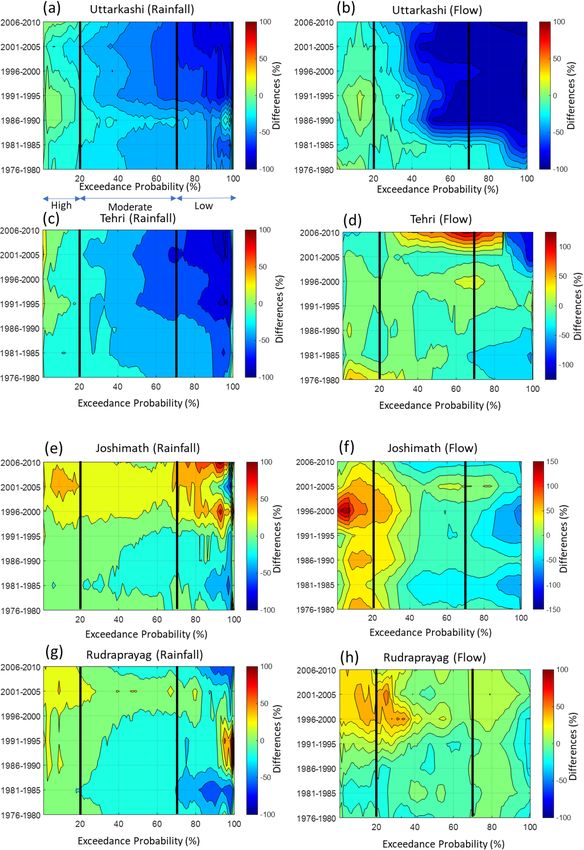
▸ Figure 5. 5-yearly differences in rainfall and flow duration curves (FDCs) are plotted using 2d contour plot
for each station. The high (20% 70%) flows are divided by black vertical
lines. (a) The Uttarkashi station shows 90% reduction in low rainfall. The high rainfall slightly increased (up
to 10% since 1986). (b) The Uttarkashi station shows up to 90% reduction (1981–1985) in low flows. The high
flows also decreased up to 30%. (c) The Tehri station shows a reduction of 100% in low rainfall throughout the
period. There is no anomalous behaviour observed in low and moderate rainfall magnitudes after 2005 at Tehri.
(d) The Tehri station shows a reduction of up to 50% in low flows until 1990. After 2000, the reduction in low
flows up to 85% is also appeared here. The high flows increased by 50% after 2005. The moderate flows have
been increased up to 80% after 2005. (e) The Joshimath station shows increasing high, low and moderate rainfall
magnitudes after 1996. The high and low magnitude rainfalls are increased up to 30% and 50%, respectively. (f)
The Joshimath station shows a reduction from 20 to 70% in low and moderate flows. The high flows increased
by 20% from the reference condition. (g) The Rudraprayag station shows increasing high magnitude rainfall by
30% from 1996. The moderate rainfall magnitudes have also slightly increased post-1995. (h) The Rudraprayag
station shows a 10–20% reduction in all flows until 1995. The high flows have been increased 20–40% after 1995.
The high rainfall magnitudes have increased up to 10% at (i) Devprayag and (k) Rishikesh stations. However,
the high rainfall magnitudes have increased steeply (up to 30%) after 2005 at Devprayag than Rishikesh. The
low and moderate rainfall magnitudes have decreased from the reference period at both stations. However, the
percentage reductions in low and moderate rainfall magnitudes are slightly higher for the Rishikesh (up to 50%)
than Devprayag (20% to 30%). The major changes in low and moderate flows up to 80% and 40% appeared at (j)
Devprayag and (l) Rishikesh after 2005.
Figure 5. (continued)
These differences indicate that a considerable part of high-magnitude sediment flux is deposited upstream of
Devprayag (possibly in the Tehri and Maneri reservoirs; Fig. 1a) and not reaching the main channel downstream.
Moderate and low sediment fluxes (> 50% exceedance probability) have increased tremendously at Devprayag
(up to 260%) and Rishikesh (up to 70%; Fig. 6b). These incredibly increasing amounts can be linked to sediment
reworking caused by abrupt behaviour of moderate and low flows at Devprayag and Rishikesh governed by the
reservoir-induced increase of moderate and low flows (Figs. 4, 5d,j,l). Therefore, these observations strongly
suggest that the Tehri dam in the Bhagirathi basin plays a crucial role in determining the hydrological variability
of the downstream UGB region.
Role of natural and anthropogenic stressors on changing extreme flows. Frequency analysis
of extreme flooding events suggests that the UGB has experienced contrasting responses due to natural and
anthropogenic forcing. For instance, at Uttarkashi and Tehri, the Bhagirathi basin exhibits a total reduction of
extreme flows at different return periods. Around -14.5%, -17.9% and -21.3% reductions are observed in the
Scientific Reports | (2021) 11:19491 | https://doi.org/10.1038/s41598-021-98827-7 7
Vol.:(0123456789)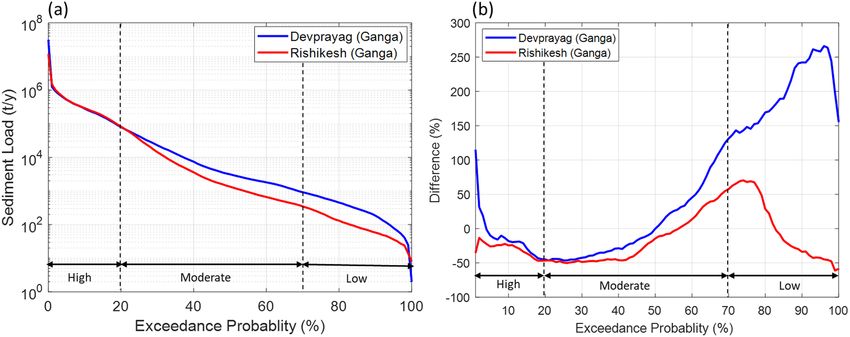
www.nature.com/scientificreports/
Figure 6. (a) Sediment duration curves (SDCs) of Devprayag (blue) and Rishikesh (red) for the period
1970–2015. The high sediment fluxes (20% 70%) are an order of magnitude higher for Devprayag than the Rishikesh station. (b) Difference (%) between
pre-and post-1995 SDCs of Devprayag (blue) and Rishikesh (red) stations. The peak sediment flows have been
increased (120%) at Devprayag. In contrast, the peak sediment fluxes have been decreased (− 25%) at Rishikesh.
Furthermore, the moderate sediment fluxes have also been reduced (up to 50%) at both stations. However,
moderate and low sediment fluxes greater than 50% and 55% exceedance probability are increased from their
pre-1995 values at both stations.
magnitude of 10, 50 and 100-year return period floods at Uttarkashi (Fig. 7a,b and Table S4). In comparison,
around -7.3%, -2.5% and -1.1% reductions are observed in the magnitude of 10, 50 and 100-year return period
floods at Tehri (Fig. 7b). Such decreasing extreme flows in the Bhagirathi basin are primarily governed by two
major factors: (1) presence of small and large hydraulic structures such as Maneri Stage 1, Maneri Stage 2, Tehri
and Koteshwar dam (Fig. 1a), and (2) no significantly increasing or decreasing trends in the high-intensity rain-
fall events (Fig. 3a,b).
In contrast, the Alaknanda river at Joshimath and Rudraprayag show an increase of extreme flows at dif-
ferent return periods. For instance, around 1.5%, -0.5% and -1.1% differences are observed in the magnitude
of 10-, 50-and 100-year return period floods at Joshimath (Fig. 7b and Table S4). In comparison, around
15%, 9.6% and 7.9% increments are observed in the magnitude of 10-, 50-and 100-year return period floods
at Rudraprayag (Fig. 7b and Table S4). Therefore, the extreme flows and flooding events in the Alaknanda
basin (particularly at Rudraprayag) are primarily governed by two major factors: (1) no hydraulic structures
present before 2010 (Fig. 1a), and (2) widespread increasing high-intensity rainfall in this basin (Fig. 3a,b,d).
Further, the oldest dam, Maneri Stage 1, has been operational since 1984 in the Bhagirathi basin, whereas the
Srinagar dam and Tapovan dam in the Alaknanda became operational in 2015 and 2020, respectively. Therefore,
we argue that the increasing number of hydraulic structures after 2015 has also impacted the extreme flows of
the Alaknanda basin.
The downstream stations of the UGB behave differently when we compare the pre-and post-1995 extreme
flows at different return periods. For instance, we document an increment of 10.3%, 17.5% and 19.7% in the
magnitude of 10-, 50- and 100-year floods at Devprayag in the post-1995 period (Fig. 7b and Table S4). How-
ever, the Rishikesh station records an -18.1% reduction in the magnitude of 10-, 50- and 100-year floods in the
post-1995 period (Fig. 7b and Table S4). A reduction in extreme flow magnitudes is possibly because of flow
reduction caused by the Pashulok barrage downstream of the Rishikesh station. We have also observed a signifi-
cant reduction in high magnitude stream flows at Rishikesh than Devprayag station (Fig. 5j,l). The post-1995
extreme flows have decreased in the Bhagirathi basin but increased in the Alaknanda (Fig. 7b). Therefore, a rise
in extreme flooding events at Devprayag station is primarily governed by the changes in hydrometeorological
conditions in the Alaknanda basin. The widespread increase in high-intensity rainfall in the Alaknanda basin
and the reservoir-induced flow alterations are the primary drivers of these changes in observed extreme flow at
Devprayag and Rishikesh (Fig. 3a–c).
It is also observed that the downstream (Rudraprayag) region of the Alaknanda shows an incremental differ-
ence of up to 15% in the extreme flows (Fig. 7b) which makes the entire downstream Alaknanda basin vulnerable
to extreme flooding events in the near future. One such event was reported recently (in February 2021) near
Joshimath, which destroyed the Tapovan d am47. Downstream of Rishikesh, the Ganga River debouches into the
alluvial plains (Fig. 1a), where several populous cities are situated. Therefore, these are the vulnerable regions
where around 20% increase in extreme flooding events (at Devprayag) might enhance the flood risk manifold.
Further, the Pashulok barrage downstream of Rishikesh was constructed in 1980 based on the past extreme flow
information until then. However, the changing climatic conditions in the Alaknanda basin, and hence, an increase
of 10–20% in extreme flows, might severely affect the operations of such structures.
Scientific Reports | (2021) 11:19491 | https://doi.org/10.1038/s41598-021-98827-7 8
Vol:.(1234567890)www.nature.com/scientificreports/
Figure 7. (a) Extreme flows at different return periods at the six stations of the UGB. The Rishikesh
(downstream station) and Joshimath (upstream Alaknanda basin) stations show the highest and lowest extreme
flows at different return periods. The standard errors of the scale and location parameters of the Gumbel
distribution are used to predict the error bound and shown using shaded regions around each return level
curve. The details of 95% confidence bounds around the prediction of return level for each station are given
in Supplementary. (b) Post-and pre-1995 differences of extreme flows at different return periods for different
stations.
Increasing anthropogenic activities and their future impacts. Overall, these hydrological analyses
indicate that the flow in the Bhagirathi basin has been anthropogenically modified owing to the presence of sev-
eral large and small dams (Figs. 1a, 4, 5b,d). In particular, low and moderate flows, which occur primarily during
pre- (Jan-May) and post-monsoon (Oct-Dec) periods, are significantly impacted (Figs. 4, 5b,d). The Alaknanda
was a free-flowing river before the Srinagar dam was commissioned in 2015 (Figs. 1a, 4, 5f,h), followed by the
Tapovan dam in 2020 (Fig. 1a,b). However, our data records could not capture these hydrological alterations at
Joshimath and Rudraprayag in the Alaknanda (see Table S1). Recent hydrological records can be further used to
verify these hydrological changes. We have demonstrated that the present low and moderate flows coming out
from Devprayag and Rishikesh (downstream of the UGB) are entirely modified anthropogenically (Figs. 4, 5j,l).
The interventions have severely affected the upstream and downstream hydrology and geomorphology of the
Bhagirathi basin (Figs. 5j,l, 6a,b).
Around 11 and 26 additional dams of different power generation capacities in the Bhagirathi and Alaknanda
basin, respectively, are planned44 (Fig. 2b–d). These planned hydraulic structures will be located on several small
and large tributaries of the UGB (Fig. 2b). These structures are likely to impact the low and moderate flows of the
UGB further, as demonstrated in the case of the Bhagirathi basin. Additionally, the increasing number of dams
will also influence the sediment transport processes across the UGB (Fig. 6b). Further, a significant increase in
the high magnitude flows is also observed in the Alaknanda River basin and Devprayag (Fig. 7a,b). The impact of
changing climatic conditions are more predominant in the Alaknanda basin (Fig. 3a,b). Our extreme frequency
analysis also suggests an increase in the magnitude of extreme flows for different return periods in the Alaknanda
basin (Fig. 7a,b). Further, the observed records indicate an increase in the frequency of extreme flood events in
the UGB, especially in the Alaknanda basin (Fig. 3a,b). During the flash flood event at Joshimath in February
202147, high discharges were quickly managed because of the lean condition of the mainstream. However, if this
event had occurred during the monsoon season, it could pose a severe flood risk in the downstream regions. In
the past, the UGB region also witnessed the June 2013 Kedarnath disaster when rainfall magnitudes crossed a
111-year return period and produced a massive flood in the monsoon period26 (Table S2). Thus, the changing
extremity of streamflow in the UGB poses serious impacts on the hydraulic structures that need critical assess-
ment and design modifications.
Conclusions
The Ganga River is the lifeline for close to half a billion people in the northern Indian region. During the twen-
tieth century, the hydrology of the basin has been significantly modified owing to increasing anthropogenic
interventions and changing climatic conditions. In particular, the upper Ganga basin (UGB) has witnessed
modifications in the flow regime owing to several small and large hydraulic structures, particularly in the Bha-
girathi basin (western tributary). In contrast, the Alaknanda basin (eastern tributary) has experienced increasing
magnitudes of extreme rainfall events from 1970 to 2019. Therefore, the flow modifications in these basins have
been influenced by different factors. Our results suggest that the reduction in rainfall magnitudes, Maneri dam
in upstream and Tehri dam in downstream exert primary controls on the flows in the Bhagirathi. As a result,
low and moderate flows increased at Tehri by 125%. In addition, the post-1995 extreme flows at different return
periods have decreased by -21.3% in the Bhagirathi basin. Further, the Alaknanda basin was a free-flowing
Scientific Reports | (2021) 11:19491 | https://doi.org/10.1038/s41598-021-98827-7 9
Vol.:(0123456789)www.nature.com/scientificreports/
river until 2015. The extreme flows at different return periods have increased by 8–15% in the Alaknanda basin,
primarily because of increasing high-intensity rainfall events post-1995. Therefore, the Alaknanda basin has
witnessed some extreme flash flood events in recent years. Simultaneously, the downstream reaches experience
anthropogenically modified low and moderate flows that are attributed to Tehri and other dams during pre-and
post-monsoon months.
Our results further indicate that a significant amount of sediments transported during high flows are trapped
in the Tehri and Maneri reservoirs in the Bhagirathi basin. Therefore, hydraulic structures have significantly
disrupted the upstream–downstream geomorphologic linkages, thereby impacting the channel morphology in
the downstream reaches as observed in several r egions48–51. Furthermore, several hydraulic structures such as the
Pashulok barrage were designed based on analysis of past extreme floods. However, the increasing magnitude
of extreme flows (10-20%), particularly at Devprayag, might also affect the functioning of the Pashulok barrage
during peak monsoon periods. The downstream regions also experience reservoir-induced flow increments
during pre-and post-monsoonal months. Overall, the results obtained from this work should help in sustainable
river basin management and encourage more serious work toward a better understanding of hydrology, ecology,
and geomorphology in the UGB.
Received: 1 June 2021; Accepted: 13 September 2021
References
1. Raftery, A. E., Zimmer, A., Frierson, D. M., Startz, R. & Liu, P. Less than 2 C warming by 2100 unlikely. Nat. Clim. Change 7(9),
637–641 (2017).
2. Brutsaert, W. & Parlange, M. B. Hydrologic cycle explains the evaporation paradox. Nature 396(6706), 30–30 (1998).
3. Scanlon, T. M., Caylor, K. K., Levin, S. A. & Rodriguez-Iturbe, I. Positive feedbacks promote power-law clustering of Kalahari
vegetation. Nature 449(7159), 209–212 (2007).
4. Trenberth, K. E. et al. Climate change 2007: The physical science basis. Clim. Change 235–336 (2007).
5. Steffen, W. et al. Stratigraphic and Earth System approaches to defining the Anthropocene. Earth’s Future 4(8), 324–345 (2016).
6. Mueller, E. N. & Pfister, A. Increasing occurrence of high-intensity rainstorm events relevant for the generation of soil erosion in
a temperate lowland region in Central Europe. J. Hydrol. 411(3–4), 266–278 (2011).
7. Dourte, D., Shukla, S., Singh, P. & Haman, D. Rainfall intensity-duration-frequency relationships for Andhra Pradesh, India:
Changing rainfall patterns and implications for runoff and groundwater recharge. J. Hydrol. Eng. 18(3), 324–330 (2013).
8. Bürger, G., Heistermann, M. & Bronstert, A. Towards subdaily rainfall disaggregation via Clausius-Clapeyron. J. Hydrometeorol.
15(3), 1303–1311 (2014).
9. Jena, P. P., Chatterjee, C., Pradhan, G. & Mishra, A. Are recent frequent high floods in Mahanadi basin in eastern India due to
increase in extreme rainfalls?. J. Hydrol. 517, 847–862 (2014).
10. Olsson, L., Opondo, M., Tschakert, P., Agrawal, A., & Eriksen, S. E. Livelihoods and poverty. In Climate Change 2014: Impacts,
Adaptation, and Vulnerability. Part A: Global and Sectoral Aspects. Contribution of Working Group II to the Fifth Assessment Report
of the Intergovernmental Panel on Climate Change 798–832 (Cambridge University Press, 2014).
11. Haddeland, I. et al. Global water resources affected by human interventions and climate change. Proc. Natl. Acad. Sci. USA 111(9),
3251–3256 (2014).
12. Guyennon, N., Salerno, F., Portoghese, I. & Romano, E. Climate change adaptation in a Mediterranean semi-arid catchment: Test-
ing managed aquifer recharge and increased surface reservoir capacity. Water 9(9), 689 (2017).
13. Magilligan, F. J., Nislow, K. H. & Graber, B. E. Scale-independent assessment of discharge reduction and riparian disconnectivity
following flow regulation by dams. Geology 31(7), 569–572 (2003).
14. Magilligan, F. J. & Nislow, K. H. Changes in hydrologic regime by dams. Geomorphology 71(1–2), 61–78 (2005).
15. Vörösmarty, C. J. et al. Anthropogenic sediment retention: Major global impact from registered river impoundments. Glob. Planet.
Change 39(1–2), 169–190 (2003).
16. Schmidt, J. C. & Wilcock, P. R. Metrics for assessing the downstream effects of dams. Water Resour. Res. https://doi.org/10.1029/
2006WR005092 (2008).
17. Syvitski, J. P. et al. Sinking deltas due to human activities. Nat. Geosci. 2(10), 681–686 (2009).
18. Ansar, A., Flyvbjerg, B., Budzier, A. & Lunn, D. Should we build more large dams? The actual costs of hydropower megaproject
development. Energy Policy 69, 43–56 (2014).
19. Best, J. Anthropogenic stresses on the world’s big rivers. Nat. Geosci. 12(1), 7–21 (2019).
20. Jain, C. K. & Singh, S. Impact of climate change on the hydrological dynamics of River Ganga, India. J. Water Clim. Change 11(1),
274–290 (2020).
21. Gosain, A. K., Rao, S. & Basuray, D. Climate change impact assessment on hydrology of Indian river basins. Curr. Sci. 90, 346–353
(2006).
22. Mukherjee, S., Aadhar, S., Stone, D. & Mishra, V. Increase in extreme precipitation events under anthropogenic warming in India.
Weather Clim. Extremes 20, 45–53 (2018).
23. Rickards, N. et al. Understanding future water challenges in a highly regulated Indian river basin—modelling the impact of climate
change on the hydrology of the Upper Narmada. Water 12(6), 1762 (2020).
24. Chawla, I., Osuri, K. K., Mujumdar, P. P. & Niyogi, D. Assessment of the Weather Research and Forecasting (WRF) model for
simulation of extreme rainfall events in the upper Ganga Basin. Hydrol. Earth Syst. Sci. 22(2), 1095–1117 (2018).
25. Chawla, I. & Mujumdar, P. P. Isolating the impacts of land use and climate change on streamflow. Hydrol. Earth Syst. Sci. 19(8),
3633–3651 (2015).
26. Singh, D. et al. Severe precipitation in Northern India in June 2013: Causes, historical context, and changes in probability. Bull.
Am. Meteorol. Soc. 95(9), S58–S61 (2014).
27. Nie, Y. et al. Glacial change and hydrological implications in the Himalaya and Karakoram. Nat. Rev. Earth Environ. 2(2), 91–106
(2021).
28. Pandit, M. K. & Grumbine, R. E. Potential effects of ongoing and proposed hydropower development on terrestrial biological
diversity in the Indian Himalaya. Conserv. Biol. 26(6), 1061–1071 (2012).
29. Bhatt, J. P., Tiwari, S. & Pandit, M. K. Environmental impact assessment of river valley projects in upper Teesta basin of Eastern Himalaya
with special reference to fish conservation: A review. Impact Assess. Project Apprais. 35(4), 340–350 (2017).
30. Larinier, M. Environmental issues, dams and fish migration. FAO Fish. Tech. Pap. 419, 45–89 (2001).
31. Grumbine, R. E. & Pandit, M. K. Threats from India’s Himalaya dams. Science 339(6115), 36–37 (2013).
32. GRBMP. Management Plan-2015. Consortium of 7 “Indian Institute of Technology” (IITs) (2015).
Scientific Reports | (2021) 11:19491 | https://doi.org/10.1038/s41598-021-98827-7 10
Vol:.(1234567890)www.nature.com/scientificreports/
33. Nepal, S., Flügel, W. A. & Shrestha, A. B. Upstream-downstream linkages of hydrological processes in the Himalayan region. Ecol. Process.
3(1), 1–16 (2014).
34. Swarnkar, S., Sinha, R. & Tripathi, S. Morphometric diversity of supply limited and transport-limited river systems in the Himalayan
foreland. Geomorphology 348, 106882 (2020).
35. Tsarouchi, G. & Buytaert, W. Land-use change may exacerbate climate change impacts on water resources in the Ganges basin. Hydrol.
Earth Syst. Sci. 22(2), 1411–1435 (2018).
36. Shukla, A. K. et al. Population growth, land use and land cover transformations, and water quality nexus in the Upper Ganga River basin.
Hydrol. Earth Syst. Sci. 22(9), 4745–4770 (2018).
37. Swarnkar, S., Malini, A., Tripathi, S. & Sinha, R. Assessment of uncertainties in soil erosion and sediment yield estimates at ungauged
basins: An application to the Garra River basin, India. Hydrol. Earth Syst. Sci. 22(4), 2471–2485 (2018).
38. Sinha, R. et al. Basin-scale hydrology and sediment dynamics of the Kosi river in the Himalayan foreland. J. Hydrol. 570, 156–166 (2019).
39. Swarnkar, S., Tripathi, S. & Sinha, R. Understanding hydrogeomorphic and climatic controls on soil erosion and sediment dynamics in
large Himalayan basins. Sci. Total Environ. 795, 148972 (2021).
40. Dubey, S. & Goyal, M. K. Glacial lake outburst flood hazard, downstream impact, and risk over the Indian Himalayas. Water Resour. Res.
56(4), e2019WR026533 (2020).
41. Boral, S., Sen, I. S., Tripathi, A., Sharma, B. & Dhar, S. Tracking dissolved trace and heavy metals in the Ganga River from source to sink:
A baseline to judge future changes. Geochem. Geophys. Geosyst. 21(10), e2020GC009203 (2020).
42. Santy, S., Mujumdar, P. & Bala, G. Potential impacts of climate and land use change on the water quality of Ganga River around the indus-
trialized Kanpur region. Sci. Rep. 10(1), 1–13 (2020).
43. Boral, S., Sen, I. S., Ghosal, D., Peucker-Ehrenbrink, B. & Hemingway, J. D. Stable water isotope modeling reveals spatio-temporal variability
of glacier meltwater contributions to Ganges River headwaters. J. Hydrol. 577, 123983 (2019).
44. Zarfl, C., Lumsdon, A. E., Berlekamp, J., Tydecks, L. & Tockner, K. A global boom in hydropower dam construction. Aquat. Sci. 77(1),
161–170 (2015).
45. Gumbel, E. J. The return period of flood flows. Ann. Math. Stat. 12(2), 163–190 (1941).
46. CWC. National Register of Large Dams (Central Water Commission, 2018).
47. Shugar, D. H. et al. A massive rock and ice avalanche caused the 2021 disaster at Chamoli, Indian Himalaya. Science 373, 300–306 (2021).
48. Smith, N. D., Morozova, G. S., Pérez-Arlucea, M. & Gibling, M. R. Dam-induced and natural channel changes in the Saskatchewan River
below the EB Campbell Dam, Canada. Geomorphology 269, 186–202 (2016).
49. Warrick, J. A. et al. World’s largest dam removal reverses coastal erosion. Sci. Rep. 9(1), 1–12 (2019).
50. Ritchie, A. C. et al. Morphodynamic evolution following sediment release from the world’s largest dam removal. Sci. Rep. 8(1), 1–13 (2018).
51. Zhou, Y. et al. Impacts of Three Gorges Reservoir on the sedimentation regimes in the downstream-linked two largest Chinese freshwater
lakes. Sci. Rep. 6(1), 1–10 (2016).
Acknowledgements
The first author acknowledges the National Postdoctoral Fellowship (NPDF) grant (PDF/2020/000496) received from the
Science and Engineering Research Board (SERB), Department of Science and Technology (DST), Government of India.
The second author acknowledges the support received through the JC Bose Fellowship (Number, JCB/2018/000031).
The funding received from the Ministry of Earth Sciences (MoES), Government of India, through the project, “Advanced
Research in Hydrology and Knowledge Dissemination”, Project No.: MOES/PAMC/H&C/41/2013-PC-II, is gratefully
acknowledged. We also acknowledge the India Meteorological Department (IMD) for the high-resolution daily gridded
rainfall & temperature datasets and Central Water Commission (CWC) for the daily discharge & sediment datasets
provided for this work.
Author contributions
S.S. analysed the hydrological records, applied the hydrological analysis and prepared the first draft of the manuscript,
including figures. P.M. conceptualised the hydrological analysis, reviewed and edited the manuscript. R.S. helped to
develop the hydrological analysis, reviewed and edited the manuscript.
Competing interests
The authors declare no competing interests.
Additional information
Supplementary Information The online version contains supplementary material available at https://doi.org/10.1038/
s41598-021-98827-7.
Correspondence and requests for materials should be addressed to P.M.
Reprints and permissions information is available at www.nature.com/reprints.
Publisher’s note Springer Nature remains neutral with regard to jurisdictional claims in published maps and
institutional affiliations.
Open Access This article is licensed under a Creative Commons Attribution 4.0 International
License, which permits use, sharing, adaptation, distribution and reproduction in any medium or
format, as long as you give appropriate credit to the original author(s) and the source, provide a link to the
Creative Commons licence, and indicate if changes were made. The images or other third party material in this
article are included in the article’s Creative Commons licence, unless indicated otherwise in a credit line to the
material. If material is not included in the article’s Creative Commons licence and your intended use is not
permitted by statutory regulation or exceeds the permitted use, you will need to obtain permission directly from
the copyright holder. To view a copy of this licence, visit http://creativecommons.org/licenses/by/4.0/.
© The Author(s) 2021
Scientific Reports | (2021) 11:19491 | https://doi.org/10.1038/s41598-021-98827-7 11
Vol.:(0123456789)You can also read