Regional seasonality of fire size and fire weather conditions across Australia's northern savanna
←
→
Page content transcription
If your browser does not render page correctly, please read the page content below
CSIRO PUBLISHING

International Journal of Wildland Fire 2020, 29, 1–10
https://doi.org/10.1071/WF19031

     Regional seasonality of fire size and fire weather conditions
     across Australia’s northern savanna

     Justin J. Perry A,E, Garry D. Cook B, Erin Graham C, C. P. (Mick) Meyer B,
     Helen T. Murphy D and Jeremy VanDerWal C
     A
       CSIRO, PMB PO Aitkenvale, Qld 4814, Australia.
     B
       CSIRO, PMB 44, Winnellie, NT 0822, Australia.
     C
       Centre for Tropical Biodiversity and Climate Change, James Cook University, Townsville,
       Qld 4811, Australia.
     D
       CSIRO, PO Box 780, Atherton, Qld 4883, Australia.
     E
       Corresponding author. Email: justin.perry@csiro.au

     Abstract. Australia’s northern savannas have among the highest fire frequencies in the world. The climate is monsoonal,
     with a long, dry season of up to 9 months, during which most fires occur. The Australian Government’s Emissions
     Reduction Fund allows land managers to generate carbon credits by abating the direct emissions of CO2 equivalent gases
     via prescribed burning that shifts the fire regime from predominantly large, high-intensity late dry season fires to a more
     benign, early dry season fire regime. However, the Australian savannas are vast and there is significant variation in weather
     conditions and seasonality, which is likely to result in spatial and temporal variations in the commencement and length of
     late dry season conditions. Here, we assess the temporal and spatial consistency of the commencement of late dry season
     conditions, defined as those months that maximise fire size and where the most extreme fire weather conditions exist. The
     results demonstrate that significant yearly, seasonal and spatial variations in fire size and fire weather conditions exist,
     both within and between bioregions. The effective start of late dry season conditions, as defined by those months that
     maximise fire size and where the most extreme fire weather variables exist, is variable across the savannas.

     Additional keywords: burning, carbon farming, fire management.

     Received 10 March 2019, accepted 23 September 2019, published online 31 October 2019

Introduction                                                         trace gases’ and showed that the release of GHG from individual
The savannas of northern Australia cover over 2 million km2 and      fires was substantially higher in late rather than in early dry
have very low human population density, limited infrastructure       season fires (Cook 2003). With further development (Russell-
and relatively intact natural ecosystems (Woinarski et al. 2007).    Smith et al. 2003; Russell-Smith et al. 2009a), this approach was
This region has a monsoonal climate, with an intense wet season      successfully piloted in the Western Arnhem Land Fire Abate-
followed by a long, warm dry season of 6–9 months that is            ment project (Fig. 1) (Russell-Smith et al. 2013) and led to the
typically rain-free and highly fire-prone (Cook and Heerdegen        development of GHG mitigation methodologies (Common-
2001). Fire frequency across the Australian savannas is among        wealth of Australia 2012, 2015, 2018) that are now being applied
the highest in the world (Andersen et al. 2005; Russell-Smith        and advocated across northern Australia’s savannas. These
et al. 2007).                                                        methodologies are part of Australia’s emissions reduction
    Much of the scientific literature considers fire behaviour in    strategy and provide tradable carbon credits.
northern Australia to be qualitatively different in the early dry        The bulk of the research underpinning the methodologies was
season compared with the late dry season (Andersen et al. 1998;      conducted in Kakadu National Park (Hurst et al. 1994; Cook
Russell-Smith et al. 2007). Breaking fire behaviour into tempo-      2003) and the adjoining Western Arnhem Land (Fig. 1) (Russell-
ral classes (namely, early dry season (EDS) and late dry season      Smith and Edwards 2006; Russell-Smith et al. 2009b). Although
(LDS)) facilitates accounting of smoke emissions, including          additional fuel load and emissions measurements have been
greenhouse gases, and has become embedded into the scientific        undertaken across northern Australia (Meyer et al. 2015; Yates
thinking. This can be seen in the national greenhouse gas (GHG)      et al. 2015), there has been no explicit testing of the assumption
accounting methodologies in the National Inventory Report            that the categorisation of fires into either low-intensity early or
(National Greenhouse Gas Inventory Committee 2007; Meyer             high-intensity late classes applies in all years across this region or
et al. 2015). Cook et al. (1995) argued that ‘maintaining a          of the assumption that a consistent date distinguishing the two
regime of frequent but low intensity and patchy fires is probably    categories applies across the whole region. Currently, the 2015
the best practical way to minimise the release of undesirable        Emissions Reduction Fund (ERF) Savanna Fire Management

Journal Compilation Ó IAWF 2020 Open Access CC BY-NC-ND                                                www.publish.csiro.au/journals/ijwf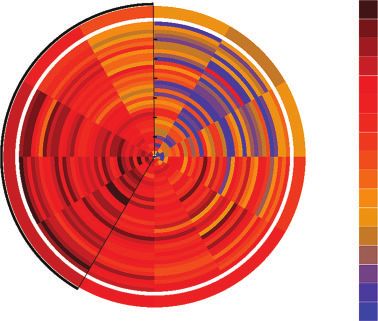
2      Int. J. Wildland Fire                                                                                                       J. J. Perry et al.

                                                                               annual rainfall) in Western Australia (Northern Kimberly), the
                                                                               Northern Territory (Arnhem Coast) and Queensland (Cape York
 –12                                                                           Peninsula) and three from the low rainfall zone (600–1000 mm
                                                                               mean annual rainfall) in Western Australia (Central Kimberly), the
                                                                               Northern Territory (Sturt Plateau) and Queensland (Gulf Plains).
 –16
                                                                               Seasonal changes in fire size
 –20                                                                           The longest continuous time series of fire activity in Australia is
                                                                               produced by Landgate (www.landgate.wa.gov.au, accessed 16
                                                                               February 2017). The time series extends from January 1988 to
                         130                  140                  150         the present, at a time resolution of 1 month and a spatial reso-
                                                                               lution of 1 km2. The product is derived from the National
Fig. 1. The study area, including high (light blue) and low (darker blue)      Oceanic and Atmospheric Administration’s Advanced Very
rainfall areas and boundaries of the Kakadu National Park (left red polygon)   High-Resolution Radiometer (NOAA AVHRR) imagery and
and West Arnhem Land Fire Abatement project (right red polygon).               fire scars are identified from reflectance changes between suc-
                                                                               cessive 10-day image pairs. This is the dataset that provides the
                                                                               activity data for Australia’s National Inventory Reports to the
Determination defines the EDS as ending on 31 July and the LDS                 United Nations Framework Convention on Climate Change.
starting on 1 August and ending on 31 December across the entire                   Fire-affected areas are defined as fire scar polygons. Landgate-
eligible area of the Australian tropical savanna.                              derived fire scars provide the spatial location of the fire-affected
    To address the question of whether two classes of fires are                area, which month the fire occurred in and the size of the fire scar
adequate, we need to examine spatial and temporal variations in                in that month. Landgate monthly fire scar vector files (shapefiles)
both the drivers of fire behaviour and the measurable statistics               were intersected with the polygons defining the Interim Biogeo-
describing fire occurrence. Fire characteristics change through                graphic Regionalisation for Australia (IBRA) bioregions. After
the dry season. These changes include the drivers of fire behav-               removing artefact sliver polygons less than 100 ha in area, the
iour (e.g. the severity of fire weather, fuel curing and fuel load),           monthly shapefiles were merged into a continuous time series
the properties of fires (e.g. the rate of fire spread, Byram fire line         from 1988 to 2015. The attribute table was then combined by a
intensity, fire radiative power) and the combustion processes (e.g.            spatial join with that of the vegetation layer used in the National
fuel burning efficiency). Fire size and fire patchiness are emer-              Inventory Report and the ERF tool, SAVBAT 2, to identify all fire
gent properties from the combined effects of these characteristics.            polygons falling partly or completely within the savanna wood-
Most fire characteristics have not been measured at the subconti-              land region of northern Australia as defined in the 2015 ERF
nental and multi-year scales required for an exploration of the                methodology (Commonwealth of Australia 2015).
spatial and temporal variations in fires across northern Australia.                Fire size accumulation plots were derived for representative
However, two datasets are available at appropriate scales to                   high and low rainfall bioregions by adding total burnt area (km2:
address this question: the Canadian Fire Weather Index (FWI)                   1988–2015) for each month and bioregion. Using this method,
(Field et al. 2015) and the 30-year Landgate fire area product. The            the length of the line in each month illustrated the quantum of
FWI provides an index of potential fire weather and the Landgate               area burnt in all years, reflecting both the number of fires and the
data provide a measure of realised fire activity.                              area burnt. Bioregions that follow the seasonal patterns pre-
    Where a landscape is continuously vegetated and not dis-                   scribed in the savanna burning methodology (2015) displayed
sected by human activity, fires should be limited by fire weather              the largest accumulation of fire area (longest lines) between
rather than by artificial landscape barriers. Northern Australia,              August and December.
with its extremely low human population density for the tropical
savanna biome (Woinarski and Dawson 2002), is an ideal                         Fire Weather Index
location to examine the relationship between fire weather and                  The Canadian FWI has been derived globally, based on for-
fire size. In this study we assessed seasonal changes in fire                  mulae set out by Van Wagner (1987). The FWI is particularly
weather indices and fire size across six northern Australian                   pertinent for this study because it is derived using variables that
(Interim Biogeographic Regionalisation of Australia: IBRA)                     aim to represent the peak daily intensity of a fire and reflects the
bioregions over the past 28 years. We examined the spatial and                 energy output rate per unit length of fire front. Therefore, if a
temporal patterns of fire activity in the EDS and LDS across the               strong relationship exists between fire size (i.e. reflecting real-
low rainfall zone (600–1000 mm annual rainfall) and the high                   ised fire spread) and increasing FWI, then the higher FWI value
rainfall zone (.1000 mm) covered by the 2015 ERF Savanna                       should also reflect increased intensity, which in turn has been
Fire Management Determination.                                                 directly correlated with decreased patchiness (Dowdy et al.
                                                                               2009). A linear regression was used to assess the relationship
Methods                                                                        between mean monthly FWI and mean fire size for each bio-
We present a comparison of six representative bioregions that                  region. We expected weaker relationships between fire weather
reflect the variation in weather across the study area and the                 and fire size in areas with the higher interannual variation.
associated variation in the relationship between the FWI and fire              We averaged our FWI and fire size values for each month over
size (Fig. 2): three from the high rainfall zone (.1000 mm mean                28 years because this best reflects the methods used to define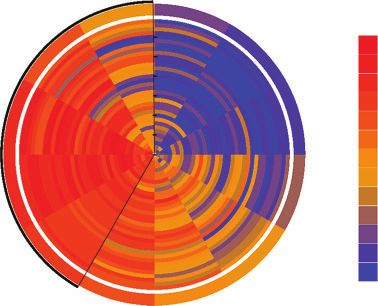
Seasonality of fire weather and fire size                                                                                                Int. J. Wildland Fire   3

       (a)                                                                          (b)

      –12                                                                          –12

      –16                                                                          –16

      –20                                                                          –20
                Northern Kimberley                                                          Central Kimberley

                           130                    140                  150                                 130                     140                 150

       (c)                                                                          (d )

      –12                                                                          –12

      –16                                                                          –16

      –20                                                                          –20
               Arnhem Coast                                                                  Sturt Plateau

                            130                   140                   150                                130                     140                 150

       (e)                                                                          (f )

      –12                                                                          –12

      –16                                                                          –16

      –20                                                                          –20
               Cape York                                                                     Gulf Plains

                            130                   140                  150                                 130                 140                     150

                                  Fig. 2. (a, c, e) High rainfall regions and (b, d, f ) low rainfall regions in the study area.

the high and low rainfall regions in the savanna burning                               The FWI is derived using variables that relate to fire spread
methodology.                                                                       and fuel availability and combustibility. In simple terms,
   We also present a summary of the linear models for each of                      FWI ¼ initial spread index (ISI) þ buildup index (BUI).
the 28 years to demonstrate the influence of interannual varia-                    Weather variables used to estimate ISI and BUI are presented
tion in weather and report the mean, median and standard                           in Fig. 3. Global FWI values at a 0.5 degree resolution were
deviation of the R2 values across the 28 years. In low average                     downloaded from the global fire weather database (https://data.
annual rainfall regions we expected to record high interannual                     giss.nasa.gov/impacts/gfwed/, accessed 18 May 2016) and
variation in rainfall, which will influence fuel accumulation and                  clipped to the Australian continent. The values were then
fuel connectivity. Regions that exhibit consistent annual rainfall                 intersected with the 1-km standard grid used to extract other
seasonality are likely to have consistently stronger relationships                 values in the study area. To summarise FWI at the regional and
between fire weather and fire size and higher median R2 values.                    subregional scale, changes in FWI were extracted for each
We quantified the consistency of the strength of the linear                        representative high and low rainfall regions and presented in
relationship by reporting the number of years (n ¼ 28) where                       polar plots (Whickam 2009) derived in R (R Development Core
R2 exceeded 0.5. We also present a polar plot illustrating                         Team 2014). The FWI data used in these analyses were derived
monthly FWI values for each year to reflect the interannual                        from daily data by extracting the 70th percentile of FWI for each
variation in seasonal fire weather between representative high                     month in each region and sub-region using the quantile function
and low rainfall bioregions.                                                       in R (R Development Core Team 2014).
4 Int. J. Wildland Fire J. J. Perry et al.
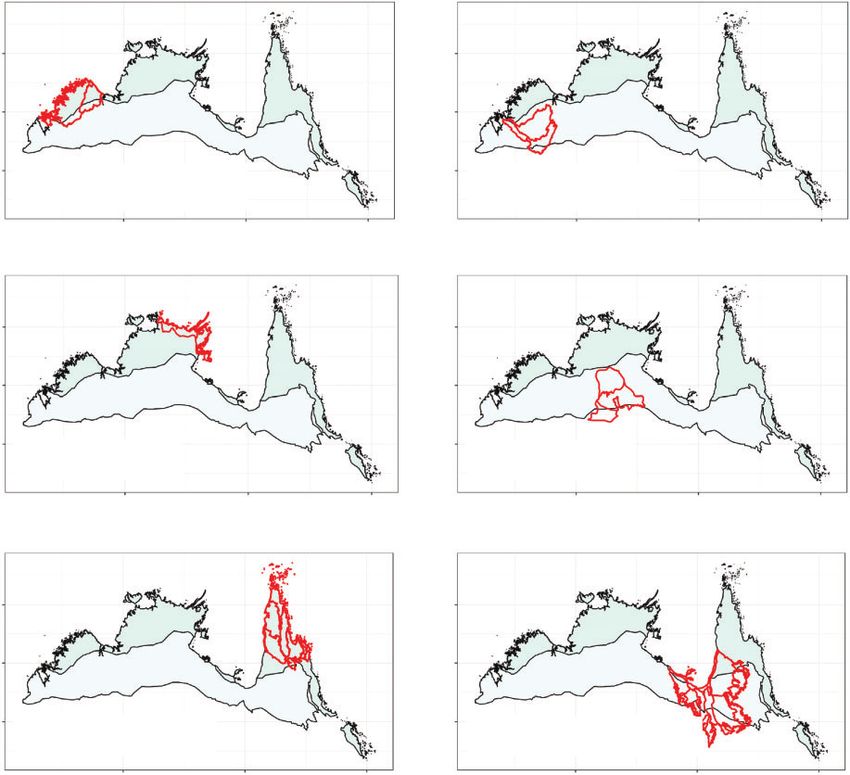
Fire weather Temperature, Wind Temperature, Temperature, rain
observations relative humidity, relative humidity,
wind, rain rain
Fuel moisture Fine Fuel moisture Duff Moisture Drought Code
codes Code (FFMC) Code (DMC) (DC)
Initial Spread Buildup Index
Index (ISI) (BUI)
Fire behaviour
indices
Fire Weather
Index (FWI)
Fig. 3. Components of the Fire Weather Index (FWI; Canadian Wildland Fire Information System http://cwfis.
cfs.nrcan.gc.ca/background/summary/fwi, accessed 7 July 2018).
In Australia the McArthur Forest Fire Danger Index (FFDI) Table 1. Comparison of commonly used fire danger ratings
(McArthur 1967) is widely used to forecast the influence of Comparing the McArthur Forest Fire Danger Index (FFDI), the Grassland
weather on fire behaviour and the Australian Bureau of Meteo- Fire Danger Index (GFDI) and the Canadian Fire Weather Index (FWI). FWI
rology issues forecasts of the Grassland and Forest Fire Danger ratings (used in this analysis) are presented with the analogous ratings for the
Index (GFDI and FFDI) for use by fire authorities. The FFDI and GFDI and FFDI methods commonly used in Australia
GFDI have an associated set of classification thresholds ranging
from low to extreme, as shown in Table 1. Dowdy et al. (2009) Fire danger rating FFDI range GFDI range FWI range
describes implementation of the FWI system over Australia using
Low 0–5 , 2.5 0–14
gridded numerical weather prediction model fields and an 8-year
Moderate 5–12 2.5–7.5 14–35
dataset of daily values. The FWI fields are compared with an High 12–24 7.5–20 35–64
equivalent set of FFDI fields (calculated from the same set of Very high 24–50 20–50 64–122
meteorological inputs). Classification thresholds of the FWI were Extreme . 50 . 50 .122
calculated based on those of the FFDI by matching percentiles of
the FWI to percentiles of FFDI throughout Australia. Thus, FWI
values over 64 are approximately equivalent to a very high fire
danger rating. In this study we assessed the month in which the fire size was maximised above a FWI value of 75. The FWI was
median 70th percentile of FWI values exceeded this level. consistently higher between August and October (Fig. 4c), with
the largest fires occurring between July and October (Fig. 4d).
Results Seasonality was very consistent across time, with 25 of the
Seasonal variation in fire size and FWI in the high rainfall 28 years exhibiting a strong relationship between fire size and
zone (.1000 mm year21) fire weather (median R2 of 0.72) (Table 2).
When aggregating to region, across years, there was a strong For the Cape York Peninsula bioregion there was a similar
relationship between the size of the largest fires (70th percentile) linear relationship to Arnhem Coast but not as strong (R2 ¼ 0.74)
and the mean monthly FWI (70th percentile) for bioregions in (Fig. 6b) and less consistent, with 19 of the 28 years above 0.5
the high rainfall zone (Figs 4, 5). and a lower median R2 value of 0.58 (Table 2). The FWI was
The cumulative fire size increased roughly linearly between consistently high (.60) between August and November
May and October in the Northern Kimberly bioregion (Fig. 4b). (Fig. 4e). The largest fires were observed between July and
There was a linear relationship between FWI and fire size in the November, with the greatest accumulation occurring from
Northern Kimberley (R2 ¼ 0.8) (Fig. 6b). The relationship September to November (Fig. 4f ).
between fire weather and fire size was relatively consistent
across 28 years, with 20 years above R2 of 0.5 and a median R2 Seasonal variation in the low rainfall zone (600–
value of 0.61 (Table 2). The FWI was consistently greater than 1000 mm year21)
60 between May and November (Fig. 4a). The seasonality in the low rainfall zone was less consistent than
For the Arnhem Coast bioregion, the 70th percentile of FWI in the high rainfall zone. For all three bioregions, the FWI reg-
for all months and fire sizes (70th percentile) were strongly ularly exceeded the very high fire danger threshold in April and
related (R2 ¼ 0.85) (Fig. 6a). The regression also illustrates that continued through to December (Fig. 5a, c, e).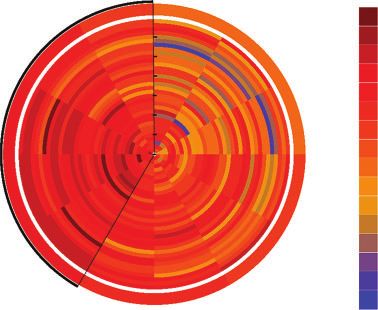
Seasonality of fire weather and fire size                                                                                                                   Int. J. Wildland Fire          5

(a)        Northern Kimberley                                                   (b)                                     Northern Kimberley
                                                                                                                    6
                                                                                                         1.2 × 10

      90                                                                                                      1 × 10⁶

                                                                                                              8 × 10⁵
      60
                                                                                                              6 × 10⁵

                                                                                                              4 × 10⁵
      30
                                                                                                              2 × 10⁵

       0                                                                                                           0
            01   02   03   04    05   06    07    08    09   10    11    12                                              01   02   03   04   05   06   07    08    09    10    11    12

(c)        Arnhem Coast                                                         (d )                                    Arnhem Coast
                                                                                                              6 × 10⁵

                                                                                 Cumulative fire size (km2)
      90

                                                                                                              4 × 10⁵
      60
FWI

                                                                                                              2 × 10⁵
      30

       0                                                                                                           0
            01   02   03   04    05   06    07    08    09   10    11    12                                              01   02   03   04   05   06   07     08    09    10    11    12

(e)        Cape York Peninsula                                                  (f )                                    Cape York Peninsula
                                                                                                         1.6 × 10⁶
                                                                                                         1.4 × 10⁶
      90
                                                                                                         1.2 × 10⁶
                                                                                                              1 × 10⁶
      60
                                                                                                              8 × 10⁵
                                                                                                              6 × 10⁵
      30
                                                                                                              4 × 10⁵
                                                                                                              2 × 10⁵
       0                                                                                                           0
            01   02   03   04    05   06    07    08    09   10    11    12                                              01   02   03   04   05   06   07    08    09    10    11    12
                                                                                              Month

Fig. 4. High rainfall bioregions. (a, c, e) Median and interquartile range of monthly 70th percentile Fire Weather Index (FWI). Solid horizontal line
indicates FWI threshold value for ‘Very High’ fire danger. (b, d, f) Cumulative fire size (km2) of all fires detected by Landgate for each month over 28 years.
Each tic label on the y-axis represents 200  103 km2. Dotted horizontal lines highlight the start and end of the late dry season as defined by the savanna
burning methodology.

    The Central Kimberly bioregion demonstrated a relatively                                    The Sturt Plateau showed a very weak relationship between
strong relationship between fire size and FWI (R2 ¼ 0.83)                                    FWI and mean fire size (R2 ¼ 0.33) (Fig. 6f), which was
(Fig. 6d) and displayed a similar relationship to the adjacent                               consistently low across the 28-year period (median R2 of 0.19)
high rainfall Northern Kimberly where FWI .40 predicted                                      and highly variable (standard deviation 0.18) (Table 2). Only 2 of
larger fires but did not express a linear relationship beyond                                the 28 years exceeded an R2 of 0.5 (Table 2). In this region FWI
FWI of ,60 (Fig. 6d). However, the relationship was weak                                     values below 50 restricted fire size and values above 80 max-
when considering interannual variation with a much lower                                     imised fire size, but between FWI 60 and 100 the residuals were
median R2 of 0.43, high standard deviation (0.23) and only 10                                very large (Fig. 6f). Slightly larger fires were observed between
of the 28 years above R2 0.5 (Table 2). Fire accumulation was                                May and August, but the majority of large fires occurred between
similar between April and November, with a reduction in fire-                                September and November (Fig. 5d). The FWI remained greater
affected areas in June and July (Fig. 5b). The FWI remained                                  then 60 for the entire year except for December (Fig. 5c).
high across the year and was mostly .60 between April and                                       The Gulf Plains bioregion had a weak linear relationship
November (Fig. 5a).                                                                          between FWI and fire size (R2 ¼ 0.39) (Fig. 6e) and a low median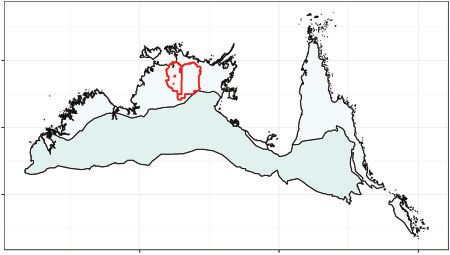
6           Int. J. Wildland Fire                                                                                                                                        J. J. Perry et al.

      (a)         Central Kimberley                                                                (b)                     Central Kimberley
            125
                                                                                                               1.4 × 10⁶

            100                                                                                                1.2 × 10⁶

                                                                                                               1.0 × 10⁶
             75
                                                                                                                8 × 10⁵

             50                                                                                                 6 × 10⁵

                                                                                                                4 × 10⁵
             25
                                                                                                                2 × 10⁵
              0                                                                                                       0
                    01   02     03   04   05   06   07   08   09   10   11   12                                             01   02   03   04   05   06   07   08   09    10    11    12

      (c)         Sturt Plateau                                                                    (d )                    Sturt Plateau
            125
                                                                                                               1.4 × 10⁶

                                                                                  Cumulative fire size (km2)
            100                                                                                                1.2 × 10⁶

                                                                                                               1.0 × 10⁶
             75
                                                                                                                8 × 10⁵
    FWI

             50                                                                                                 6 × 10⁵

                                                                                                                4 × 10⁵
             25
                                                                                                                2 × 10⁵
              0                                                                                                       0
                    01   02     03   04   05   06   07   08   09   10   11   12                                             01   02   03   04   05   06   07   08    09    10    11    12

      (e)         Gulf Plains                                                                      (f )                    Gulf Plains
            125
                                                                                                               1.4 × 10⁶

            100                                                                                                1.2 × 10⁶

                                                                                                               1.0 × 10⁶
             75
                                                                                                                8 × 10⁵

             50                                                                                                 6 × 10⁵

                                                                                                                4 × 10⁵
             25
                                                                                                                2 × 10⁵
              0                                                                                                       0
                   01    02     03   04   05   06   07   08   09   10   11   12                                             01   02   03   04   05   06   07   08   09    10    11    12
                                                                                  Month

Fig. 5. Low rainfall bioregions. (a, c, e) Median (70th percentile) and interquartile range of monthly fire size with each year shown as points. (b, d, f )
Cumulative fire size (km2) of all fires detected by Landgate for each month over 28 years. Each tic label on the y-axis represents 200  103 km2. Dotted
horizontal lines highlight the start and end of the late dry season as defined by the savanna burning methodology.

R2, 0.21, with a relatively high standard deviation (0.15) (Table 2).              zones was far less consistent across years, remaining high
A relatively strong relationship between FWI and fire size was                     throughout the nominal wet season period (January–March)
only recorded once in 28 years (Table 2). The FWI remained high                    (Fig. 7). The FWI and fire size had a strong relationship in the
(.60) for the entire year with an increasing fire-affected area                    Central Kimberly bioregion and this region demonstrated a far
evident from July to November (peaking in November, Fig. 5e, f ).                  more consistent seasonal pattern of low FWI between January
                                                                                   and March (Fig. 7d) when compared with the Gulf Plains, which
Temporal variation in the FWI                                                      did not have a consistent wet season across years (Fig. 7b).
The Arnhem Coast bioregion demonstrated the most consistent
seasonal pattern, with a distinct and dependable wet season                        Discussion
followed by a gradual increase in FWI from April, leading to                       We present an analysis of seasonality based on the fire weather
extreme fire weather between August and November, decreas-                         conditions that support large fires. The results demonstrated that
ing again in December (Fig. 7a). Cape York Peninsula followed                      significant seasonal variation in fire size and fire weather exists
a similar pattern; however, the FWI was more extreme in                            both within and between rainfall zones, and within and between
September (Fig. 7c). In contrast, the FWI in the low rainfall                      bioregions. In particular, the seasonality in both the FWI and fire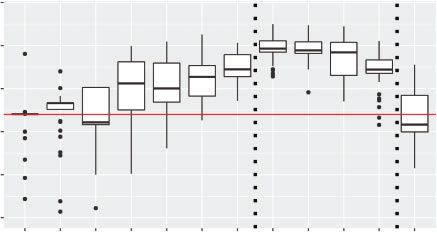
Seasonality of fire weather and fire size                                                                                                                         Int. J. Wildland Fire   7

                                                  High rainfall
                                                            Arnhem Coast                     Cape York Peninsula                        Northern Kimberley
                                           1500
                                                      y = –144 + 6.41 x R 2adj = 0.85       y = –141 + 12.7 x    R 2adj = 0.74        y = –59.6 + 7.98 x   R 2adj = 0.8

                                           1000

                                            500
                    Mean fire size (km2)

                                              0

                                                  0              50           100       0             50             100          0             50            100

                                                  Low rainfall
                                                          Central Kimberley                         Gulf Plains                              Sturt Plateau
                                           2500
                                                      y = –488 + 14.1 x R 2adj = 0.83       y = –1750 + 31.7 x    R 2adj = 0.39       y = –610 + 17.3 x R 2adj = 0.33

                                           2000

                                           1500

                                           1000

                                            500

                                              0

                                                  0              50           100       0             50             100          0             50            100
                                                                                                    Mean FWI

                   Fig. 6. Relationship between mean monthly Fire Weather Index (70th percentile) and mean monthly fire size
                   (70th percentile).

size in the low rainfall zone was less consistent than in the high                                        The strongest relationship between FWI and fire size was
rainfall zone. In addition, the very high fire danger period                                           observed in the Arnhem Coast bioregion where the annual
occurred over a longer period in the low rainfall zone (April–                                         variance in FWI was also relatively consistent in the LDS. In
December) compared with the high rainfall zone.                                                        this bioregion, the largest fires and highest FWI occurred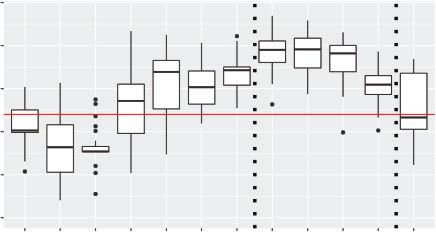
8     Int. J. Wildland Fire                                                                                                                  J. J. Perry et al.

Table 2. Summary of the relationship between large fires and the Fire Weather Index for each of the six northern Australian bioregions and for
                                                                 each year (1988–2015)
Presenting the mean (Mean R2), standard deviation (s.d. R2) and median (Median R2) R2 values for annual linear regressions (n ¼ 28) comparing the
 relationship between the Fire Weather Index and fire size. Also reporting the number of years where the R2 value was greater than 0.5 (Years R2 . 0.5)

Bioregion                                   Mean R2                                  s.d. R2                   Median R2                      Years R2 . 0.5

Sturt Plateau                                  0.21                                   0.18                       0.19                                 2
Central Kimberly                               0.41                                   0.23                       0.43                                10
Gulf Plains                                    0.24                                   0.15                       0.21                                 1
Arnhem Coast                                   0.69                                   0.13                       0.72                                25
Cape York Peninsula                            0.54                                   0.21                       0.58                                19
Northern Kimberly                              0.56                                   0.18                       0.61                                20

    (a)                             Jan                                                 (b)                        Jan
                       Dec                        Feb                  FWI                               Dec                  Feb                  FWI
                                                                             105 +                                                                       105 +

    2011                                                                     105        2011                                                             105

    2006                                                                     98         2006                                                             98
               Nov                                         Mar               91                    Nov                                 Mar               91
    2001                                                                                2001
                                                                             84                                                                          84
    1996                                                                                1996
                                                                             77                                                                          77
    1991                                                                                1991
                                                                             70                                                                          70
    1986                                                                                1986
                                                                             63                                                                          63
    1981 Oct                                                     Apr                    1981 Oct                                             Apr
                                                                             56                                                                          56
                                                                             49                                                                          49
                                                                             42                                                                          42
                                                                             35                                                                          35

               Sep                                         May               28                    Sep                                 May               28
                                                                             21                                                                          21
                                                                             14                                                                          14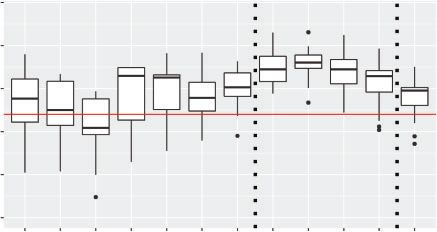
Seasonality of fire weather and fire size                                                                                Int. J. Wildland Fire       9

    The relationship between FWI and fire size in the Northern          and high rainfall zones. However, validation of these assump-
Kimberly was slightly weaker than in the Cape York Peninsula            tions will require field testing of the relationships between fire
and the Arnhem Coast and the fire season started abruptly in            size, intensity and patchiness across the climatic and edaphic
April–May in most years. The difference between the EDS and             variance in the study area.
LDS was minimal, with the data indicating that large fires
occurred across most of the year. In the low rainfall zone, the         Conclusions
Central Kimberly bioregion is adjacent to the high rainfall
                                                                        The savanna-wide characterisation of low-intensity early and
Northern Kimberly bioregion and showed a similar pattern in
                                                                        high-intensity late dry season fires is ambiguous. The charac-
fire seasonality with a relatively early start to the fire season. In
                                                                        terisation is clearer in the higher-rainfall bioregions of the
the Central Kimberley, the relationship between FWI and fire
                                                                        savannas where temporal and spatial seasonal variability between
size was high, which is anomalous for the low rainfall bioregion.
                                                                        years is low. Lower rainfall areas exhibit weaker seasonal pat-
This is likely to be related to the prevalence of cyclone-driven
                                                                        terns in fire size and fire weather and higher spatial and temporal
rain events that are common in this region (Charles et al. 2015),
                                                                        variability. The temporal and spatial variations in the com-
evidenced in this study through consistently low FWI values
                                                                        mencement and length of LDS conditions within and between the
during the wet season months.
                                                                        six bioregions presented here and at a subregional level (https://
    The poor relationship between the FWI and fire size in the
                                                                        publications.csiro.au/rpr/pub?list¼SEA&pid¼csiro:EP186538,
Sturt Plateau suggested that this bioregion does not demonstrate
                                                                        accessed 1 July 2019) suggests that the step change in burning
strong seasonal changes in fire size across time. Similarly,
                                                                        efficiency and patchiness assumed by the ERF methodology
although the relationship was stronger in the Gulf Plains, the
                                                                        between the EDS and LDS and between the high and low rainfall
distinction between the wet season, EDS and LDS was less clear
                                                                        zones, requires further assessment to provide a more realistic
than in the high rainfall zone.
                                                                        approach to assessing changes in emissions.
    The results demonstrated that the effective start of LDS
conditions, as defined by those months that maximise fire size
and where the most extreme fire weather variables exist, varied         Conflicts of interest
across the savannas depending on the annual consistency of fire         The authors declare no conflicts of interest.
weather indices. This has implications for the adequacy of
carbon accounting and a potential effect on biodiversity conser-        Acknowledgements
vation where fire management activities are based on the EDS
                                                                        This research was funded by the Australian Government, Department of the
and LDS definitions in the methodology rather than the realised         Environment and Energy, through the Emissions Reduction Fund. Allan
regional seasonality.                                                   Spessa provided value feedback in the early stages of this study that helped to
    We used fire size as a proxy for fire intensity and uniformity      refine the analytical pathway.
on the assumption that larger fires indicate a more connected
landscape and more complete combustion. For a fire to leave             References
unburnt patches the fire has to be extinguished. This could
                                                                        Andersen AN, Braithwaite RW, Cook GD, Corbett LK, Williams RJ,
happen because the fuel load is uneven and too low in some                 Douglas MM, Gill AM, Setterfield SA, Muller WJ (1998) Fire research
patches for the vegetation to support a fire. If fuels are discon-         for conservation management in tropical savannas: introducing the
tinuous, such as in a spinifex grassland, gaps between fuel                Kapalga fire experiment. Australian Journal of Ecology 23, 95–110.
patches might be too large for the fire to preheat adjacent                doi:10.1111/J.1442-9993.1998.TB00708.X
unburnt fuels to ignition (Cheney and Sullivan 1997). Extinction        Andersen AN, Cook GD, Corbett LK, Douglas MM, Eager RW, Russell-
of the fire in patches could also occur if fuel moisture or grass          Smith J, Setterfield SA, Williams RJ, Woinarski JCZ (2005) Fire
curing is patchy, because fuel moisture is one of the factors              frequency and biodiversity conservation in Australian tropical savannas:
determining rate of heat release. It is particularly important in          implications from the Kapalga fire experiment. Austral Ecology 30,
                                                                           155–167. doi:10.1111/J.1442-9993.2005.01441.X
grasslands where senescence and curing are a feature of grass
                                                                        Charles S, Fu G, McFarlane D, Hodgson G, Teng J, Barron O, Aryal S, Dawes
phenology; when fuel moisture content values exceed ,20% of
                                                                           W (2015) Hydroclimate of the Pilbara: past, present and future. A report to
fuel dry weight, combustion is unsustainable and fires are                 the Government of Western Australia and industry partners from the
unlikely to spread (Cheney et al. 1998). This occurs when grass            CSIRO Pilbara Water Resource Assessment. CSIRO Land and Water,
swards are less than 50% cured; where fuel characteristics are             Australia. Available at https://publications.csiro.au/rpr/download?pid=
non-uniform, patches of uncured grass or moist fuel lead to                csiro:EP157752&dsid=DS2 [Verified 10 October 2019].
unburnt patches.                                                        Cheney P, Sullivan A (1997) ‘Grassfires: fuel, weather and fire behaviour.’
    Heterogeneity of grass curing (and hence fuel moisture) also           (CSIRO Publishing: Melbourne)
leads to decreases in the maximum rate of fire spread (Hilton           Cheney N, Gould J, Catchpole W (1998) Prediction of fire spread in
2015), as slower moving fires are more likely to extinguish and            grasslands. International Journal of Wildland Fire 8, 1–13. doi:10.
                                                                           1071/WF9980001
patchy fires tend to be small fires. Uniform fires, by contrast, can
                                                                        Commonwealth of Australia. (2012) Carbon Farming (Reduction of
continue to expand for long periods and leave large scars. Hence
                                                                           Greenhouse Gas Emissions through Early Dry Season Savanna
fire size should be an indicator of fire intensity and a seasonal          Burning) Methodology Determination 2012. Federal Register of Leg-
progression of mean fire size might be a useful indicator of the           islative Instruments F2012L01499: 37. Commonwealth of Australia,
seasonal transition in fire behaviour. Under these assumptions,            Canberra.
the LDS, as defined in the carbon abatement methodology, is not         Commonwealth of Australia (2015) Carbon Credits (Carbon Farming
consistent across bioregions and particularly between the low              Initiative—Emissions Abatement through Savanna Fire Management)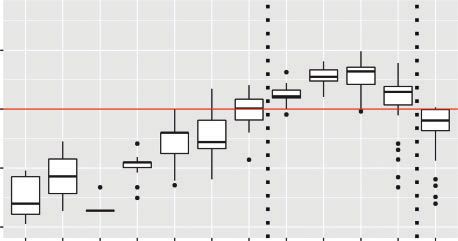
10     Int. J. Wildland Fire                                                                                                              J. J. Perry et al.

    Methodology Determination 2015. Federal Register of Legislative            Russell-Smith J, Edwards AC (2006) Seasonality and fire severity in
    Instruments F2015L00344: 40. Commonwealth of Australia, Canberra.             savanna landscapes of monsoonal northern Australia. International
Commonwealth of Australia (2018) Carbon Credits (Carbon Farming                   Journal of Wildland Fire 15, 541–550. doi:10.1071/WF05111
    Initiative—Savanna Fire Management—Sequestration and Emissions             Russell-Smith J, Edwards AC, Cook GD (2003) Reliability of biomass
    Avoidance) Methodology Determination 2018. Authorised Version                 burning estimates from savanna fires: biomass burning in northern
    F2018L00562: 47. Commonwealth of Australia, Canberra.                         Australia during the 1999 Biomass Burning and Lightning Experiment
Cook GD (2003) Fuel dynamics, nutrients and atmospheric chemistry. In             B field campaign. Journal of Geophysical Research 108, 1–12. doi:10.
    ‘Fire in tropical savannas.’ (Eds AN Andersen, GD Cook, RJ Williams)          1029/2001JD000787
    pp. 47–58. (Springer: New York)                                            Russell-Smith J, Yates CP, Whitehead PJ, Smith R, Craig R, Allan GE,
Cook GD, Heerdegen RG (2001) Spatial variation in the duration of the             Thackway R, Frakes I, Cridland S, Meyer MCP, Gill AM (2007)
    rainy season in monsoonal Australia. International Journal of Climatol-       Bushfires ‘down under’: patterns and implications of contemporary
    ogy 21, 1723–1732. doi:10.1002/JOC.704                                        Australian landscape burning. International Journal of Wildland Fire
Cook GD, Hurst D, Griffith D (1995) Atmospheric trace gas emissions from          16, 361–377. doi:10.1071/WF07018
    tropical Australian savanna fires. CALMscience 4, 123–128.                 Russell-Smith J, Murphy BP, Meyer MCP, Cook GD, Maier S, Edwards
Dowdy AJ, Mills GA, Finkele K, De Groot WJ (2009) Australian fire                 AC, Schatz J, Brocklehurst P (2009a) Improving estimates of savanna
    weather as represented by the McArthur Forest Fire Danger Index and           burning emissions for greenhouse accounting in northern Australia:
    the Canadian Forest Fire Weather. CAWCR Technical Report 10. The              limitations, challenges, applications. International Journal of Wildland
    Centre for Australian Weather and Climate Research, Melbourne,                Fire 18, 1–18. doi:10.1071/WF08009
    Australia. Available at www.cawcr.gov.au/technical-reports/CTR_            Russell-Smith J, Whitehead P, Cooke P (2009b) ‘Culture, ecology and
    010.pdf [Verified 24 February 2017]                                           economy of fire management in north Australian savannas, rekindling
Field RD, Spessa AC, Aziz NA, Camia A, Cantin A, Carr R, de Groot WJ,             the Wurrk tradition.) (CSIRO Publishing: Melbourne)
    Dowdy AJ, Flannigan MD, Manomaiphiboon K, Pappenberger F,                  Russell-Smith J, Cook GD, Cooke PM, Edwards AC, Lendrum M, Meyer
    Tanpipat V, Wang X (2015) Development of a global fire weather                CP, Whitehead PJ (2013) Managing fire regimes in north Australian
    database. Natural Hazards and Earth System Sciences 15, 1407–1423.            savannas: applying Aboriginal approaches to contemporary global
    doi:10.5194/NHESS-15-1407-2015                                                problems. Frontiers in Ecology and the Environment 11, e55–e63.
Hilton JE (2015) Effects of spatial and temporal variation in environmental       doi:10.1890/120251
    conditions on simulation of wildfire spread. Environmental Modelling       Van Wagner CE (1987) ‘Development and structure of the Canadian Forest
    and Software 67, 118–127. doi:10.1016/J.ENVSOFT.2015.01.015                   Fire Weather Index System.’ (Canadian Forestry Service, Ottawa)
Hurst DF, Griffith DWT, Cook GD (1994) Trace gas emissions from                Whickam H (2009) ‘ggplot2: elegant graphics for data analysis.’ (Springer-
    biomass burning in tropical Australian savannas. Journal of Geophysical       Verlag: New York)
    Research 99, 16441–16456. doi:10.1029/94JD00670                            Woinarski JCZ, Dawson F (2002) Limitless lands and limited knowledge:
McArthur AG (1967) ‘Fire behaviour in eucalypt forests.’ (Forestry and            coping with uncertainty and ignorance in northern Australia. In ‘Ecology,
    Timber Bureau: Canberra)                                                      Uncertainty and Policy: managing ecosystems for sustainability.’ (Eds JW
Meyer CPM, Cook GD, Powell J (2015) Australia’s National Greenhouse               Handmer, TW Norton, SR Dovers) pp. 83–115. (Prentice-Hall: Harlow)
    Gas Inventory 2013: Agriculture. Final Report to the Department of the     Woinarski J, Mackey B, Nix H, Traill B (2007) ‘The nature of Northern
    Environment. (CSIRO Oceans and Atmosphere: Aspendale)                         Australia: natural values, ecological processes and future prospects.’
National Greenhouse Gas Inventory Committee (2007) ‘Australian method-            (ANU E Press: Canberra)
    ology for the estimation of greenhouse gas emissions and sinks 2006:       Yates C, Russell-Smith J, Murphy BP, Desailly M, Evans J, Legge S, Lewis
    Agriculture.’ (Department of Climate Change: Canberra)                        F, Lynch D, Edwards AC (2015) Fuel accumulation, consumption and
R Development Core Team (2014) ‘R: a language and environment for                 fire patchiness in the lower rainfall savanna region. In ‘Carbon account-
    statistical computing.’ (R Foundation for Statistical Computing: Vienna,      ing and savanna fire management.’ (Eds BP Murphy, AC Edwards, M
    Austria) Available at http://www.R-project.org/ [Verified 20 July 2019]       Meyer, J Russell-Smith) pp. 115–132. (CSIRO Publishing: Melbourne)

                                                           www.publish.csiro.au/journals/ijwf
You can also read