Seasonal climate summary for Australia and the southern hemisphere (summer 2018-19): extreme heat and flooding prominent

Page created by Miguel Olson
 
CONTINUE READING
Seasonal climate summary for Australia and the southern hemisphere (summer 2018-19): extreme heat and flooding prominent
CSIRO PUBLISHING

Journal of Southern Hemisphere Earth Systems Science
                                                                                                Seasonal Climate Summary
https://doi.org/10.1071/ES20009

     Seasonal climate summary for Australia and the southern
     hemisphere (summer 2018–19): extreme heat and flooding
     prominent

                            A,B
     Ben S. Hague
     A
       Bureau of Meteorology, GPO Box 1289, Melbourne, Vic. 3001, Australia.
       Email: ben.hague@bom.gov.au
     B
       Monash University, School of Earth, Atmosphere and Environment, Clayton, Vic., Australia.

     Abstract. This is a summary of the southern hemisphere atmospheric circulation patterns and meteorological indices for
     summer 2018–19; an account of seasonal rainfall and temperature for the Australian region is also provided. January 2019
     was Australia’s hottest month on record, nearly 18C warmer than any previous month. Impacts of heavy rain and floods
     were reported in Australia, New Zealand and South American nations. Extreme terrestrial and maritime heatwaves
     occurred in and around Australia and New Zealand. Case studies of the Australian heatwave, Queensland floods in January
     and February, and a tide-driven coastal inundation event are considered.

     Keywords: coastal inundation, extreme heat, flooding, heatwave, neutral ENSO season, positive OLR anomalies,
     summer 2018–19.

     Received 22 September 2020, accepted 27 December 2020, published online 2 February 2021

1 Introduction                                                        –7 this is often indicative of El Niño episodes, whereas
The Australian summer of 2018–19 was marked by widespread             persistently positive values of SOI above þ7 are typical of a
above-average temperature and punctuated by extreme heat and          La Niña episode. The 5VAR is a composite monthly ENSO
intense precipitation events in some areas. Here we summarise         index, calculated as the standardised amplitude of the first
the climatic setting, the key climate drivers and diagnostics used    principal component of the monthly Darwin and Tahiti mean
by the Bureau of Meteorology to characterise climate variability      sea level pressure (MSLP) and monthly indices NINO3,
in the Australian region. Further, we investigate these patterns in   NINO3.4 and NINO4 SSTs (Fig. 2b; Kuleshov et al. 2009).
the broader context of the southern hemisphere and summarise          Values of the 5VAR that are more than one standard deviation
key meteorological parameters such as rainfall and temperature.       are typically associated with El Niño for positive values, while
Finally, we identify some key extreme and noteworthy weather          negative 5VAR values of a similar magnitude are indicative of
and climate events of the austral summer of 2018–19. Unless           La Niña. Although both metrics have values close to the El Niño
otherwise stated, the main sources of information are analyses        thresholds neither exceed it, meaning the summer of 2018–19 is
prepared by, or derived from datasets curated by, the Australian      classified as a neutral ENSO season.
Bureau of Meteorology.                                                    The IOD is said to be in a positive phase when values of the
                                                                      DMI (Fig. 2c) are greater than 0.48C, neutral when the DMI is
2 Climatic setting – drivers and diagnostics                          sustained between –0.48C and 0.48C and negative when DMI
In the southern hemisphere, the months of December 2018,              values are less than –0.48C. The influence of the IOD on
January 2019 and February 2019 were not characterised by the          Australian climate is typically weak during December to April.
influence of any specific climate drivers, with the El Niño          This is due to the monsoon trough shifting south over the tropical
Southern Oscillation (ENSO), Indian Ocean Dipole (IOD) and            Indian Ocean and changing the overall wind circulation, which
Southern Annular Mode (SAM) all taking values within the              in turn prevents an IOD ocean temperature pattern from being
typical ranges (e.g. one standard deviation) of their respective      able to form. This was true of summer 2018–19, classified as an
indices, as shown in sea-surface temperature (SST) patterns           IOD neutral season.
in Fig. 1.                                                                The Madden–Julian Oscillation (MJO) is a tropical convec-
    Fig. 2 shows representative values of the Southern Oscilla-       tive wave anomaly which develops in the Indian Ocean and
tion Index (SOI), ENSO 5VAR Index (5VAR) and Dipole Mode              propagates eastwards into the Pacific Ocean (Madden and Julian
Index (DMI) in the context of preceding seasons. If the Troup         1971, 1972, 1994). The MJO takes approximately 30 to 60 days
(1965) SOI (Fig. 2a) has sustained negative values of SOI below       to reach the western Pacific, with a frequency of six to twelve

Journal compilation  BoM 2021 Open Access CC BY-NC-ND                                                  www.publish.csiro.au/journals/es
Seasonal climate summary for Australia and the southern hemisphere (summer 2018-19): extreme heat and flooding prominent
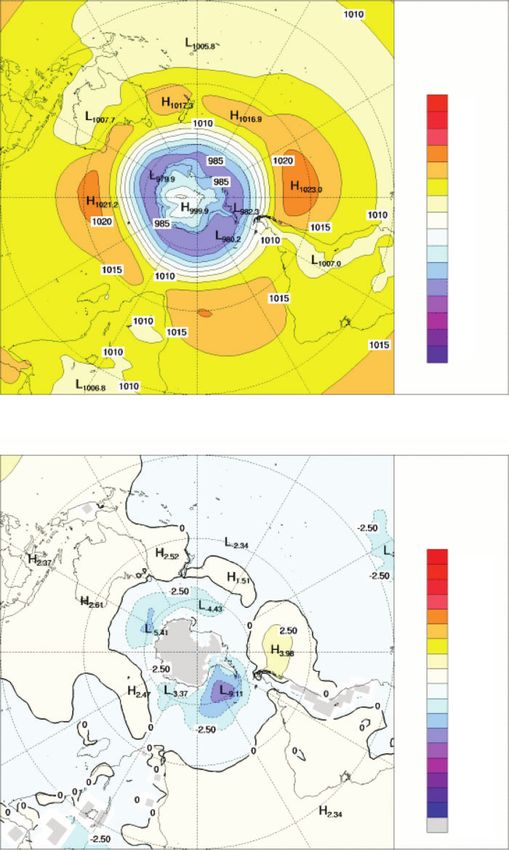
B    Journal of Southern Hemisphere Earth Systems Science                                                                            B. S. Hague

             (a)

                                                                                                                        SSTA (°C)
             (b)
                                                                                                                             4.0

                                                                                                                             3.0

                                                                                                                             2.0

                                                                                                                             1.0

                                                                                                                             0.5

                                                                                                                             –0.5

                                                                                                                             –1.0

                                                                                                                             –2.0

                                                                                                                             –3.0
             (c)
                                                                                                                             –4.0

             Fig. 1. Sea-surface temperature analyses by the Bureau of Meteorology for (a) December 2018, (b) January 2019 and (c)
             February 2019.

events per year (Donald et al. 2004). When the MJO is in an               was active in these phases during late-December, early-
active phase, it is associated with areas of increased and                January and again in late-January.
decreased tropical convection, with effects on the southern                  Outgoing longwave radiation (OLR) in the equatorial Pacific
hemisphere often weakening during early autumn, before                    Ocean can be used as an indicator of enhanced or suppressed
transitioning to the northern hemisphere. The diagnostic used             tropical convection. Increased positive OLR anomalies typify a
operationally by the Bureau of Meteorology to identify the                regime of reduced convective activity, a reduction in cloudiness
phase of the MJO is the Real-time Multivariate MJO index                  and, usually, rainfall. Conversely, negative OLR anomalies
(RMM, Wheeler and Hendon 2004). An MJO event in a specific                indicate enhanced convection, increased cloudiness and chances
phase occurs when the line moves outside the central circle and           of increased rainfall. During La Niña, decreased convection
into the octant corresponding with that phase. The RMM                    (increased OLR) can be seen near the Date Line, whereas
diagrams for October–December 2018 and January–March                      increased cloudiness (decreased OLR) near the Date Line
2019 are shown in Fig. 3. During December to February, MJO                usually occurs during El Niño. Similarly, when Australia is
phases five and six typically correspond with wetter-than-                under the influence of a negative IOD event, OLR anomalies are
average conditions across northern Australia, and the MJO                 negative over the eastern Indian Ocean where increased
Seasonal climate summary for Australia and the southern hemisphere (summer 2018-19): extreme heat and flooding prominent
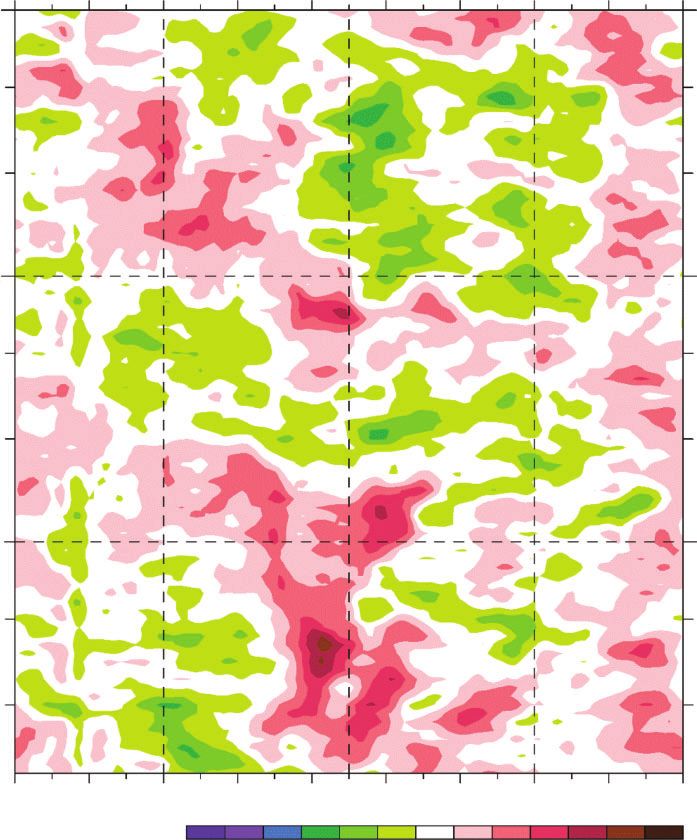
Seasonal Climate Summary: summer 2018–19                                                                                                                Journal of Southern Hemisphere Earth Systems Science                         C

        (a)                               30

                                          20

                                          10

                                           0
         SOI

                            –10

                            –20

                            –30

                            –40
                                                199            199        199           199        199           200       200           200           200         200      201        201           201     201       201
                                                       0            2              4          6          8            0             2          4             6          8         0          2          4          6         8
                                                                                                                                        Year

        (b)                           3

                                      2

                                     1
         5VAR

                                     0

                         –1

                         –2

                         –3
                                               199         199           199           199        199          200        200           200            200        200       201       201         201       201        201
                                                   0            2              4          6          8            0          2             4              6             8      0         2             4          6       8
                                                                                                                                        Year

        (c)
                                           1.5
                Dipole mode index (DMI)

                                               1

                                           0.5

                                               0

                                          –0.5

                                           –1

                                          –1.5
                                                     200                201             201              201              201             201                    201        201             201             201         201
                                                           9               0                  1              2                  3                  4                5             6              7             8                 9
                                                                                                                                        Year

        Fig. 2. Time series of (a) SOI, (b) 5VAR and (c) DMI, placing the values of these diagnostic indicators in a longer-term context. SOI is
        plotted with monthly values and accompanying five-month weighted averaging (6 for central month, 4 for months one offset from central
        month and 1 for months two offset from central month), with red horizontal line indicating the El Niño threshold and the blue horizontal
        line indicating the La Niña threshold. 5VAR is plotted with monthly values and accompanying three-month averages with red horizontal
        line indicating the El Niño threshold and the blue horizontal line indicating the La Niña threshold. DMI is plotted with weekly values and
        accompanying five-week moving mean with red horizontal line indicating the positive IOD threshold and the blue horizontal line
        indicating the negative IOD threshold. Plots provided by Bureau of Meteorology.
Seasonal climate summary for Australia and the southern hemisphere (summer 2018-19): extreme heat and flooding prominent
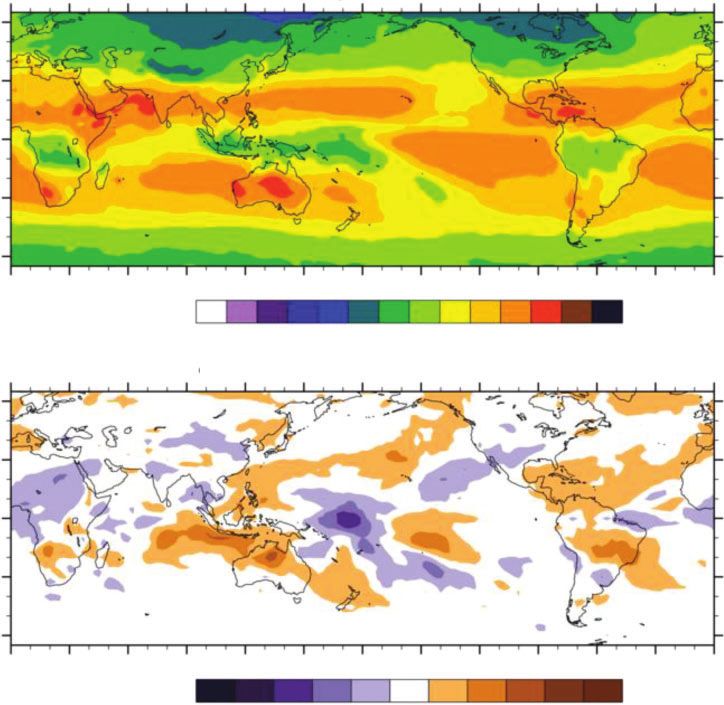
D          Journal of Southern Hemisphere Earth Systems Science                                                                                                              B. S. Hague

                (a)                                                                                           (b)
            (RMM1, RMM2) phase space for 1-Oct-2018 to 31-Dec-2018                                        (RMM1, RMM2) phase space for 1-Jan-2019 to 31-Mar-2019
            4                                                                                             4
                                                 Western                                                                                        Western
                                        7                       6                                                                      7                       6
                                                 Pacific                                                                                        Pacific
            3                                                                                             3

            2                                                                                             2

                      8                                                                 5                           8                                                                5
            1                                                                                             1
                 West. Hem.

                                                                                                                West. Hem.
                                                                                  Continent

                                                                                                                                                                                 Continent
                 and Africa

                                                                                  Maritime

                                                                                                                and Africa

                                                                                                                                                                                 Maritime
    RMM2

                                                                                                  RMM2
            0                                                                                             0

           –1                                                                                            –1
                      1                                                                 4                           1                                                                4
           –2                                                                                            –2

           –3                                                                                            –3
                                        2        Indian         3                                                                      2        Indian         3
                                                 Ocean                                                                                          Ocean
           –4                                                                                            –4
             –4               –3   –2       –1      0       1        2        3               4            –4                –3   –2       –1     0       1        2         3               4
                Labelled dots for each day.
                                                 RMM1                                                                                           RMM1
                                                                                                              Labelled dots for each day.
                Blue line is for Dec, green line is for Nov, red line is for Oct.                             Blue line is for Mar, green line is for Feb, red line is for Jan.
                (C) Copyright Commonwealth of Australia 2019. Bureau of Meteorology                           (C) Copyright Commonwealth of Australia 2019. Bureau of Meteorology
                2019                                                                                          2019

    Fig. 3. Phase-space representation of the Real-time Multivariate MJO index (RMM, Wheeler and Hendon 2004). (a) Shows daily values with the
    months of October 2018 in red, November 2018 in green, and December 2018 in blue. (b) Shows daily values with the months of January 2019 in red,
    February 2019 in green, and March 2019 in blue.

convection occurs. During summer 2018–19 there were positive                                      3 Summary of key meteorological and oceanographic
OLR anomalies over much of the land area in the southern                                          variables
hemisphere, including Australia (Fig. 4).                                                         The climate drivers and their diagnostic indicators discussed
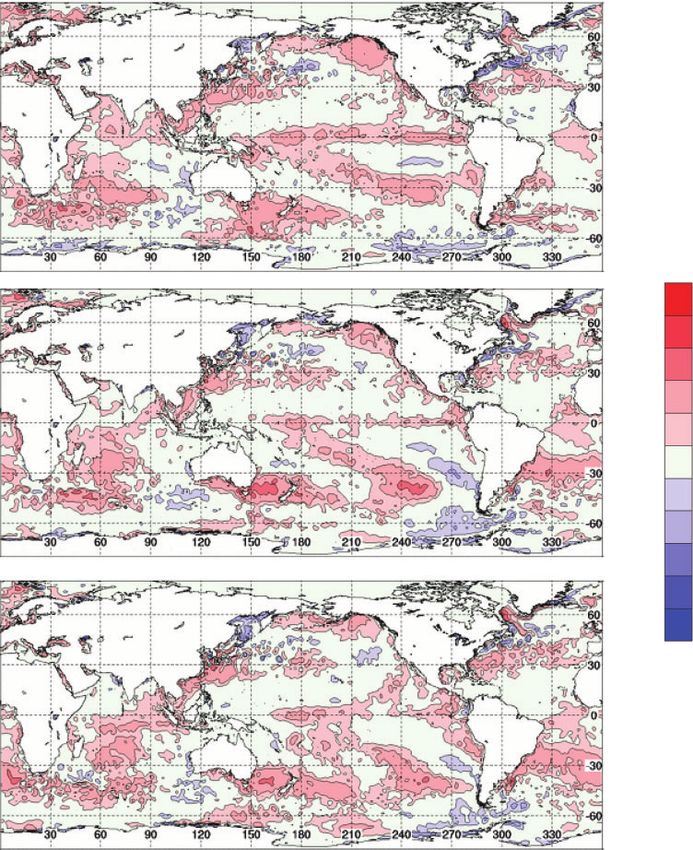
   The MSLP pattern for summer 2018–19 is shown in Fig. 5a,                                       above are not the sole influences on the observed meteorological
computed using data from the 0000 UTC daily analyses of the                                       and oceanographic conditions in the southern hemisphere over
Bureau of Meteorology’s Australian Community Climate and                                          the summer 2018–19 period. Synoptic weather systems and
Earth System Simulator (ACCESS) model1. MSLP anomalies                                            changes already observed in the climate system due to anthro-
are shown in Fig. 5b, relative to 1979–2000, climatology                                          pogenic greenhouse gas emissions (IPCC 2014; Bureau of
obtained from the National Center for Environmental Prediction                                    Meteorology and CSIRO 2020) are two further notable con-
(NCEP) II Reanalysis data (Kanamitsu et al. 2002). The MSLP                                       tributors of the state of the atmosphere and oceans at various
anomaly field is not shown over areas of elevated topography                                      points in the season and across the season as a whole.
(grey shading). In general, the MSLPs over Australia and South
America were higher than usual and lower than usual near                                          3.1 Meteorological variables
Antarctica, broadly consistent with a positive SAM. For more
information on the SAM index from the Climate Prediction                                          Temperatures were well above the long-term average over the
Center (NOAA), see http://www.cpc.ncep.noaa.gov/products/                                         southern hemisphere in summer 2018–19. Almost all land
precip/CWlink/daily_ao_index/aao/aao.shtml. Fig. 6 shows                                          areas outside the Antarctic had seasonal mean temperatures
December 2018 to February 2019 low-level (850 hPa) wind                                           near or above the 1981–2010 average, with the only significant
anomalies which indicates periods of strong westerly wind                                         cool SST anomalies being in the eastern Indian Ocean. It was
bursts in mid-December and mid-February. Winds are com-                                           the hottest austral summer on record in the NOAA2 (Huang
puted from ACCESS and anomalies with respect to the 22-year                                       et al. 2020) dataset, second-highest in GISS3 (Lenssen et al.
1979–2000 NCEP climatology.                                                                       2019) and third in the HadCRUT44 dataset, using a simple

1
  For more information on the Bureau of Meteorology’s ACCESS model, see http://www.bom.gov.au/nwp/doc/access/NWPData.shtml
2
  https://www.ncdc.noaa.gov/cag/global/time-series/shem/land_ocean/3/2/2019–2019
3
  https://data.giss.nasa.gov/gistemp/tabledata_v4/SH.Ts þ dSST.txt
4
  https://www.metoffice.gov.uk/hadobs/hadcrut4/data/current/time_series/HadCRUT.4.6.0.0.monthly_sh.txt
Seasonal climate summary for Australia and the southern hemisphere (summer 2018-19): extreme heat and flooding prominent
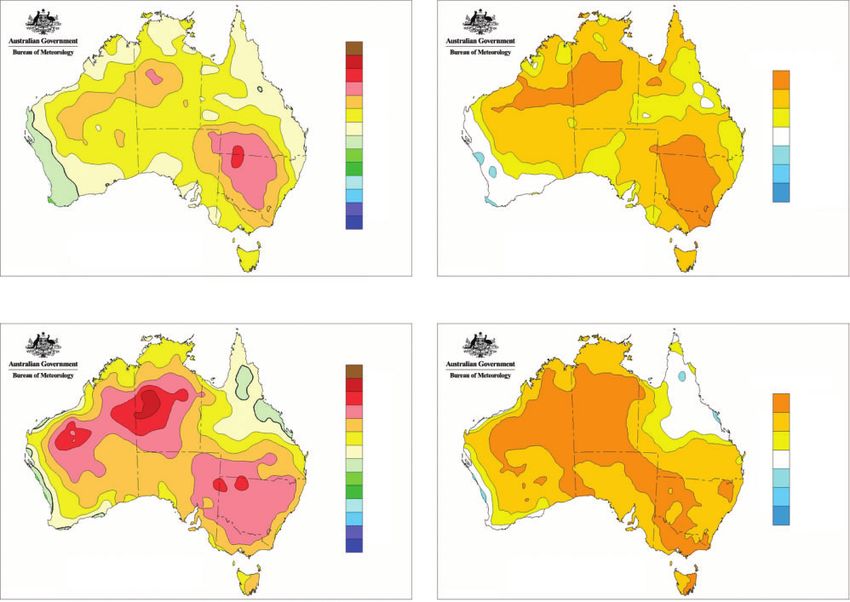
Seasonal Climate Summary: summer 2018–19                                                        Journal of Southern Hemisphere Earth Systems Science   E

                                                        OLR Totals: Average of 20181201 - 20190231
                 60°N

                 30°N

                   0°

                 30°S

                 60°S

                        0°     30°E      60°E        90°E    120°E        150°E   180°         150°W 120°W     90°W   60°W   30°W    0°
                                                −2
                                           Wm
                                                            80    100 120 140 160 180 200 220 240 260 280 300 320

                                                     OLR Anomalies: Average of 20181201 - 20190231

                 60°N

                 30°N

                   0°

                 30°S

                 60°S
                        0°     30°E      60°E        90°E    120°E        150°E   180°         150°W 120°W     90°W   60°W   30°W     0°

                                          W m−2
                                                            –45     –35    –25    –15     –5     5   15   25    35    45
                    (C) Copyright Commonwealth of Australia 2019, Bureau of Meteorology

                Fig. 4. (a) Average OLR totals and (b) anomalies for summer 2018–19. Anomalies calculated with respect to a base
                period of 1979–2010. Interpolated OLR data provided by the NOAA/OAR/ESRL PSD, Boulder, Colorado, USA.
                Available at: http://www.bom.gov.au/climate/mjo/#tabs¼Cloudiness.

average of the December, January and February ensemble                                  anomalies were highest or second highest in every state in
medians (Morice et al. 2012). There were 27 tropical cyclones                           December, except Queensland which ranked third highest.
in the 2018–19 season (World Meteorological Organization                                January was similarly hot, but in February top-10 mean
2020), the greatest number of tropical cyclones observed in a                           temperatures were recorded only in Western Australia and the
season since the 2008–09 season. The South Indian Ocean                                 Northern Territory, despite the Australian average being the
region had 13 hurricane-intensity cyclones, the equal-highest                           fourth highest on record. All other mainland states recorded
number ever recorded. Two tropical cyclones in the                                      above-average temperatures with Tasmania recording below-
Australian region that exceeded Category 2 strength (and                                average temperature, driven by cooler daytime maximum
hence, were Severe Tropical Cyclones) were Riley off the                                temperatures. Further discussion on January’s record-breaking
Kimberley coast in January, and Oma in the South Pacific in                             temperatures is included in Section 4.2.
February.                                                                                  During December, rainfall was below average in every state
   In Australia, December 2018 broke records for highest                                and territory, except Victoria. This dry tendency continued
nationally averaged mean, maximum and minimum temperature                               throughout the summer with all states and the Northern Territory
and was also overall drier than average (Bureau of Meteorology                          being drier than usual in January and February, except Queens-
2019a). The mean maximum temperature across the month was                               land and Tasmania which recorded above-average rainfall totals
2.418C above average, and every state except Tasmania                                   in February. Tasmania’s rainfall anomaly of –79% was its
recorded a mean maximum temperature between 28C and 38C                                 second lowest on record. This intensified existing rainfall
above average. The Northern Territory recorded a 3.288C                                 deficiencies. A summary of monthly state averages is provided
anomaly, which was its highest on record. Mean temperature                              in Table 1. Monthly maxima and averages are available on the
Seasonal climate summary for Australia and the southern hemisphere (summer 2018-19): extreme heat and flooding prominent
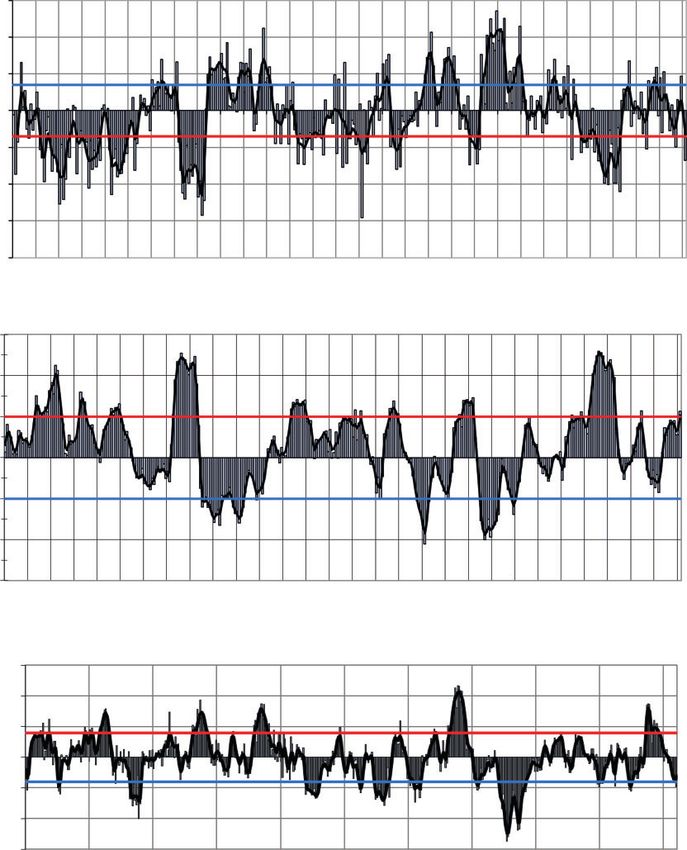
F   Journal of Southern Hemisphere Earth Systems Science                                                                       B. S. Hague

                                       MSLP 2.5 × 2.5 ACCESS OP. ANAL. (hPa) 20181201 0000 20190228 0000
                 (a)

                                                                                                               1035
                                                                                                               1030
                                                                                                               1025
                                                                                                               1020
                                                                                                               1015
                                                                                                               1010
                                                                                                               1005
                                                                                                               1000
                                                                                                               995
                                                                                                               990
                                                                                                               985
                                                                                                               980
                                                                                                               975
                                                                                                               970
                                                                                                               965

                       © Commonwealth of Australia 2019, Australian Bureau of Meteorology               Issued: 01/03/2019

                             MSLP 2.5 × 2.5 ACCESS OP. ANAL.-NCEP2 (hPa) 20181201 0000 20190228 0000
                 (b)

                                                                                                               20.0
                                                                                                               17.5
                                                                                                               15.0
                                                                                                               12.5
                                                                                                               10.0
                                                                                                               7.5
                                                                                                               5.0
                                                                                                               2.5
                                                                                                               0
                                                                                                               –2.5
                                                                                                               –5.0
                                                                                                               –7.5
                                                                                                               –10.0
                                                                                                               –12.5
                                                                                                               –15.0
                                                                                                               –17.5
                                                                                                               –20.0

                                                                                                              No data

                       © Commonwealth of Australia 2019, Australian Bureau of Meteorology                 Issued: 01/03/2019

                 Fig. 5. (a) Southern hemisphere mean sea level pressure (MSLP) pattern and (b) anomalies for summer 2018–
                 19. Anomalies calculated with respect to base period of 1979–2000.
Seasonal climate summary for Australia and the southern hemisphere (summer 2018-19): extreme heat and flooding prominent
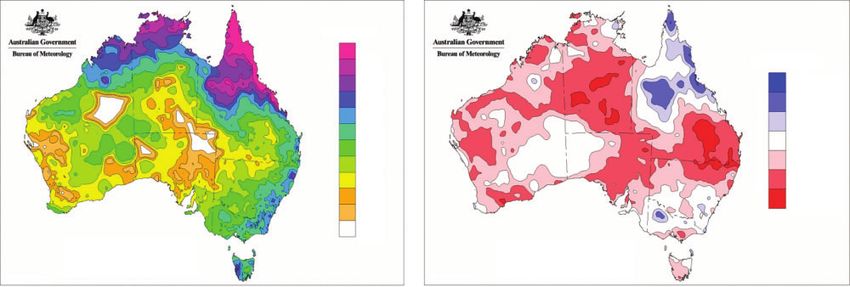
Seasonal Climate Summary: summer 2018–19                                                    Journal of Southern Hemisphere Earth Systems Science   G

                                               NCEP REANALYSIS; u 850hPa Anomalies; Daily–averaged
                                               1-Dec-2018 to 28-Feb-2019, NCEP climatology (1979-2010)
                        Dec 1

                           10

                           20

                        Jan 1

                           10

                           20

                        Feb 1

                           10

                           20

                                0°      40°E        80°E     120°E        160°E        160°W        120°W       80°W       40°W        0°

                       15.S–15.N                                                               m s–1

                       MW – Bureau of Meteorology      –13   –11     –9   –7      –5   –3      –1     1     3    5     7     9    11   13

                      Fig. 6. Low-level (850 hPa) wind anomalies. Winds are computed from ACCESS and anomalies with respect to
                      the 22-year 1979–2000 NCEP climatology. Plot provided by Bureau of Meteorology (M. Wheeler pers. comm.).

Bureau of Meteorology website5. Fig. 7 shows the rainfall totals                   Island where data extend back to 1932. Rainfall across New
and deciles nationally, and Fig. 8 shows maximum and mini-                         Zealand was overall below-average especially on the South
mum temperature anomalies and deciles.                                             Island, including in drought affected areas in the Tasman
    New Zealand experienced its third-warmest summer on                            district. On the west coast, Hokitika recorded its driest summer
record, with all regions recording anomalies greater than                          in over 150 years. Some areas of the North Island recorded
0.58C, with Hastings in the Hawke’s Bay region of the North                        above-average rainfall, but this was mostly attributed to single
Island recording an anomaly of 2.48C, its third-highest value                      very wet days interspersing largely drier-than-usual conditions6.
since records began in 1965. Numerous locations recorded their                         South Africa recorded above-average temperatures and
highest summer average daytime maximum temperature includ-                         below-average rainfall across much of the region in December
ing at Appleby in the Tasman district of the northern South                        except for western parts of Northern Cape and Western Cape

5
    http://www.bom.gov.au/climate/current/statement_archives.shtml
6
    The information in this paragraph has been summarised from NIWA (2019).
Seasonal climate summary for Australia and the southern hemisphere (summer 2018-19): extreme heat and flooding prominent
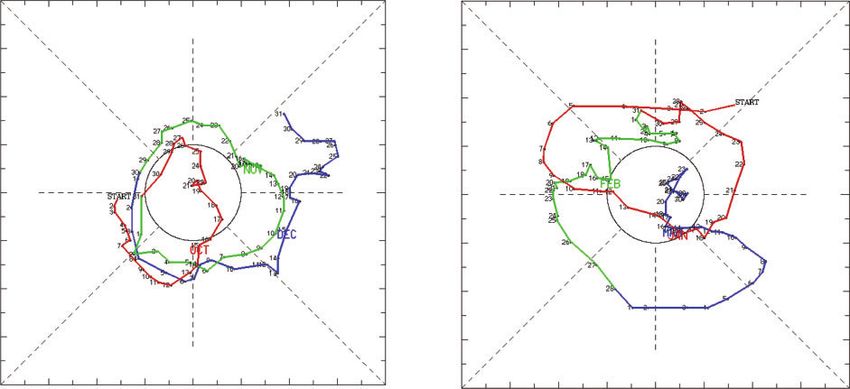
H           Journal of Southern Hemisphere Earth Systems Science                                                                                                                                                                    B. S. Hague

      (a)                                                                                                                          (b)

                                                                                                    Rainfall (mm)

                                                                                                              800 mm                                                                                                       Rainfall decile ranges
                                                                                                              600 mm                                                                                                               Highest on
                                                                                                              400 mm                                                                                                               record
                                                                                                                                                                                                                          10       Very much
                                                                                                              300 mm                                                                                                               above average
                                                                                                              200 mm                                                                                                      8–9      Above average

                                                                                                              100 mm                                                                                                      4–7      Average
                                                                                                              50 mm
                                                                                                                                                                                                                          2–3      Below average
                                                                                                              25 mm                                                                                                                Very much
                                                                                                                                                                                                                           1       below average
                                                                                                              10 mm
                                                                                                                                                                                                                                   Lowest on
                                                                                                              5 mm                                                                                                                 record
                                                                                                              1 mm
                  Australian rainfall analysis (mm)                                                           0 mm
                                                                                                                                           Rainfall deciles (using all avail. data)
               1 December 2018 to 28 February 2019                                                                                        1 December 2018 to 28 February 2019
                                                                                                                                                  Distribution based on gridded data
                       Australian Bureau of Meteorology
                                                                                                                                                  Australian Bureau of Meteorology
      http://www.bom.gov.au                                                                                                      http://www.bom.gov.au
     © Commonwealth of Australia 2020, Australian Bureau of Meteorology    ID code: Analyser             Issued: 06/09/2020      © Commonwealth of Australia 2020, Australian Bureau of Meteorology   ID code: Analyser             Issued: 15/12/2020

                        Fig. 7. Rainfall (a) totals and (b) deciles. Decile ranges based on grid-point data with respect to all available data 1900–2020.

Table 1. Area averaged rainfall totals and maximum and minimum temperature anomalies and ranking (if in top 10 highest or lowest) for Australia
                                             and individual states/territories over summer 2018–19

Region                                                                    Rainfall                                                   Maximum temperature                                                          Minimum temperature
                                                Average (mm)                                   Ranking                        Anomaly (8C)                            Ranking                          Anomaly (8C)                      Ranking

Australia                                              144.60                             10th lowest                             2.60                              Highest                                    1.67                      Highest
Queensland                                             325.07                                                                     1.50                            ¼8th highest                                 1.66                    4th highest
New South Wales                                         88.92                             10th lowest                             3.61                              Highest                                    3.21                      Highest
Victoria                                               105.18                                                                     2.74                              Highest                                    2.33                      Highest
Tasmania                                               195.22                                                                     1.85                            3rd highest                                  1.26                    4th highest
South Australia                                         22.09                                                                     3.09                              Highest                                    1.58                    3rd highest
Western Australia                                       77.47                              6th lowest                             2.50                              Highest                                    0.93                    4th highest
Northern Territory                                     165.81                              4th lowest                             3.25                              Highest                                    2.08                      Highest

which had near-normal rainfall and typically cooler tempera-                                                                        above the monthly average. This moderate-intensity marine
tures. Much of the eastern half of the country experienced                                                                          heatwave (Hobday et al. 2016, using visualisation of Schlegel
maximum temperature anomalies of greater than 38C. These                                                                            2020) was sustained over much of the region over the summer
above-average temperatures and below-average rainfalls                                                                              period but peaked in January 2019 as a strong to severe heatwave in
remained throughout January for much of the region although                                                                         the region west of New Zealand. A more short-lived heatwave of
the area of greater than 38C anomalies contracted to northern and                                                                   similar intensity and spatial extent also occurred near 2408E,
central parts of the country. February was milder, with approxi-                                                                    308S in December. The February Antarctic sea ice extent8 was
mately equal proportions of near-, below- and above-average                                                                         9.41 million km2, the fifth-lowest recorded since 1979 (Fetterer
maximum temperatures. Some areas were classified as ‘some-                                                                          et al. 2017), resulting from the second-warmest year on record
what dry’ but for most of the country, precipitation was near- or                                                                   (Blunden and Arndt 2020).
above-normal7.
                                                                                                                                    4 Notable events and their impacts
3.2 Sea-surface temperatures                                                                                                        This section is not intended to be exhaustive but rather provide
The SSTs were generally near or above average in the southern                                                                       examples of high-impact or notable events and how these
hemisphere during the summer of 2018–19 (Fig. 1). Notably,                                                                          affected societies, economies and the environment. Notable
a large area of above-average temperatures persisted in the                                                                         Australian events that will be considered here are the extreme
Tasman Sea, peaking in January with a large area of þ4.08C                                                                          heat in January and the extreme rainfall and flooding in

7
    The information in this paragraph has been drawn from the 2018 and 2019 annual climate summaries of the South African Weather Service (2019, 2020).
8
    ftp://sidads.colorado.edu/DATASETS/NOAA/G02135/south/monthly/data/
Seasonal climate summary for Australia and the southern hemisphere (summer 2018-19): extreme heat and flooding prominent
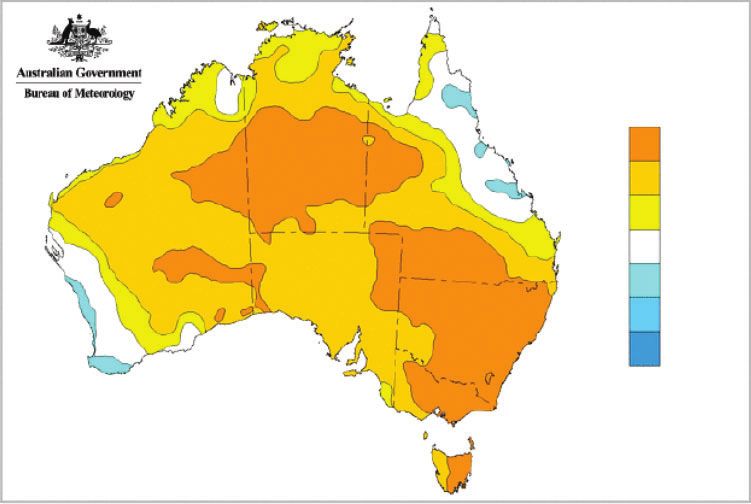
Seasonal Climate Summary: summer 2018–19                                                                                        Journal of Southern Hemisphere Earth Systems Science                                                      I

  (a)                                                                                                                 (b)

                                                                                               6°C
                                                                                                                                                                                                         Temperature decile ranges
                                                                                               5°C                                                                                                                    Highest on
                                                                                               4°C                                                                                                                    record
                                                                                               3°C                                                                                                                    Very much
                                                                                                                                                                                                            10        above average
                                                                                               2°C
                                                                                               1°C                                                                                                          8–9       Above average
                                                                                               0°C                                                                                                          4–7       Average
                                                                                               –1°C                                                                                                                   Below average
                                                                                                                                                                                                            2–3
                                                                                               –2°C
                                                                                                                                                                                                                      Very much
                                                                                               –3°C                                                                                                          1        below average
                                                                                               –4°C                                                                                                                   Lowest on
                                                                                               –5°C                                                                                                                   record
         Max. temp. anoms. (1961-1990 clim.)                                                   –6°C                  Minimum temp. deciles (all avail. data)
        1 December 2018 to 28 February 2019                                                                          1 December 2018 to 28 February 2019
               Australian Bureau of Meteorology                                                                             Distribution based on Gridded Data
                                                                                                                             Australian Bureau of Meteorology
  http://www.bom.gov.au                                                                                          http://www.bom.gov.au
  © Commonwealth of Australia 2020, Australian Bureau of Meteorology   ID code: Analyser   Issued: 10/09/2020   © Commonwealth of Australia 2020, Australian Bureau of Meteorology   ID code: Analyser               Issued: 10/09/2020

  (c)                                                                                                                (d )

                                                                                               6°C                                                                                                       Temperature decile ranges
                                                                                               5°C
                                                                                                                                                                                                                      Highest on
                                                                                               4°C                                                                                                                    record
                                                                                               3°C                                                                                                                    Very much
                                                                                                                                                                                                             10
                                                                                               2°C                                                                                                                    above average
                                                                                               1°C                                                                                                          8–9       Above average

                                                                                               0°C                                                                                                          4–7       Average
                                                                                               –1°C
                                                                                                                                                                                                            2–3       Below average
                                                                                               –2°C
                                                                                                                                                                                                             1        Very much
                                                                                               –3°C                                                                                                                   below average
                                                                                               –4°C                                                                                                                   Lowest on
                                                                                               –5°C                                                                                                                   record
         Max. temp. anoms. (1961-1990 clim.)                                                   –6°C                 Maximum temp. deciles (all avail. data)
        1 December 2018 to 28 February 2019                                                                         1 December 2018 to 28 February 2019
              Australian Bureau of Meteorology                                                                             Distribution based on Gridded Data
                                                                                                                            Australian Bureau of Meteorology
   http://www.bom.gov.au                                                                                         http://www.bom.gov.au
  © Commonwealth of Australia 2020, Australian Bureau of Meteorology   ID code: Analyser   Issued: 10/09/2020   © Commonwealth of Australia 2020, Australian Bureau of Meteorology   ID code: Analyser               Issued: 10/09/2020

  Fig. 8. Minimum temperature (a) anomalies and (b) deciles and maximum temperature (c) anomalies and (d) deciles. Decile ranges based on grid-point
  data with respect to all available data 1900–2020.

February. Further discussions on these are included in Sec-                                                        New Zealand experienced several extreme weather events
tion 4.1 (rainfall and flooding) and Section 4.2 (the heatwave),                                                that required evacuations of people in affected areas (NIWA
as is an example of a tide-driven coastal flooding event                                                        2019). In February more than 1000 people were evacuated as a
(Section 4.3).                                                                                                  large fire burned for 20 days in the Tasman region. One home
   South America also experienced a heatwave in late-January                                                    was destroyed, and 2300 hectares were burnt. On 2 December,
and early February, culminating in the southernmost observa-                                                    heavy rain led to the evacuation of homes in Hamilton and over
tion of a temperature exceeding 308C at 53.88S in Rio Grande,                                                   100 campers were evacuated from Waihi Beach as high tides
Argentina, the warmest temperature ever recorded so far south                                                   coincided with heavy rainfall on Christmas Eve. Tropical
(Blunden and Arndt 2020; World Meteorological Organization                                                      Cyclone Oma caused large agricultural impacts due to heavy
2020). Peru experienced its most intense heatwave for 30 years                                                  rains and floods in the South Pacific, especially Vanuatu and
and Paraguay recorded its hottest days on record, while                                                         New Caledonia (Blunden and Arndt 2020).
countries closer to the equator experienced droughts and water
shortages (Blunden and Arndt 2020). January 2019 also saw                                                       4.1 Record flooding in tropical Queensland
major flooding in northern Argentina, Uruguay and southern                                                      Five named tropical cyclones were reported in the Australian
Brazil resulting in losses estimated at $US2.5 billion (World                                                   region between 1 December 2018 and 28 February 2019: Owen,
Meteorological Organization 2020).                                                                              Kenanga, Penny, Riley and Oma. In addition to these, an un-
   Indian Ocean islands experienced both extreme wet                                                            named tropical depression 13U that was embedded in the
(Seychelles had its second wettest year out of the last 47)                                                     monsoon trough brought flooding rains to much of northern
and extreme dry (Réunion Island had its driest rainy season                                                    Queensland. This was arguably the tropical weather system
on record), while Southern Africa was also generally dry                                                        associated with the most intense impacts for the season (Bureau
(Blunden and Arndt 2020).                                                                                       of Meteorology 2019b), despite it never reaching tropical
J    Journal of Southern Hemisphere Earth Systems Science                                                                                                       B. S. Hague

                                                                                                                            Temp. Decile Ranges

                                                                                                                                          Highest on
                                                                                                                                          record

                                                                                                                                          Very much
                                                                                                                             10           above average

                                                                                                                             8–9          Above average

                                                                                                                             4–7          Average

                                                                                                                             2–3          Below average

                                                                                                                                          Very much
                                                                                                                              1           below average

                                                                                                                                          Lowest on
                                                                                                                                          record

                                                         Mean Temperature Deciles
                                                              January 2019
                                                       Distribution Based on Gridded Data
                                                        Australian Bureau of Meteorology
                   http://www.bom.gov.au

                  © Commonwealth of Australia 2020, Australian Bureau of Meteorology        ID code: AWAP                                  Issued: 03/02/2019

                  Fig. 9. January 2019 mean temperature deciles show large area of Australia as 10th decile or highest-on-record.
                  Daily mean temperature is calculated as the simple average of the daily minimum and daily maximum temperature.

cyclone intensity in the pressure- and wind-based metrics used                                     services. Further information and technical details on the flood-
by the Bureau of Meteorology. Severe Tropical Cyclone Owen                                         ing during January and February 2019 are provided in Bureau of
was the primary reason that north-eastern Queensland did not                                       Meteorology (2019d).
suffer the same rainfall deficiencies as the rest of Australia in
December (Bureau of Meteorology 2019a). The flooding                                               4.2 Record heat in south-east and central Australia
associated with the 13U low-pressure system was centred
                                                                                                   The summer of 2018–19 was the hottest on record for Australia,
principally off north-western Queensland and the Townsville
                                                                                                   on average 0.868C hotter than any previously recorded summer.
region, with Townsville recording 1052.8 mm of rain in the
                                                                                                   The heatwave conditions (defined by considering three-day
seven days to 4 February 2019, and 1259.8 mm in the ten days to
                                                                                                   periods relative to climatological means and recent
8 February. These totals were 166.6 and 334.3 mm higher than
                                                                                                   observations) were most extreme in January. January was
the previous seven- and ten-day accumulation records, set in
                                                                                                   0.998C hotter than any previously recorded month, and centred
January 1998 and January 1953 respectively. Further informa-
                                                                                                   on NSW, where it was more than 28C hotter than the previous
tion on the climatological and meteorological aspects of the
                                                                                                   record. Victoria, Tasmania, Queensland and the Northern
heavy rainfall leading to this flood event are contained in Bureau
                                                                                                   Territory also recorded their hottest month on record. The
of Meteorology (2019c).
                                                                                                   heatwave was also exceptionally prolonged and persistent, with
    This record-breaking rain produced record-breaking flood-
                                                                                                   28 days exceeding the monthly 99th percentile across the
ing in Townsville and surrounds. The most significant impacts
                                                                                                   summer, 2.5 times more often than in any previous summer.
were thousands of properties affected in Townsville, Giru (on
                                                                                                   The area of highest-on-record and other deciles is shown in
the Haughton River) isolated for more than a week, the closure
                                                                                                   Fig. 9. Further information, including climatological context
of key highways for over a week, and the spilling of the Burdekin
                                                                                                   and meteorological information is available in Bureau of
Falls Dam. There was also substantial flooding elsewhere in
                                                                                                   Meteorology (2019e). This period of extended heat was a factor
northern Queensland, with the Daintree River and the Daintree
                                                                                                   that contributed to long-lived and large bushfires in Tasmania
Village recording their highest flood height in 118 years. Major
                                                                                                   during January, with an area of approximately 2.6% of the total
flood thresholds were exceeded at Birdsville and Diamantina
                                                                                                   area of Tasmania burnt as the result of several large fires, many
Lakes (Diamantina River), Sellheim (Burdekin River), Giru
                                                                                                   in remote areas (Bureau of Meteorology 2019f).
(Haughton River), Townsville Aplin Weir (Ross River), Flora-
ville (Leichhardt River), Richmond and Walkers Bend (Flinders
River), Julia Creek (Julia Creek) and Daintree Village (Daintree                                   4.3 Tide-driven coastal inundation event on Australia’s east
River). Impacts consistent with this level were observed across                                    coast
northern Queensland – closure of major rail and road routes,                                       Although the impacts associated with this event may not have
flooding of buildings above the floor level and impacts to utility                                 been as severe as other events this season, or compared to
Seasonal Climate Summary: summer 2018–19                                            Journal of Southern Hemisphere Earth Systems Science                K

historical riverine flood events, this event is notable as an               References
example of a tide-driven flood event, occurring with only                   Blunden, J., and Arndt, D. S. (Eds) (2020). State of the Climate in 2019. Bull.
limited effects of statistically-extreme weather or ocean events.               Amer. Meteor. Soc. 101, S1–S429. doi:10.1175/2020BAMSSTA
Such events have been documented in the United States                           TEOFTHECLIMATE.1
(e.g. Ray and Foster 2016), but not yet documented in detail                Bureau of Meteorology (2019a). Monthly Weather Review Australia
in the Australian scientific literature – hence motivating its                  December 2018. Bureau of Meteorology, Melbourne. Available at
inclusion here.                                                                 http://www.bom.gov.au/climate/mwr/aus/mwr-aus-201812.pdf
    The high tide for 20 February was predicted to be the second-           Bureau of Meteorology (2019b). Tropical Low 13U – Townsville and
                                                                                northwest Queensland floods. Bureau of Meteorology, Brisbane. Avail-
highest tide of the year. At this time Ex-Tropical Cyclone Oma
                                                                                able at http://www.bom.gov.au/cyclone/history/Tropical_Low_13U.pdf
was offshore, with some probability that it may move towards                Bureau of Meteorology (2019c). North Queensland Monsoon Flood Report.
Brisbane, which generated high interest on both conventional                    Bureau of Meteorology, Melbourne. Available at http://www.bom.gov.
and social media platforms. This media interest resulted in this                au/qld/flood/fld_reports/QLD_Monsoon_Trough_floods.pdf
widespread coastal inundation in estuaries and tidal rivers along           Bureau of Meteorology (2019d). Special Climate Statement 69— an
the east coast being widely reported. Impacts were reported from                extended period of heavy rainfall and flooding in tropical Queensland.
Ku Ring Gai Chase National Park north of Sydney to Cairns in                    Bureau of Meteorology, Melbourne. Available at http://www.bom.gov.
northern Queensland between 18 and 22 February, with the most                   au/climate/current/statements/scs69.pdf
reports of flooding around Brisbane and the Gold Coast. The                 Bureau of Meteorology (2019e). Special Climate Statement 68—wide-
maximum observed hourly sea level during this event was                         spread heatwaves during December 2018 and January 2019. Bureau of
                                                                                Meteorology, Melbourne. Available at http://www.bom.gov.au/climate/
2.78 m on 20 February, 17 cm above the minimum flood
                                                                                current/statements/scs68.pdf
threshold level defined by Hague et al. (2019). The top-of-                 Bureau of Meteorology (2019f). Monthly Weather Review Australia
hour tide predictions generated using R TideHarmonics                           January 2019. Bureau of Meteorology, Melbourne. Available at http://
(Stephenson 2016) indicate that this height was 7 cm higher                     www.bom.gov.au/climate/mwr/aus/mwr-aus-201901.pdf
than would have been expected during typical meteorological                 Bureau of Meteorology and CSIRO (2020). State of the Climate 2020.
and oceanographic conditions (i.e. the non-tidal residual). A sea               Commonwealth of Australia. Available at http://www.bom.gov.au/
level of 2.78 m is not a particularly rare occurrence in Brisbane –             state-of-the-climate/documents/State-of-the-Climate-2020.pdf
it has occurred for 94 hours (over 79 days) in the 40-year period           Donald, A., Meinke, H., Power, B., Wheeler, M., and Ribbe, J. (2004).
1980–2019. Similarly, astronomical tides of at least 2.71 m have                Forecasting with the Madden-Julian Oscillation and the applications for
been predicted for 93 hours (over 84 days). Residuals of 7 cm or                risk management. In ‘International Crop Science Congress (ICSC 2004):
                                                                                New Directions for a Diverse Planet, 26 September–1 October 2004,
more are even more common, occurring approximately 17% of
                                                                                Brisbane, Australia’. Available at http://www.cropscience.org.au/
the time.                                                                       icsc2004/poster/2/6/1362_donalda.htm
                                                                            Fetterer, F., Knowles, K., Meier, W. N., Savoie, M., and Windnagel., A. K.
5 Conclusions                                                                   (2017). Sea Ice Index, updated daily. Version 3. Boulder, Colorado USA.
The key meteorological and oceanographic events in the                          NSIDC: National Snow and Ice Data Center. doi:10.7265/N5K072F8.
southern hemisphere summer of 2018–19 have been sum-                            [Accessed 10/09/2020].
                                                                            Hague, B. S., Murphy, B. F., Jones, D. A., and Taylor, A. J. (2019).
marised herein. This includes the first published accounts of a
                                                                                Developing impact-based thresholds for coastal inundation from tide
moderate-intensity marine heatwave in the Tasman Sea during                     gauge observations. J. South. Hemisph. Earth Syst. Sci. 69, 252–272.
January and a widely documented tide-only flooding event in                     doi:10.1071/ES19024
Brisbane, Australia. Further, we provide the broader climato-               Hobday, A. J., Alexander, L. V., Perkins, S. E., et al. (2016). A hierarchical
logical context for these and other key events and weather                      approach to defining marine heatwaves. Prog. Oceanogr. 141, 227–238.
impacts. ENSO and IOD, the key drivers of climatic variability                  doi:10.1016/J.POCEAN.2015.12.014
on the seasonal scale for Australia, were in neutral conditions.            Huang, B., Menne, M. J., Boyer, T., et al. (2020). Uncertainty estimates for
However, extreme rainfall and temperatures were still observed                  sea surface temperatures and land surface air temperatures in NOAA-
across Australia, and more broadly, the southern hemisphere.                    GlobalTemp version 5. J. Climate 33, 1351–1379. doi:10.1175/JCLI-D-
Australia experienced its hottest summer on record and its                      19-0395.1
                                                                            IPCC (2014). Climate Change 2014: Synthesis Report. Contribution of
hottest January on record which was 0.998C hotter than any
                                                                                Working Groups I, II and III to the Fifth Assessment Report of the
previously recorded month, with extreme heat centred on NSW                     Intergovernmental Panel on Climate Change (Eds R. K. Pachauri, and
and Victoria.                                                                   L. A. Meyer.) (IPCC: Geneva, Switzerland).
                                                                            Kanamitsu, M., Ebisuzaki, W., Woollen, J., Yang, S.-K., Hnilo, J. J., Fiorino,
Conflicts of interest                                                           M., and Potter, G. L. (2002). NCEP-DOE AMIPII Reanalysis (R-2). Bull.
                                                                                Amer. Meteor. Soc. 83, 1631–1643. doi:10.1175/BAMS-83-11-1631
The author declares no conflicts of interest.
                                                                            Kuleshov, Y., Qi, L., Fawcett, R., and Jones, D. (2009). Improving
                                                                                preparedness to natural hazards: Tropical cyclone prediction for the
Acknowledgements                                                                Southern Hemisphere. Adv. Geosci. 12(Ocean Science), 127–143.
The author wishes to acknowledge Skie Tobin (Australian Bureau of               doi:10.1142/9789812836168_0010
Meteorology) for assistance with development of Fig. 1 and Blair Trewin,    Lenssen, N. J. L., Schmidt, G. A., Hansen, J. E., Menne, M. J., Persin, A.,
Naomi Benger and Avijeet Ramchurn (all Australian Bureau of                     Ruedy, R., and Zyss, D. (2019). Improvements in the GISTEMP
Meteorology) for constructive reviews and feedback. This research did not       uncertainty model. J. Geophys. Res. Atmos. 124, 6307–6326.
receive any specific funding.                                                   doi:10.1029/2018JD029522
L      Journal of Southern Hemisphere Earth Systems Science                                                                                   B. S. Hague

Madden, R. A., and Julian, P. R. (1971). Detection of a 40-50 day oscillation   South African Weather Service (2019). Annual Climate Summary for South
   in the zonal wind in the tropical Pacific. J. Atmos. Sci. 28, 702–708.           Africa 2018. South African Weather Service, Pretoria. Available at
   doi:10.1175/1520-0469(1971)028,0702:DOADOI.2.0.CO;2                              https://www.weathersa.co.za/Documents/Corporate/Annual%20Clima-
Madden, R. A., and Julian, P. R. (1972). Description of global-scale                te%20Summary%202018%20FINAL.pdf
   circulation cells in the tropics with a 40-50 day period. J. Atmos. Sci.     South African Weather Service (2020). Annual State of the Climate 2019.
   29, 1109–1123. doi:10.1175/1520-0469(1972)029,1109:DOGSCC.2.                     South African Weather Service, Pretoria. Available at https://www.
   0.CO;2                                                                           weathersa.co.za/Documents/Corporate/Annual%20State%20of%20-
Madden, R. A., and Julian, P. R. (1994). Observations of the 40-50 day              the%20Climate%202019.pdf
   tropical oscillation: a review. Mon. Wea. Rev. 122, 814–837.                 Stephenson, A. G. (2016). Harmonic Analysis of Tides Using TideHarmonics.
   doi:10.1175/1520-0493(1994)122,0814:OOTDTO.2.0.CO;2                              Available at https://CRAN.R-project.org/package¼TideHarmonics
Morice, C. P., Kennedy, J. J., Rayner, N. A., and Jones, P. D. (2012).          Troup, A. (1965). The Southern Oscillation. Quart. J. Roy. Meteor. Soc. 91,
   Quantifying uncertainties in global and regional temperature change              490–506. doi:10.1002/QJ.49709139009
   using an ensemble of observational estimates: the HadCRUT4 dataset.          Wheeler, M., and Hendon, H. (2004). An All-Season Real-Time Multivariate
   J. Geophys. Res. 117, D08101. doi:10.1029/2011JD017187                           MJO Index: Development of an Index for Monitoring and Prediction.
NIWA (2019). New Zealand Climate Summary: Summer 2018–19. NIWA,                     Mon. Wea. Rev. 132, 1917–32. doi:10.1175/1520-0493(2004)132,1917:
   Auckland. Available at https://niwa.co.nz/sites/niwa.co.nz/files/Clima-          AARMMI.2.0.CO;2
   te_Summary_Summer_2018–19-NIWA.pdf                                           World Meteorological Organisation (2020). WMO Statement on the State of
Ray, R. D., and Foster, G. (2016). Future nuisance flooding at Boston caused        the Global Climate in 2019. WMO No. 1248. World Meteorological
   by astronomical tides alone. Earth’s Future 4, 578–597. doi:10.1002/             Organisation, Geneva. Available at https://library.wmo.int/doc_num.php?
   2016EF000423                                                                     explnum_id¼10211#:,:text¼The%20global%20mean%20temperature%
Schlegel, R. W. (2020). Marine Heatwave Tracker. Available at http://www.           20for,also%20the%20warmest%20on%20record.
   marineheatwaves.org/tracker. doi:10.5281/ZENODO.3787872

                                                             www.publish.csiro.au/journals/es
You can also read