Causes of bushfire is Australia - A response - FactCheck.org
←
→
Page content transcription
If your browser does not render page correctly, please read the page content below
Causes of bushfire is Australia – A response
                                         Colleen Bryant ©2020
Preamble
A recent video shared on Facebook
(https://www.facebook.com/watch/?v=837989649986602) is symbolic of a broader meme
that has emerged in political, media, and social media circles regarding the role of arson in
the current bushfire season. The above clip states that: “The popular narrative is that
Australia’s fires are caused by climate change but the facts say otherwise”. It goes onto say
that “since November 8, 2019 nearly 200 arsonists have been arrested for starting brush
fires in Australia”. It then forwards “the arsonists were responsible for about 50% of the
brushfires1”, before concluding that it is not climate change but arsonists that are
responsible for Australia recent bushfires.
The above statistic of 50% reportedly derives from an article published in “The Australian”
newspaper (Ross & Reid, 2020) which states “Swinbourne University Professor James Ogloff
said about 50 per cent of bushfire were lit by firebugs and impending seasons excited
them.” The figure he quoted reportedly came from a study a fire statistics released 12 years
ago, which would imply that that the professor was not speaking about the 2019‐20 season
specifically. Articles similarly highlighting the role of arson have emerged in the Spectator
(Chrenkoff, 2020) and Sydney Morning Herald (Rawsthorne, 2020).
However, the above narrative is countered by a recent article published by Nguyen et al.
(2020) for the ABC (Australian Broadcasting Commission), which examined the cause of
many of the large fires on a state‐by‐state basis. Ultimately they concluded that deliberate
fire‐setting did not play a significant role in the recent bushfires in New South Wales,
Victoria, South Australia, or even Queensland. They indicated that as little as 1% of the land
(approximately 5 million hectares) burned in NSW can officially be attributed to “arson”,
and that of the 1.2 million hectares burned in Victoria, only 385 hectares (0.03 per cent) had
a fire origin that was suspicious. This interpretation is seemingly supported by statements
by fire agency personnel, presumably interviewed for that story. Ben Shepherd, the acting
media manager at the Rural Fire Service [agency responsible for attending fires in rural and
remote NSW] was quoted as saying "I can confidently say the majority of the larger fires
that we have been dealing with have been a result of fires coming out of remote areas as a
result of dry lightning storms". Brett Mitchell, incident controller for the Country Fire
Authority in Bairnsdale, East Gippsland, Victoria, was similarly quoted as stating that most of
the fires have been caused by lightning (Nguyen et al., 2020). Fires on Kangaroo Island are
similarly attributed to lightning strikes.
To my knowledge there has not been a formal, systematic, nationwide analysis of the
“cause” of the 2019‐20 Australia’s bushfires, although Nguyen et al.’s (2020) rudimentary

1
 Note that brushfire is not a term used in Australia, and therefore this particular clip likely originated in the
US.

                                                         1
analysis makes a start. The true picture will only likely emerge after the smoke has settled,
so‐to‐speak, and all the investigations and data have been finalised.
The contrasting pictures painted above reflect the fact that even Australia’s most recent
tragic events are not immune from becoming embroiled in a partisan political discourse
regarding the perceived need to, or lack thereof, to address the issue of climate change.
Notably, the emergence of these different narratives will likely be seen by all to reflect the
perceived biases in Australia media and politics, and ultimately will likely be interpreted
through the “appropriate” lens according. Notably, The Australian newspaper is widely
regarded as being supportive of conservative, more right wing politics, whilst the ABC is
argued by many on the right to be supportive of the left.
Thus far (since August, 2019), I have declined to publicly comment to popular media on this
subject of “bushfire arson”. However, given the statistic that 50% of all bushfires in
Australia are caused by “bushfire arson” reportedly derives from a paper I wrote on the
causes of bushfires in Australia (Bryant, 2008a), I have in this instance responded to a
request by Saranac Spencer’s, a reporter from FactCheck.org, request for comment.
The following is an attempt to clarify the essence and meaning of the fire statistics
presented in Bryant (2008a, b), to provide some guidance regarding the complexities
involved in the interpretation of fires statistics, but also demonstrate how this out‐of‐date
analysis of vegetation fires may yet still provide some important insights regarding the likely
future fire patterns in the face of ongoing climate change.
What exactly did Bryant (2008a, b) say?
Bryant (2008a) stated that “on average across the country, approximately 13 percent of
vegetation fires are recorded as being deliberate and another 37 percent as suspicious. That
is, for all vegetation fires for which there is a cause recorded, 50 percent may be lit
deliberately…” and “Some caution should be taken when considering these figures. Just over
40 percent of vegetation fires across Australia do not have a cause assigned by the
responding fire agency.”
That one‐page briefing is based on an extensive several hundred page review (Bryant,
2008b) of ~280,000 vegetation fire incidents collected by 18 separate agencies responsible
for fire management across Australia. These agencies include urban brigades (personnel
typically paid), fire agencies in rural and remote regions (fire‐fighters are primarily
volunteers), as well as various land management agencies (conservation and forestry). Most
critically, that study typically only examined fire incident data over a 4–5 year interval, for
fires that occur during the late 1990s–early 2000s (the exactly range of years varied subtly
across agencies).
It is critical to note that Bryant (2008a, b,) is not a report on “bushfire arson”. It is a report
examining the causes (ignitions) of, and spatial and temporal distribution of fire incidents
involving vegetation fires. That language is intentionally precise; the meanings of each of the
underlined words are relevant to this debate.
2Bushfire versus vegetation fire
What is a bushfire? The term bushfire is used in Australia probably in a similar way to the
word wildfire is used in North America. It is a wildfire that occurs “in the bush”, that is in
forest, scrub, woodland or grassland.
What is a vegetation fire? A vegetation fire is any fire that occurs within vegetation. All
bushfires are vegetation fire but few vegetation fires are bushfires.
Why did Bryant (2008a, b) report on vegetation fires rather than bushfires? There are
inherent difficulties in precisely defining which of the 50,000 vegetation fire incidents
attended by fire agencies each year were or had the capacity to become a bushfire. This
results from imprecision in the definition of the term bushfire, difficulties integrating land
use patterns with individual fire incidents at the precise time of those fires, and ultimately
because of the often complex relationship between the Australian residential living and the
natural environments (some would argue dangerously so). Commensurately, a fire started in
the vegetation in someone’s backyard in an urban centre may have exactly the same code
as one started in the neighbouring state forest or national park, within a fire agency
database. Any attempt to differentiate between the two is fraught.
Both the nature and causes (ignition) of vegetation fires vary markedly between urban
landscapes and remote wilderness areas. Therefore, it is not valid to directly compare
statistics for vegetation fires (e.g., Bryant 2008a, b) and bushfires.
Fire incidents versus fire incidence
Bryant (2008a, b) provided an analysis of all vegetation fires attended by various State and
Territory fire agencies within a given period, as recorded in their incident databases.
Importantly, the latter is not a record of all incidents attended by Australian fire agencies. At
the time of writing, many of the fires attended by volunteers in regional Queensland and
Western Australia were not included in those jurisdictions databases. It is my understanding
that this has subsequently changed to some extent in Queensland.
Nor is the report based on all vegetation fires in Australia. The overwhelming majority of
fires that occur across the deserts and savannah of Australia’s top end, many of which are
exceptionally large (largest fires in the Northern Territory burned 40‐45 million hectares) are
not attended by fire agencies unless they pose risk to life or property, and the
overwhelming majority are not recorded at all (except perhaps on Geoscience Australia’s
hot spots maps).
If we are to include all instances of vegetation fires within the Australian landscape by rights
we would also need to include all back‐burns, and all fires lit by Indigenous Australia, as a
means of ecosystems management. Neither of these is recorded within the available
incident databases unless fire agencies have been requested to attend (e.g., fire escape, fire
monitoring).
3The significance of the above is that fire incidents attended by fire agencies are biased
towards human‐caused ignitions (including deliberately lit) whereas many fires that occur in
remote areas that are not attended by fire agencies are likely started by natural causes.
Fire cause
Inherent limitations of assigning the cause (ignition) or fires
There are inherent difficulties in determining the causes (ignition) of vegetation fires, and
commensurately considerable uncertainty in the reported statistics. This reflects the facts
that:
very few of the vegetation fire incidents attended are scientifically investigated
(cf. building fires), although this increases during periods of adverse bushfire
weather.
it can be difficult to establish the exact point of origin
very little of the evidence relating to ignition may be preserved following the fire
fires often occur in more remote locations that are not readily observed
the nomination of a cause as “deliberate” or “suspicious” is commonly achieved
through elimination of all other likely factors.
Therefore, there is considerable uncertainty surrounding the assignation of the causes of
fire ignitions. In a high proportion of instances the cause of a vegetation fire is documented
as unknown.
Bushfire arson versus deliberately lit vegetation fires
Importantly, Bryant (2008a, b) does not report on rates of “bushfire arson”, it is a report on
the rates of deliberately lit vegetation fires. How do those two things differ?
For an act to be classified as arson it must be established, by a court, that a series of criteria
have been met. These can be basically summarised as; that a fire was lit, there was intention
or wilfulness, the fire was lit with malice, and there was some kind of property or object
burned (Willis, 2008).
“Bushfire arson” is a colloquial term applied to describe the criminal act of “deliberately
setting fire to the bush”. Each state and territory has its own specific law pertaining to such
an offence. In most jurisdictions the appropriate legislation makes it an offence to cause a
fire intentionally, and be reckless as to its spread to vegetation on any public land or on land
belonging to another (or something similar).
Critically, for an act to labelled “bushfire arson”, the responsible person must be convicted
of the appropriate offence. A study of “bushfire arson” would examine all the criminal
justice statistics pertaining to the relevant offences, and more specifically, the number of
persons ultimately convicted of those offences (not simply arrested for). Such an analysis
would be of limited value, because it would tell us very little about how many fires were
possibly lit deliberately. Moreover, it would tell us absolutely nothing about any of the other
causes of ignitions.
4Given the considerable uncertainty with respect to assigned cause, Bryant (2008a, b)
attempted to establish possible rates of deliberate fire‐setting. Those works used the term
“deliberate” to collectively refer to all fires that reported as either incendiary (or deliberate,
malicious etc.) or suspicious, within the available fire incident databases. However, even the
use of deliberate is less than ideal, as the fire incident database reveals nothing about
intent. For example, someone can deliberately light a fire that is not a potentially2 criminal
act (e.g., barbeque, campfire, back‐burn). These types of fires were classified as “accidental”
in Bryant (2008a, b).
What do Bryant’s (2008a, b) results tell us about the “causes” of bushfires,
and how can this inform the current debate?
Two factors are required to “cause” a bushfire; a source of ignition, and agents that
facilitate its spread (e.g., suitable fuels, wind, low fuel moisture, low relative humidity, etc.).
Notably, we can have a point of ignition but a bushfire will not eventuate if there is no agent
to facilitate its spread. A bushfire cannot occur in the absence of a source of ignition.
Source of ignition – Number of fires
Bryant (2008a) results highlight that over 90% of vegetation fires were caused by people,
with deliberately lit fires accounting for approximately half (49.5%) of all vegetation fires
attended by fire agencies in Australia, where the cause (ignition) was “known”.
The latter qualifier is significant. Notably, the cause (ignition) of fires was denoted unknown
in at least one‐third of vegetation fires, but comprised as much as 79% for one urban‐based
agency (likely reflects differences in how agencies treat uncertainty). In reality, only 9% of all
vegetation fires were actually identified as incendiary (13.3 % of vegetation fires with a
cause assigned), but a further 24.3 % were identified as suspicious (36.2 % of vegetation
fires with a cause assigned). In reaching the figure of 50% we assume that all suspicious fires
were in fact incendiary, and that the likely distribution of fire causes (ignitions) is similar for
the knowns and unknowns, neither of which may be valid.
The vast bulk of all vegetation fires occur within, or within close proximity to, major
population centres. This is seen irrespective of whether the fire agency is urban‐based,
rural, or a land management agency. If we use the statistics for NSW (Table 1) as an
example, it is evident that high rates (incidence of) incendiary and suspicious fires are
evident for all fire agencies, although in general, deliberate causes (including suspicious)
account for a slightly higher proportion of fires attended by urban based brigades as
compared with land management services (e.g., National Parks and Wildlife, State Forests,
Table 1). So, if we do “a back of the envelope” calculation, using average vegetation fire
statistics, approximately 110 of vegetation fires in State Forests and 190 vegetation fires in
National Parks, in any given year in NSW were – at that time – likely incendiary or
suspicious.
2
Whether or not it is an offence depends if that act is prohibited on a Total Fire Ban day.
5The most profound difference evident in fire cause (ignitions) across agencies with a given
jurisdictions relates to the proportion of natural fires (primarily lightning). For example, in
NSW, during the aforementioned interval, natural fires accounted for 1.5% of vegetation
fires of known cause attended by urban‐based brigades as compared with 29% and 20% of
vegetation fires of known cause attended by National Parks and Wildlife and State Forests,
respectively. These rates are likely substantially higher for genuine bushfires (see below).
Table 1: Summary of fires statistics for vegetation fires attended by fire agencies across New
South Wales in the later 1990’s‐early 2000’s.
No. per %
annum %Incendiary %Suspicious %Natural %Unknown Deliberate
(approx.)# (%Known) (%Known) (%Known) (%Known) (%Known)
NSW Fire
Brigades (urban) ~11,000 14.6 (21.7) 22.6 (33.5) 1 (1.5) 32.6 37.2 (55.2)
NSW Rural Fires
Service
(Regional, rural) ~ 7,000* 2.6 (5.4) 15.9 (33.0) 8.8 (18.3) 51.8 18.5 (38.4)
NSW Forests
(forestry) ~270 38.5 (40.2) 19.5 (20.4) 4.4 (4.6) 38.5 (40.3)
NSW National
Parks and
Wildlife ~400 21.2 (25.0) 19.7 (23.3) 24.7 (29.2) 15.3 40.9 (48.3)
*Based on three years for which the data is considered to be complete.
#
Note that the same fire (particularly bushfires) may be reported in the statistics of more than one agency.
(Statistics sourced from Bryant, 2008b)
Relationship with adverse fire weather
Daily variations
It is exceptionally difficult to correlate specific fire incidents with fire weather because the
relevant agencies in Australia (e.g., Bureau of Meteorology) did not maintain historical
records of the fire danger conditions for individual regions. A limited number of fire
agencies have independently chosen to record the fire danger rating within their fire
statistics, albeit inconsistently.
Although a precise quantitative analysis is not possible, the available evidence indicates that
fire ignitions in general, and deliberate fires in particular, occur under a very broad range of
weather conditions ranging from low to extreme3. The distribution of the fire conditions
under which vegetation fires occur is strongly linked to the distribution of fire weather
conditions at that locality more generally. This means, that if one locality experiences a high
3
Note that the severe and catastrophic categories were implemented after the observation period covered in
Bryant (2008a, b).
6proportion of very high or extreme fire danger days then a high proportion of all deliberate
fires will occur under those conditions.
Historically, the media, and commensurately parts of the broader population, have been
deeply concerned that “bushfire arsonists” deliberately target adverse fire weather. Again, a
quantitative analysis was not possible in the absence of complete historical records.
However, contrary to existing fears, available evidence indicates that the proportion of
incendiary and suspicious fires actually decreases under extreme weather conditions, being
significantly outstripped by an increasing numbers of accidental and natural fires.
Seasonal (yearly) variations
Bryant (2008b) typically only analysed the number of fires over a comparatively short
interval (generally five years). Commensurately, longer term variations of fire ignitions as a
function of seasonal variations in fire weather (and climate) are sometimes difficult to trace
within that data, particularly as not all fire data cover the same interval.
The general observations are:
Most vegetation fire statistics occur within, or close proximity to, urban
environments. Commensurately, the data are dominated by incidents from urban
and rural fire agencies (e.g., NSW RFS, Victorian CFA are commonly attend fires in
regional urban centres).
The numbers of vegetation fires that occur in urban areas do not fluctuate
substantially across seasons, irrespective of fire weather. That observation is
supported by longer term fire statistics recorded by the Australian Productivity
Commission (https://www.pc.gov.au/)
Nevertheless, there is a small increase evident in the number of vegetation fires
attended by fire agencies in years in which there were more adverse bushfire
weather conditions (e.g., 1997‐98. 2002‐03).
A comparatively high proportion (varies with location) of all vegetation fires were
likely deliberately lit, irrespective of the fire weather.
The most profound effect of seasonal (annual) variations in adverse fire conditions is
evident for land management agencies. This is significant to this discussion, because this is
the environment in which most bushfires occur. Figure 1 presents a summary of vegetation
fires attended annually by the NSW Parks and Wildlife Service for the period from 1995‐96
to 2003‐04. This period overlaps with the first part of the Millennium Drought, a period of
rainfall deficit in south‐eastern Australia that extended from late 1996 to mid‐2010.
However, it is noted that 1997‐98 and 2002‐03 were also associated with El Niño events,
and commensurately were associated with particularly adverse fire weather.
In 1997‐98 and 2002‐03, the NSW Parks and Wildlife attended significantly higher numbers
of vegetation fires. This increase in numbers was primarily due to the considerably higher
number of natural fires; natural fires accounted for 41 and 50 percent of vegetation fires
attended in 1997–98 and 2002–03, respectively. Ultimately, fires started by lightning,
burned most of the highlands of Victoria and southern New South Wales. Fires started by
7lightning strikes in the forests to the west of Canberra, on January 17, under what arguably
were catastrophic conditions, impacted western Canberra killing four (435 injured), and
destroying 488 buildings (mostly homes).
Figure 1: Number of, and percentage of deliberately lit vegetation fires attended by NSW
Parks and Wildlife from 1996‐96 to 2003‐04 (Sourced from Bryant, 2008b).
However, it is also noteworthy that high numbers of vegetation fires were also documented
in 2000‐01 and 2001‐02. Whilst increased numbers played a role, in both years there were
particularly high numbers of incendiary and suspicious fires. The role of “arson” was widely
reported in the media during the summer of 2001‐02, prompting, subsequently, a concerted
effort to address the issue of the deliberate lighting of vegetation fires.
Fire incident statistics from the then Department of Sustainability and Environment yield a
similar trend with regard to the causes (ignitions) and particular adverse bushfire seasons.
Notably, the highest numbers of fires were recorded in 1997‐98, followed by 2002‐03, and
1994‐95, three years associated with a negative oscillation index (El Nino events). The
numbers of fires started by lightning were distinctly higher in 1997–98, and to a lesser
extent 2002–03. In these years, the absolute numbers of incendiary and suspicious fires
remained comparatively unchanged, but comprised a lower proportion of all vegetation.
Fire spread
The above information regarding the number and distribution of fire incidents is useful but
it tells nothing, in and of itself, about the spread of a fire. The latter in large part determines
which vegetation fires (presuming there is access to vegetation), can be considered a
bushfires (or potential bushfire) and which are not, although in reality, the line between the
two is arguably ill‐defined.
The overwhelming majority of all vegetation fires are small, and the frequency of fires
decreases with increasing magnitude. This is observed irrespective of the cause (ignition)
and across both volunteer fire brigades that cover rural and regional centres as well as land
management agencies (i.e., agencies managing conservation areas, and state forests),
8across all years. Nevertheless, differences is size distribution are evident across these
categories.
For example, 59% of fires attended by Victoria Department of Sustainability and
Environment from 1995‐96 to 2003‐04 were less than 1 ha, and 86% were less than 10 ha.
The proportion of all fires that were deliberately lit remained approximately stable across
most fire size categories but comprised a markedly lower proportion of fires burning in
excess of 1,000 hectares. Natural fires accounted for a substantially higher proportion of
very large fires (>1,000 ha). Departmental burns also contributed to an increasing
proportion of larger scale fires categories.
Figure 2: Area burn by category (ha), by cause for vegetation fires attended by the Victoria
Department of Sustainability and the Environment, 1993‐94‐2003‐04 (Sourced from Bryant,
2008b).
A broadly similar trend is evident for NSW National Parks and Wildlife, and NSW RFS data,
although in these two instances, suspicious and to a lesser extent incendiary fires accounted
for a higher proportion of larger fires. Notably, the marked increase in the proportion of
natural fires is only evident in fires greater than 5,000 (NSW RFS) to 10,000 (NSW NPWS).
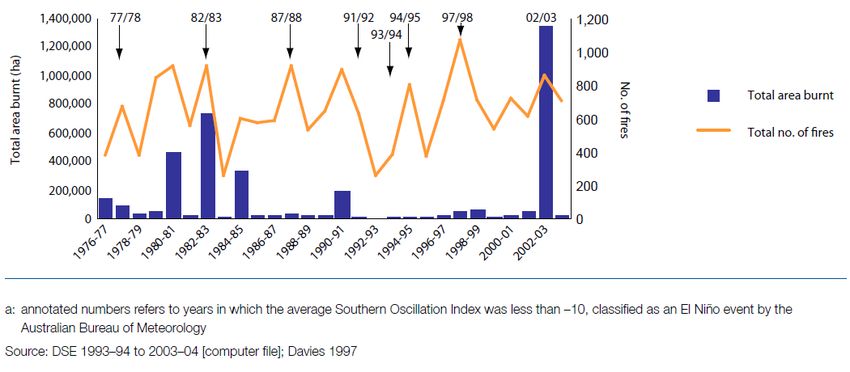
It is critical to observe that several large fire events may dominate any statistics pertaining
to the total area burned. In Victoria, 91.9 per cent of all land burned in Victorian DSE fires
(land mangaement agency), from 1993‐94 to 2003‐04 resulted from natural causes. These
statistics are dominated by the expansive fires of 2003‐03 (Figure 3). Deliberate fires burned
0.5 per cent of the area during the same interval.
The statistics for NSW are slightly different. Notably, deliberate fires accounted for 21
percent of the total 3.5 million hectares burned in NSW NPWS vegetation fires from 1995‐96
to 2003‐04, primarily in 2000‐01 and 2001‐02 (Figure 4). As noted previously, measures
were subsequently enacted to address deliberate fires in NSW.
9Figure 3: Number of fires and total area burned y vegetation fires each year from 1977‐78 to
2003‐04 with additional data from Davies (1997).
Figure 4: Total area burned, by cause, NSW National Parks and Wildlife 1995‐06 to 2003‐04
(Sourced from Bryant, 2008b).
It is an indisputable fact that natural fires account for the greatest total area burned in
Australia, particularly during years of drought and adverse fire weather.
As documented in the biennial State of the Climate report (http://www.bom.gov.au/state‐
of‐the‐climate/), Australia’s rainfall is highly variable, being strongly influenced by
phenomena like El Niño, La Niña, and the Indian Ocean Dipole. The years in which the
greatest total area is burned tends to be associated with years of drought, and commonly
El Niño events. Large areas have not always been burned in ever year in which an El Niño is
recorded (Figure 3), the reasons for which likely reflect the differential rainfall patterns of
individual El Niño, the role of Indian Ocean Dipole effects, and a variety of other reasons,
10some of which likely remain to be fully quantified. Significantly, the largest areas tend to be
burned in years of extreme weather conditions that come on top of a period of prolonged
drought. This is documented more specifically below.
The Ash Wednesday bushfire which burned through 210,000 hectares in Victoria and
208,000 hectares in South Australia, mostly in one day, killed 75 people, and destroyed
3,700 homes and buildings. The Ash Wednesday occurred on a day of catastrophic fire
conditions, within a year associated with El Niño event, which occurred on the back of one
of the worst droughts in Australian history that began in 1979
(https://en.wikipedia.org/wiki/1979%E2%80%9383_Eastern_Australian_drought).
Particularly large areas of land were burned in 2002‐03 (Figure 3), a year in which an El Niño
event was experienced mid‐way through the Millennium Drought (late 1996 to mid‐2010).
Reports on the Eastern Victorian Alpine bushfires indicate that initially there were 87 fires
started by lightning strikes. Eight of those fires could not be contained, eventuallly merging
togother to burn over 13,000 km² over a period of 59 days
(https://en.wikipedia.org/wiki/2003_Eastern_Victorian_alpine_bushfires). Lightning
triggered by the same weather event trigged bushfires in southern NSW, some of which
culminated with the Canberra fires of 17 January 2003 (see above).
Forebodingly, the Millennium drought was associated with another two particularly bad fire
seasons. The year of 2006‐07 is not well remembered as being particularly disastrous, within
the annals of Australia’s collective bushfire memory. It is however, significant because it
included the Victorian Alpine Complex which commenced with lightning strikes on
1 December 2006. That fire burned 1,048,000 ha (almost two thirds of the amount burned
during Victoria’s current fire season) and resulted in the loss of 51 homes. This fire was
significant because it represents Victoria’s longest running fire in (recorded) history. Severe
bushfires were experienced in New South Wales, South Australia, Tasmania and Western
Australia during the same year. It is debated by some (e.g., Su et al., 2018) that 2006‐07 was
also associated with an El Niño event.
However, the 2006‐07 fires pale into insignificance (at least from a human perspective),
with the Black Saturday fires of 2009‐10 during which fires that started as a result of
powerlines, deliberate fire‐setting, lightning and machinery burned 450,000 hectares, killing
173 people, destroying 3,500 building (2,029 houses). The year 2009‐10 again was
associated with an El Niño event that occurred at the very end of the Millennium drought.
The current 2019‐20 is associated with a severe drought, which has been widespread across
much of Australia since 2017.
Climate change
The fifth, biennial State of the Climate report (https://www.csiro.au/en/Showcase/state‐of‐
the‐climate), based on the latest monitoring, science and projection information, highlights
the following points:
11Temperature
The seasonal (year to year) natural variably in temperature induced by El Niño and La
Niña in the tropical Pacific Ocean and phases of the Indian Ocean Dipole in the Indian
Ocean, is now superimposed on a trend of increased warming.
Australia's climate has warmed just over 1°C since 1910 leading to an increase in the
frequency of extreme heat events.
Increased temperatures are observed across both day and night‐time temperatures,
in all seasons.
The number of more extreme daily heat events (those above the 99th percentile of
each month from the years 1910–2017) has also increased.
Addendum: It is noteworthy that that the Australia Bureau of Meteorology has identified
the last seven years have been among the top 10 warmest on record for Australia. 2019 is
officially Australia’s hottest year on record.
Rainfall
Despite the natural variability in rainfall, which is strongly influenced by El Niño, La
Niña, and the Indian Ocean Dipole phenomena, there has been a shift towards drier
conditions across southwestern and south‐eastern Australia during April to October,
with a decline of around 11 per cent in April–October rainfall in the southeast of
Australia since the late 1990s.
Streamflow has decreased across southern Australia.
Fire weather
There has been a long‐term increase in extreme fire weather and in the length of the
fire season across large parts of Australia. Notably, there is a clear trend in more
recent decades towards of a greater number of very high fire weather days in
spring4.
The prediction is that future climate change will bring us more of the same.
Conclusion
Bryant (2008a) did conclude that as much as 50 percent of vegetation fires in Australia may
be deliberately lit. However, that statistic is not, and should not be used as, an assessment
of the likely causes (ignition) of Australia’s 2019‐2020 bushfires, as it is not an accurate
reporting of what has occurred, and it is unlikely representative of the actual picture.
What the larger report of Bryant (2008b) ultimately demonstrates is how the distribution of
vegetation fires is dominantly a reflection of patterns of human activity and behaviour, and
reflects their interaction with the landscape in which they live. Humans are likely
responsible for 90 per cent of all vegetation fire ignitions, and commensurately there is a
4
Absent from this report, and issue of critical importance with regard bushfire is the potential impacts of
changes in wind strength, velocity and variability as a function of climate change.
12strong correlation the distribution of people and the distribution of vegetation fires across
the landscape.
Deliberate fires account for approximately 60 percent of human‐caused ignition, the
remaining 40% being accidental in origin. High rates of deliberate fire‐setting appear to
occur across all environments in which human interact, irrespective of the fire‐weather. In
fact, the proportion of deliberate fires decreases on extreme fire weather days, owing to the
much greater increases in natural and accidental fires.
A higher proportion of deliberately lit vegetation fires occur in areas of greater social
disadvantage. This reflects the fact that deliberate fire‐setting, like any other problematic
behaviour, is a reflection of societal functioning. There is much focus on “arsonists”.
However, the distribution of deliberately lit vegetation fires is not simply a reflection of the
distribution of the “arsonists”; it captures and reveals the intersection between human
society and the environment.
A critical observation is that natural causes, principally lightning, commonly account for
approximately 20‐25 per cent of fires in conservation areas and state forests, but more
significantly, this may increase to as much as 50 per cent during particularly adverse fire
seasons. It is emphasised that the majority of very large bushfires have a natural origin, and
such fires account for the overwhelming majority of all land burned, particularly during
particularly adverse bushfire seasons.
There is a clear link between adverse bushfire outcomes and adverse bushfire weather, at
both smaller and larger scales. Large areas of land are commonly burned in years associated
with climatic “anomalies”, during which there is more extreme weather. Catastrophic fire
events like Ash Wednesday, Canberra fires, and Black Saturday are clearly associated with
catastrophic bushfire weather conditions. The worst outcomes (considering life, property
and the environment combined) occur in years where a climatic phenomenon like El Nino
and Indian Ocean Dipole follow a period of sustained and widespread drought.
The evidence is that climate change seasonal (year to year) natural variably in temperature
are now superimposed on a trend of increased warming, south‐eastern Australia is
becoming drier, and consequently that there is a long‐term increase in extreme fire
weather. A critical point is that human‐induced climate change appears to be driving not
only a trend of increased warming but likely also the frequency at which we experience
climatic phenomenon like El Nino (e.g., Cai et al., 2014) and Indian Ocean Dipole (Wang et
al. 2017) effects.
The framing of this issue as an arsonist versus climate change debate reflects a failure to
accurately understand the nature of the issues involved, but also a failure to capture the
essence of the problem that needs to be resolved. People do what people do. They have
barbeques, they mow the lawn, they harvest some grain, they cut up some steel with an
angle grinder in their back yard, they light a campfire, they burn some rubbish, they ride a
motorbike through a paddock, and some even light up some the grass in the local
neighbourhood. Whilst only one of these is probably perceived as being illegal or
problematic all have the potential to create a disastrous bushfire if they are undertaken
13during more adverse bushfire weather. The evidence is that climate change is increasing the
likelihood that such adverse bushfire weather will take place. So when people do what
people do, for whatever reason they do it, there is an increasing likelihood that it will
coincide with more adverse fire conditions. That means without any change in human
behaviour, the potential for more adverse outcomes will increase. So, ultimately, into the a
future there will be an ever increasing need to address all actions and behaviours that
contribute to human‐related fire ignitions be they perceived as deliberate or accidental in
origin. However, even if by some miracle (because that it was it would require) we were
able to eliminate all such instances, we would not eliminate the ever‐increasing threat
posed by bushfires started by lightning, that will arise with a warming, drying landscape.
While there has been a tendency for arson to be pitted against climate change in this
debate, there is a common theme. All human beings must become conscious of the
potential consequences of their actions, and adjust their thinking and behaviours
accordingly, if adverse outcomes are to be avoided.
References
Bryant, C.J. 2008a. Proportion of deliberate bushfires in Australia. Bushfire arson bulletin no. 51.
Canberra: Australian Institute of Criminology. https://aic.gov.au/publications/bfab/bfab051.
Bryant, C.J. 2008b. Understanding bushfire: trends in deliberate vegetation fires in Australia.
Technical and background paper No. 27. Canberra: Australian Institute of Criminology.
Cai, W., Borlace S., Lengaingne, M., van Rensch, P., Collins, M., Vecchi, G., Timmermann, A., Santoso,
A., McPhaden, M.J., Wu, L., England, M.H., Wang, E., Guilyardi, E., & Jin, F.‐F. 2014. Increasing
frequency of extreme El Niño events due to greenhouse warming. Nature Climate Change 4:
111‐116.
Chrenkoff A. 2020. We don’t just have a bushfire crisis. We have an arson crisis, too.
https://www.spectator.com.au/2020/01/we‐dont‐just‐have‐a‐bushfire‐crisis‐we‐have‐an‐
arson‐crisis‐too/ (accessed 16 Jan 2020)
Nguyen, K., Brunero, T., Thomas, S., & Keane D. 2020. The truth about Australia's fires — arsonists
aren't responsible for many this season. https://www.abc.net.au/news/2020‐01‐11/australias‐
fires‐reveal‐arson‐not‐a‐major‐cause/11855022 (accessed 16 Jan 2020)
Rawsthorne, S. 2020. Legal action taken against 183 people this bushfire season.
https://www.smh.com.au/national/nsw‐fires‐legal‐action‐taken‐against‐183‐people‐this‐
bushfire‐season‐20200106‐p53p97.html (accessed 16 Jan 2020)
Ross, D. & Reid, E. 2020. Firebugs fuelling crisis as arson arrest toll hits 183. The Australian, 7 Jan
2020. https://amp.theaustralian.com.au/nation/bushfires‐firebugs‐fuelling‐crisis‐asarson‐
arresttollhits183/news‐
story/52536dc9ca9bb87b7c76d36ed1acf53f?__twitter_impression=true
Su, J., Lian, T., Zhang, R., & Chen, D. 2018. Monitoring the pendulum between El Niño and La Niña
events. Environmental Research Letters, Volume 13, Number 7
Wang, G., Cai, W., & Santoso, A. 2017. Assessing the Impact of Model Biases on the Projected
Increase in Frequency of Extreme Positive Indian Ocean Dipole Events, Journal of Climate, doi:
1175/JCLI‐D‐16‐0509.1
14Willis, M. 2004. What is arson?. Bushfire arson bulletin no. 1. Canberra: Australian Institute of
Criminology. https://aic.gov.au/publications/bfab/bfab001
15You can also read