Climate futures for tasmania - ACE CRC
←
→
Page content transcription
If your browser does not render page correctly, please read the page content below
project acknowledgements
    ACE
       CRC

ANTARCTIC CLIMATE
& ECOSYSTEMS CRC          climate futures for tasmania
                                          THE SUMMARY & TECHNICAL REPORT

                                                        Future Fire Danger
                    Fox–Hughes P, Harris RMB, Lee G, Jabour J, Grose MR,
                                                Remenyi TA & Bindoff NL

                                                                      October 2015

                         climate futures for tasmania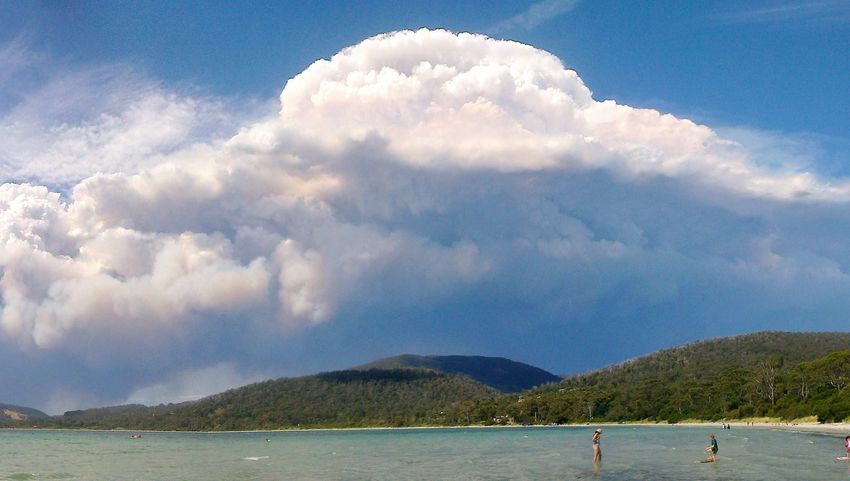
Climate Futures for Tasmania
Future Fire Danger – The Summary and The Technical Report
ISBN (print): 978–1–86295–764–0
ISBN (on–line): 978–1-86295–763–3
© Copyright The Antarctic Climate & Ecosystems Cooperative Research Centre 2015.
This work is copyright. It may be reproduced in whole or in part for study or training purposes subject to the inclusion
of an acknowledgement of the source, but not for commercial sale or use. Reproduction for purposes other than those
listed above requires the written permission of the Antarctic Climate & Ecosystems Cooperative Research Centre.
Requests and enquiries concerning reproduction rights should be addressed to:
Public Affairs Manager
Antarctic Climate & Ecosystems Cooperative Research Centre
Private Bag 80
Hobart Tasmania 7001
Tel: +61 3 6226 7888, Fax: +61 3 6226 2440
Email: climatefutures@acecrc.org.au
The Future Fire Danger research was undertaken primarily for the Tasmania State Emergency Service, through the Natural
Disaster Resilience Programme and the Tasmanian Fire Research Fund (representing Parks and Wildlife Service, Forestry Tasmania
and the Tasmania Fire Service).
Citation
Fox–Hughes P, Harris RMB, Lee G, Jabour J, Grose MR, Remenyi TA & Bindoff NL (2015) Climate Futures for
Tasmania future fire danger: the summary and the technical report, Antarctic Climate & Ecosystems
Cooperative Research Centre, Hobart, Tasmania.
Disclaimer
The material in this report is based on computer modelling projections for climate change scenarios and, as such, there
are inherent uncertainties in the data. While every effort has been made to ensure the material in this report is accurate,
Antarctic Climate & Ecosystems Cooperative Research Centre (ACE) provides no warranty, guarantee or representation that
material is accurate, complete, up to date, non–infringing or fit for a particular purpose. The use of the material is entirely at
the risk of a user. The user must independently verify the suitability of the material for their own use.
To the maximum extent permitted by law, ACE, its participating organisations and their officers, employees, contractors
and agents exclude liability for any loss, damage, costs or expenses whether direct, indirect, consequential including loss
of profits, opportunity and third party claims that may be caused through the use of, reliance upon, or interpretation of the
material in this report.
Peer Reviewed and Published
The research included in this report has been published in the following peer reviewed journals.
Fox–Hughes P, Harris RMB, Lee G, Grose M & Bindoff N (2014) Future fire danger climatology for Tasmania, Australia,
using a dynamically downscaled regional climate model. International Journal of Wildland Fire. 23(3) 309–321
http://dx.doi.org/10.1071/WF13126.
Grose MR, Fox-Hughes P, Harris RMB & Bindof, NL (2014) Changes to the drivers of ire weather with a warming climate — a
case study of southeast Tasmania. Climatic Change, 124, 255–269.
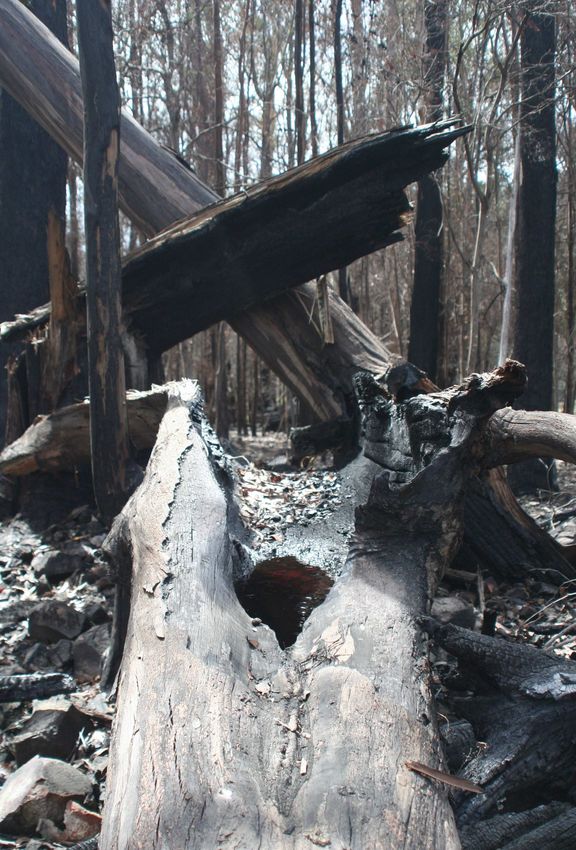
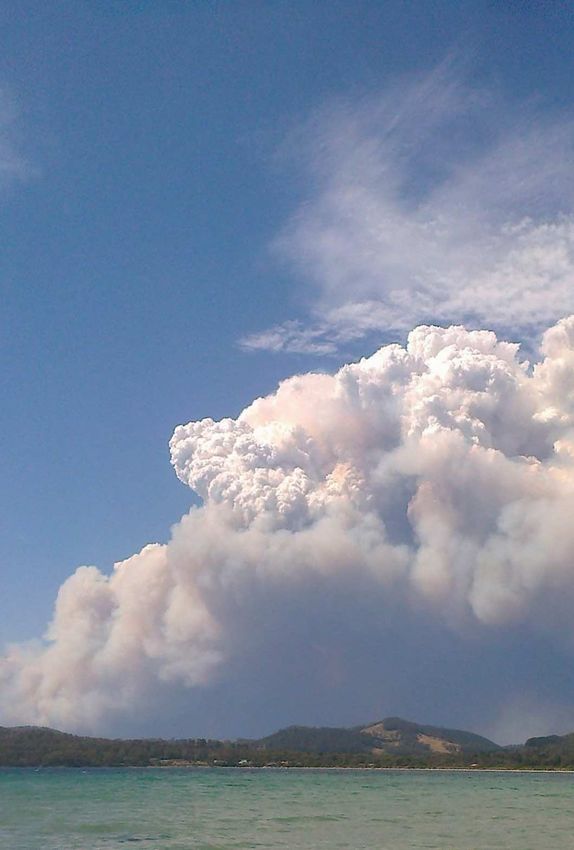
Photo Credits Janice James (coverpage, p 8), Suzie Gaynor (pp 2, 20/21), Chelsea Lee Brown (p 4),
Ian Stewart (pp 6, 18/19), Jon Marsden–Smedley (p 13), Kelvin Barrett (p 28)
Graphic Layout Suzie Gaynor
climate futures for tasmania
THE SUMMARY

                                              Climate Futures for Tasmania:
                                                         future ire danger

Fox–Hughes P, Harris RMB, Lee G, Jabour J, Grose MR, Remenyi T & Bindof NL

                                                                October 2015

               climate futures for tasmania
foreword

                               Foreword

South–eastern Australia is one of the three most ire–prone areas in the world and
Tasmanians know only too well the ravages of bushires on communities. The 2012
Tasmanian State Natural Disaster Risk Assessment highlighted ire driven by changing
weather and climate as one of the natural hazards most likely to cause signiicant
damage and cost to Tasmania.

Building on the existing high quality ine–scale climate information and the capacity
of the Climate Futures for Tasmania project, the Future Fire Danger study examined
changes in bushire meteorology and ire danger hazards and risks. A unique aspect
of the study was to understand the changes in the risk of ire danger in Tasmania and
to provide this information to the ire agencies that help communities prepare for
emergencies.

The projections indicate a steady increase in ire danger, especially in spring; a
lengthening of the ire season; and more days at the highest range of ire danger.
The consequences of increased ire danger have social and political implications;
inluencing the pace and direction of ire policy, logistics and funding; alerting
and acknowledging the need to build capacity in and among at–risk communities
(community resilience); and giving communities time to adapt to lost or changing
ecosystems.

With a projected increase in the number of total ire ban days, then, we must prepare.
This study provides the Tasmanian Government with the best available scientiic
evidence for our bushire management planning. The report contains the information
for our ire agencies to conidently prioritise and develop future bushire preparation
strategies.

Led by Professor Nathan Bindof and authored by Dr Paul Fox–Hughes and his
colleagues from the University of Tasmania, this collaborative study has demonstrated
innovative leadership by involving and engaging stakeholders on all levels. Tasmania’s
ire agencies have been actively involved with the research from the beginning, guiding
the research questions. The outputs from the study are strong and robust, meaning the
research is directly applicable to our decision–making processes.

Tasmanian communities will beneit from this study into future ire danger and all those
involved in the research are congratulated for their valuable contribution to emergency
management in Tasmania.

Gavin Freeman
Acting Chief Oicer
Tasmania Fire Service

                                  future ire danger   •   3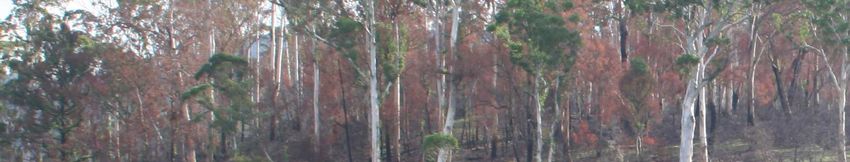
fut               er
   u   re ire dang

        Fire danger in Tasmania: the next 100 years
        Fire danger has increased in recent decades, and is projected to increase further with global
        warming. We assessed the regional changes in ire danger that are projected to occur in Tasmania
        through to 2100 under a high emissions scenario.
        In contrast with previous continental–scale studies which show little change in Tasmanian ire
        danger, our results indicate an overall increase in ire danger, especially in spring, with more days
        per year likely to require total ire bans. This increase in ire danger will have social and political
        implications.
        Projected changes to extreme weather events
        More extreme events have been recorded over the latter half of the 20th century, coinciding with
        changes to climate over that time. Higher maximum and minimum temperatures, more hot days
        and fewer cold days, and more intense rainfall events have all been observed and are expected to
        increase with future climate change.
        The Intergovernmental Panel on Climate Change (IPCC), in its ifth assessment report (AR5),
        concluded with high conidence that climate change would lead to increases in the number of
        days with very high and extreme ire weather. The greatest increase is expected in regions where
        ire is not limited by the availability of fuel, such as in southern Australia. The IPCC identiied
        increased ire weather, along with complex impacts on vegetation and biodiversity changes, as
        a key risk from climate change to people, property, infrastructure, ecosystems and native species.
        The aim of the Future Fire Danger Project was to understand the changing risk of ire danger in
        Tasmania. This study builds on the scientiic knowledge, ine–resolution climate simulations and
        the communication network generated by Climate Futures for Tasmania.
        The study used observations and models to examine changes in ire danger over recent decades,
        then used climate model projections, including high–resolution simulations for Tasmania, to
        assess projected changes of ire risk in the future.

                               ate i n fo rmation for local communitie
              loca     l cli m                                         s

                                                  future ire danger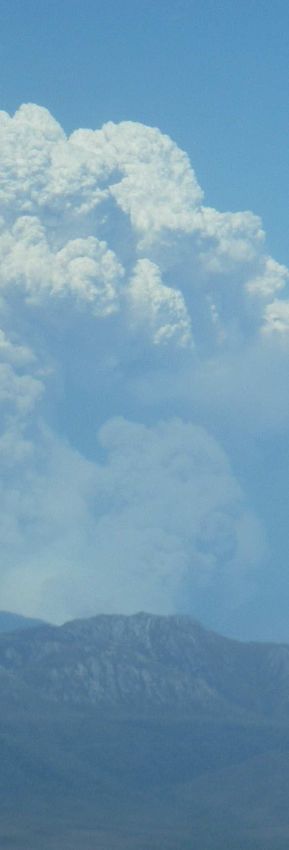
the summary
                                                       • We now have ine–scale ire danger
What the science says...                                 projections for Tasmania to 2100 under a
The best available scientiic evidence suggests           high emissions scenario.
the following changes by the end of the century:       • The projections indicate:
•   The type of strong weather system that
                                                                –> a steady increase in ire danger,
    brings the majority of the worst ire weather                   especially in spring;
    days to south–east Tasmania is projected to
    become more frequent.                                       –> a lengthening of the ire season;
•   The total number of days per year                           –> more days at the highest ire danger
    categorised as ‘Very High Fire Danger’ is                      ratings at some locations.
    projected to increase by at least 120%. In
    the future, this is about a 10% per decade
    increase to 2100.
•   Projected changes show strong regional and seasonal variations. Regions currently with the
    greatest risk of ire are projected to get worse most rapidly.
•   The area of Tasmania under ‘Total Fire Ban’ conditions during summer due to ire weather is
    projected to increase by at least 75%. This is a 6% increase per decade.
•   The average area of Tasmania in spring categorised as ‘Very High Fire Danger’ is projected to
    increase by at least 250%. This is a 20% increase per decade.
•   There is no major change to the ire danger risk in autumn.
•   The analysis suggests that all projections could be conservative estimates of future changes.

                                        future ire danger   •   5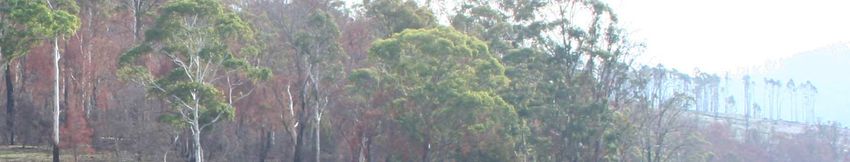
fut               er
   u   re ire dang

        Increase in total ire ban days
        There is an increase in both average and extreme (99th percentile) Forest Fire Danger Index
        projected through the century. The rates of change vary across Tasmania and are diferent in each
        season. Most notably there is an increase in high ire danger days projected to occur in spring.
        There is also a projected increase in the frequency of the weather systems associated with many
        of the most severe ire weather events, and increases to other large–scale drivers of ire risk, as well
        as projected increases in soil dryness.
        Taken together, all these factors provide a consistent story of increasing ire weather risks through
        the 21st century. This increase in risk factors will underlie the ongoing year–to–year and decade–
        to–decade variability of ire weather events in Tasmania.
        Given the expected shorter return periods of bushire events, emergency services may need to
        plan for more rapid repair of vital infrastructure and recovery of personnel to meet these increased
        risks.
                                                                           Projected Frequency of the ‘Very High Fire Danger Days’
                                                                                            from 1961 to 2100
                                                                           99
                       Days per year of at least ‘Very High Fire Danger’

                                                                           88

                                                                           77

                                                                           66

                                                                           55
                                                                                                                    Present
                                                                                                                  Present

                                                                           44
                                                                                1960       1980       2000       2020            2040   2060      2080      2100
                                                                                                                            Years
                                                                                Smoothed projection of the number of days per year categorised as at least ‘Very
                                                                                High Fire Danger’ from 1961 to 2100. Forest Fire Danger Index values will increase
                                                                                into the future, with the majority of the increase after 2050.

                            m ate in                                                      formation for local communities
                    l c l i
            l   oca

                                                                                                             future ire danger
the summary
                                                                • Climate Futures for Tasmania is the most
Modelling future climate                                          complete regional climate change study
Global climate models provide the best                            of Tasmania for the 21st century.
estimates of change to our climate to the
end of the 21st century. Recent advances in                     • We used dynamical downscaling to
climate modelling techniques have enabled                         generate climate projections over
simulations of extreme climatic events at                         Tasmania at a iner scale than ever before.
regional scales, like Tasmania.                                 • We simulated the complex processes that
                                                                  inluence Tasmania’s weather and climate,
Greenhouse emissions scenario
                                                                  providing a detailed picture of Tasmania’s
Climate Futures for Tasmania simulated future                     future climate.
climate with six downscaled global climate
models. Reported in this study is the A2 (high                  • The dynamical downscaling used in the
greenhouse emissions) scenario from the                           project is an established technique that
Intergovernmental Panel on Climate Change’s                       uses input from global climate models
Special Report on Emissions Scenarios.                            to generate high–resolution climate
                                                                  simulations.
Dynamical Downscaling
                                                                • The successful validation of the climate
Global climate model output at a resolution                       simulations      gives    conidence     in
of 200 km to 300 km is too coarse for                             projections of future temperature and
understanding changes in extreme events that                      rainfall, and their use to analyse changes
occur at a relatively small spatial scale and short               in extreme weather events.
durations.
In Climate Futures for Tasmania, the global climate model output was used in another climate model
(CSIRO’s Cubic Conformal Atmospheric Model) to create ine–scale regional climate information.
This process is called downscaling. Six global climate models were downscaled to a resolution of
0.1 degree (approximately 10 km). The results are presented as the mean of the six simulations,
and the changes were assessed against the reference, or baseline, period of 1961–1980.
Bias–adjustment
All climate model simulations contain some intrinsic biases. Biases are errors that typically
occur consistently and predictably. Often these biases are caused by the model’s resolution. For
example, the 10 km resolution of the Climate Futures for Tasmania simulations means that steep
ridgelines may not be captured, resulting in the rain shadow on the downwind side of the ridge
being under–estimated.
Most climate simulations therefore need to be ‘bias‑adjusted’. This is a standard scientiic method
for handling consistent diferences between observations and simulations. Temperature and
rainfall were bias–adjusted against observations from recent years in the Australian Water
Availability Project (AWAP*) dataset. Wind and relative humidity were not bias–adjusted because
these variables were not available in the AWAP dataset.

* AWAP is the Australian Water Availaibilty Project, a joint project between CSIRO and the Bureau of Meterology.

                                                future ire danger   •   7
climate futures for tasmania
THE TECHNICAL REPORT

                                              Climate Futures for Tasmania:
                                                         future ire danger

Fox–Hughes P, Harris RMB, Lee G, Jabour J, Grose MR, Remenyi T & Bindof NL

                                                                October 2015

               climate futures for tasmania
deinitions of key terms
Climate prediction
A climate prediction, or climate forecast, is an attempt to produce a description or estimate of the
most likely actual evolution of the climate in the future (for example, at seasonal, interannual, or
long–term time–scales). A prediction is a probabilistic statement that something will happen in
the future based on what is known today.
Climate projection
A climate projection is a model–derived description of possible future climates under a given
set of plausible scenarios of climate forcings. Climate projections are distinguished from climate
predictions to emphasise that climate projections depend upon the emission/concentration/
radiative forcing scenario used, which are based on assumptions about future socio–economic and
technological developments that are subject to substantial uncertainty. A projection is therefore a
probabilistic statement of what could happen if certain assumed conditions prevail in the future.
Climate scenario
A plausible and often simpliied representation of the future climate, based on an internally
consistent set of climatological relationships, that has been constructed for explicit use in
investigating the potential consequences of anthropogenic climate change, often serving as input
to impact models. Climate projections often serve as the raw material for constructing climate
scenarios, but climate scenarios usually require additional information such as observations of
current climate. A ‘climate change scenario’ is the diference between a climate scenario and the
current climate.
A2 emissions scenario
In the Fourth Assessment Report (AR4), the IPCC addressed the uncertainty about future rates of
greenhouse gas and aerosol emissions using emissions scenarios. The A2 scenario is one of the
four socio–economic scenario families in the Special Report on emissions Scenarios (SRES) set
(A1, A2, B1, and B2), each of which results in alternative levels of greenhouse gas emissions in the
future.
The A2 emissions scenario assumes a world of independently operating, self–reliant nations
in which population continues to increase. Economic development is regionally oriented and
economic and technological development is relatively slow, compared to the other story lines.
This results in global emissions at the higher end of the SRES emissions scenarios (but not the
highest).
Deinitions developed from IPCC AR5 Report:
http://ipcc‑wg2.gov/AR5/images/uploads/WGIIAR5‑Glossary_FGD.pdf
future ire danger • 10table of contents
Table of Contents
Foreword .......................................................................................................................................3
THE SUMMARY ..............................................................................................................................4
Fire danger in Tasmania: the next 100 years ...................................................................................... 4
What the science says ............................................................................................................................ 5
Increase in total ire ban days............................................................................................................... 6
Modelling future climate....................................................................................................................... 7
THE TECHNICAL REPORT ..............................................................................................................9
Deinitions of Key Terms ............................................................................................................10
Frequently Used Abbreviations ................................................................................................11
1 Future Fire Danger Project......................................................................................................12
About Climate Futures for Tasmania .............................................................................................................13
2 Results ......................................................................................................................................14
2.1 Cumulative Forest Fire Danger Index (FFDI) .........................................................................................14
2.2 High Fire Danger Days ...............................................................................................................................16
2.3 Synoptic Drivers of Particularly Dangerous Days.................................................................................20
2.4 Trends in Soil Moisture ..............................................................................................................................22
2.5 Validation and Limitations........................................................................................................................22
3 Conclusions ..............................................................................................................................26
References ...................................................................................................................................27
FREQUENTLY USED ABBREVIATIONS
Fourth Assessment Report (IPCC) AR4
Fifth Assessment Report (IPCC) AR5
Australian Water Availability Project AWAP
Cubic Conformal Atmospheric Model CCAM
Carbon Dioxide CO2
Cumulative Forest Fire Danger Index ∑FFDI
Forest Fire Danger Index FFDI
Global Climate Model GCM
Intergovernmental Panel on Climate Change IPCC
Mean Sea Level Pressure MSLP
National Center for Atmospheric Research NCAR
National Centers for Environmental Prediction NCEP
Soil Dryness Index SDI
Special Report on Emissions Scenarios (IPCC) SRES
Tasmanian Partnership for Advanced Computing TPAC
future ire danger • 111 Future Fire Danger Project
The 2012 Tasmanian State Natural Disaster Risk The modelled timeseries was separated into
Assessment assessed the risk to Tasmanian 20–year periods to quantify the changes in Forest Fire
communities from natural hazards, including loods, Danger Index into the future compared to historical
bushires, landslides, severe storms, tsunamis and conditions. Results are presented for three periods
earthquakes. The assessment aimed to improve of interest, the historical period (1961–1980), the
state emergency preparedness across Tasmanian intermediate period (2041–2060), and the future
communities and regions. Bushires were identiied period (2081–2100). Comparing the relative change
as being one of the top two most signiicant hazards of historical–to–present and historical–to–future
in Tasmania, along with looding. provides context and scale.
The Future Fire Danger Project was therefore The Tasmania Fire Service usually invokes a ‘Total Fire
initiated by the Tasmania State Emergency Service, Ban’ when the FFDI is forecast to equal or exceed 38.
through funding from the Natural Disaster Resilience This recognises that the diiculty of suppressing a
Programme and the Tasmanian Fire Research Fund. ire is heightened by weather conditions such as high
The research used the climate projections generated temperature, strong wind and low relative humidity.
by the Climate Futures for Tasmania project, and Bans might apply to the whole state or only to
interpreted the new information to meet the needs of speciic regions. Analyses of FFDI were produced for
Tasmanian emergency services and ire agencies, in the Bureau of Meteorology weather forecast districts
collaboration with the Tasmanian State Government. which are of most relevance to the operations of the
Bureau and Tasmania Fire Service (Figure 1).
The Climate Futures for Tasmania projections
provided information about relevant processes at an This report summarises some of the key indings of
appropriate temporal and spatial scale for Tasmania. the project, which have been subject to the peer
This enabled seasonal and annual changes in ire review process and published in the international
danger to be identiied, as well as changes in the scientiic literature (Fox–Hughes et al. 2014 and
synoptic climatology associated with ire weather in Grose et al. 2014), including the results of models
diferent regions of Tasmania under future climate projecting cumulative Forest Fire Danger Index; the
conditions. This report summarises the results under synoptic drivers of particularly dangerous days; and
the A2 emissions scenario through to 2100. trends in soil moisture. Limitations and validation of
these ire indices are summarised at the end of the
Fire danger was described using the McArthur report.
Forest Fire Danger Index (FFDI), a standard index Forecast Districts Studied
used by weather forecasters and ire services in
eastern Australia to determine ire hazard and make
operational decisions around ire management. The
FFDI incorporates surface air temperature, relative Tasmania
humidity and wind speed, combined with an
estimate of fuel dryness (Drought Factor, based on
Soil Dryness Index and recent precipitation) to give
an index of daily ire danger.
North
East
Daily values of McArthur Forest Fire Danger Index
were generated at 10 km resolution over Tasmania, East
Central Coast
for the period 1961–2100. The project then examined
patterns of mean sea level pressure and synoptic Plateau
drivers of particularly high ire danger days. Together,
Midlands
these analyses gave an understanding of the weather Western
patterns associated with the worst ire danger
periods in the past (from 1961) and gave us the ability
to project ire danger into the 21st century.
Upper Derwent
Valley
Figure 1 The Bureau of Meteorology weather forecast districts used in this study to provide
a rough transect of Tasmania. The area within each district has a broadly similar
climate. Un–labelled districts were not considered in the current study.
future ire danger • 12About Climate Futures for Tasmania Climate Futures for Tasmania is the Tasmanian Government’s most important source of climate change data at a local scale. It is a key part of Tasmania’s climate change strategy as stated in the Tasmanian Framework for Action on Climate Change and is supported by the Commonwealth Environment Research Facilities as a signiicant project. The project is unique in Australia. It was designed from conception to understand and integrate the impacts of climate change on Tasmania’s weather, water catchments, agriculture and climate extremes, including aspects of sea level, loods and wind damage. In addition, through complementary research projects supported by the project, new assessments were made of the impacts of climate change on coastal erosion, biosecurity and energy production, and new tools developed to deliver climate change information for infrastructure asset managers and local government. Climate Futures for Tasmania used data from six global climate simulations under the A2 emissions scenario. The global climate models were downscaled to a higher spatial resolution by including more localised information about Tasmanian weather systems. This downscaling enabled the project to obtain projections of Tasmanian climate on grids of approximately 10 km resolution at daily time steps through to 2100. The iner resolution captures regional variation in climate processes and the climate change signal. This is particularly valuable for understanding climate responses in Tasmania, which has a complex topography and coastline, and a range of regional climate inluences. The Climate Futures for Tasmania project complements climate analyses and projections done at the continental scale for the Fourth Assessment Report from the Intergovernmental Panel on Climate Change, at the national scale in the Climate Change in Australia report and data tool, as well as work done in the south–east Australia region in the South Eastern Australia Climate Initiative. The work also complements projections done speciically on water availability and irrigation in Tasmania by the Tasmania Sustainable Yields Project.
2 Results

2.1 Cumulative Forest Fire Danger Index
The Cumulative Forest Fire Danger Index is the sum                           already subject to a higher Cumulative Forest Fire
of the daily maximum Forest Fire Danger Index across                         Danger Index (that is, the East Coast, Midlands
one year (July to June), incorporating a single ire                          and Upper Derwent Valley). The values for future
season. Higher values indicate more days of high ire                         Cumulative Forest Fire Danger Index represent close
danger relative to other years or regions (Figure 2 and                      to a 30% increase on 1961–1980 values.
Figure 3). An increase in the Cumulative Forest Fire
Danger Index can be interpreted as an increase in the                        The rate of change per decade and the variation
potential incidence and/or severity of bushire.                              across districts and between models is shown in
                                                                             Figure 3. The trend of the projections is distinctly
There is an increase in Cumulative Forest Fire Danger                        positive, despite annual variations, in all weather
Index across Tasmania, as seen in Figure 2(c). The                           forecast districts studied.
evidence points to an increase in Cumulative Forest
Fire Danger Index in all regions during the next
century, with the greatest increase in those districts

                                                                                          FFDI from 1961−2000 to 2081−2100

                    The Change in Cumulative Forest Fire Danger Index
                    FFDI 1961−2000

 (a) Cumulative Forest Fire Danger Index
                                                                                      (c) Increase in the
               1961–1980
                                                                              Cumulative Forest Fire Danger Index
                                                                                  1961–1980 to 2081–2100

                                       FFDI 2081−2100

                 (b) Cumulative Forest Fire Danger Index
                               2081–2100

                       00             500
                                     500                 1000
                                                        1000          1500
                                                                     1500               2000
                                                                                       2000        2500
                                                                                                  2500          3000
                                                                                                               3000
                                                        Cumulative Forest Fire Danger Index
  Figure 2     Multi–model mean Cumulative Forest Fire Danger Index values across Tasmania, averaged over
               (a) 1961–1980 and (b) 2081–2100 with (c) presenting the expected increase in Cumulative
               Forest Fire Danger Index from 1961–1980 to 2081–2100. The most rapid increases in Cumulative
               Forest Fire Danger Index (about a 30% increase on 1961–1980 values) are in the regions that
               already have the highest values: the East Coast, Midlands and Upper Derwent Valley.

                                                         future ire danger    •   14
results
Table 1
Conversion: Number of days per year to Percentile
1 day per year 99.7th Percentile
2 days per year 99.5th Percentile
3.65 days per year 99.0th Percentile
5 days per year 98.7th Percentile
10 days per year 97.3th Percentile
18.25 days per year 95.0th Percentile
90 days per year (that is, most of summer) 75.4th Percentile
The Change in Cumulative Forest Fire Danger Index
Bureau of Meteorology Forecast Districts
Upper Derwent
Western North East Central Plateau East Coast Midlands
Valley
2000
1500
Cumulative FFDI
1000
500
2000
2050
2000
2050
2000
2050
2000
2050
2000
2050
2000
2050
Time (decade)
Figure 3 Cumulative Forest Fire Danger Index for the six regional climate models in this study, averaged
by Bureau of Meteorology weather forecast district and by each decade from 1960 to 2090. Solid
black line highlights the general trend, where a steeper slope indicates more rapid increase in
Cumulative Forest Fire Danger Index values. All regions exhibit an increase in Cumulative Forest
Fire Danger. The most rapid increases in Cumulative Forest Fire Danger Index (about a 30%
increase on 1961–1980 values) are in the regions that already have the highest values: the East
Coast, Midlands and Upper Derwent Valley.
future ire danger • 152.2 High Fire Danger Days
The projections of Forest Fire Danger Index (FFDI) show was ‘Very High’ in 31% of the state. This is projected to
signiicant increases in the area of Tasmania experiencing increase to 36% by mid–century (2041–2060) and 46%
very high and extreme levels of ire danger. Table 4 by the end of the century (2081–2100) (Table 3). This
shows how FFDI values are related to the Fire Danger means that in the next 30–50 years the area of land
Ratings that are commonly used for bushire warnings which represents the greatest risk and requires the most
and community information. Fire Danger Ratings above intensive ire management could increase by 16%. There
Very High Fire Danger indicate conditions when ires may is considerable regional variation across the state, and the
be impossible to control, due to their intensity and rapid overall pattern is maintained through time. The region of
spread. The change in ire danger varies across regions signiicant ire danger in the southeast gradually expands
and in diferent seasons (see Table 2 and Figure 4). north through the lowlands and along the east coast.
We use the 95th and 99th percentiles to describe changes In recent decades, east and south–east Tasmania has
to the extremes of the Forest Fire Danger Index. Percentiles experienced an increase in the number of dangerous ire
indicate the value below which a given percentage of weather events in spring but not in autumn. Projected
observations fall. For example, the 95th percentile is the increases in the 99th percentile FFDI are consistent with
value below which 95% of the observations were found, these recent trends, showing an increase in spring but
or the highest 5% of daily FFDI values. The 95th percentile not autumn (Figure 4). The projections show that the ire
value is likely to be experienced approximately once season will begin earlier and last longer. The projected
every three weeks, on average, during the ire season. The increase in spring FFDI is greater than the increase in
conversion table translates days per year into percentiles summer, which is quite modest until the latter part of the
(Table 1). century. This consistency with recent trends suggests that
observed changes are driven by climate change and we
The annual values for 95th and 99th percentile FFDI can expect a continuation of these trends as the climate
are seen in Figure 5. In the 1961–1980 baseline period changes further.
the 99th percentile value of FFDI during the ire season
Table 2 Proportion of Tasmania exceeding Forest Fire Danger Index (FFDI) thresholds during different
seasons. The Tasmania Fire Service usually declares Total Fire Bans at FFDI 38 or higher, but
may declare them at other thresholds if circumstances demand.
1961–1980 2041–2060 2081–2100
Afected Afected Increase from Afected Increase from
Area Area 1961–1980 Area 1961–1980
Spring 51% 64% 25% 77% 51%
FFDI ≥ 12 Summer 98% 98% 0% 99% 1%
(HIGH) Autumn 53% 61% 15% 72% 36%
Winter 1% 2% 100% 6% 500%
Spring 6% 13% 117% 21% 250%
FFDI ≥ 25 Summer 43% 49% 14% 65% 51%
(VERY HIGH) Autumn 0% 0% 0% 0% 0%
Winter 0% 0% 0% 0% 0%
Spring 0% 0% 0% 0% 0%
FFDI ≥ 38
Summer 8% 9% 13% 14% 75%
(TOTAL FIRE
Autumn 0% 0% 0% 0% 0%
BAN)
Winter 0% 0% 0% 0% 0%
future ire danger • 16results
Change in the Forest Fire Danger Index 99th Percentile Values
1961–1980 2041–2060 2081–2100
Spring Spring Spring
Summer Summer Summer
Autumn Autumn Autumn
Winter Winter Winter
0 10 20 30 40 50
Forest Fire Danger Index
Figure 4 The 99th (3 days each year) percentile Forest Fire Danger Index values during each season
at each location (grid cell) across Tasmania during the periods 1961–1980; 2041–2060
and 2081–2100. Spring exhibits a much greater increase in the 99th percentile values in
comparison to other seasons. This indicates an earlier start to the ire season by 2081–2100.
future ire danger • 17Change in the Forest Fire Danger Index
95th and 99th Percentile Values
95th Percentile 99th Percentile
1961–1980 1961–1980
2041–2060 2041–2060
2081–2100 2081–2100
5 10 15 20 25 30 35 40 45
Forest Fire Danger Index
Figure 5 The 95th and 99th (3 days each year) percentile Forest Fire Danger Index annual values at each location
(grid cell)across Tasmania during the periods 1961–1980; 2041–2060 and 2081–2100. These percentiles
represent values that would occur 18 and 3 days each year (95th and 99th percentiles respectively). There
is signiicant regional variability, with the highest 95th and 99th percentile values observed in the south–
east corner of Tasmania, which are associated with those regions that are known to be at higher risk of
bushire. The regional pattern does not change very much into the projected future, although the 95th and
99th percentile values do increase over time.
future ire danger • 18results
Table 3 Proportion of Tasmania exceeding Forest Fire Danger Index (FFDI) thresholds during the ire
season (October–March). Total Fire Bans can be declared at values lower than 38. Percentiles
relate to the frequency of FFDI values of equal or greater severity. The 95th is equivalent to
at least 18 events per year and the 99th is equivalent to at least 3 events per year.
Percentile 1961–1980 2041–2060 2081–2100
Afected Afected Increase from Afected Increase from
Area Area 1961–1980 Area 1961–1980
FFDI ≥ 12 95th 56% 64% 14% 79% 41%
(HIGH) 99th 96% 97% 1% 99% 3%
FFDI ≥ 25 95th 2% 4% 100% 9% 35%
(VERY HIGH) 99th 31% 36% 16% 46% 48%
FFDI ≥ 38 95th 0% 0% NA 0% NA
(TOTAL FIRE BAN) 99th 2% 3% 50% 6% 200%
Table 4 Conversion of Forest Fire Danger Index to Fire Danger Ratings
Conversion: ‘Forest Fire Danger Index’ to ‘Fire Danger Rating’
Forest Fire Danger Index Fire Danger Rating
0–11 Low–Moderate
12–24 High
25–49 Very High
TOTAL FIRE BAN
≥ 38
in Tasmania
50–74 Severe
75–99 Extreme
>100 Catastrophic
future ire danger • 192.3 Synoptic drivers of particularly dangerous days
The previous sections discussed projections of ire The ire weather events associated with high ire
danger based on the Forest Fire Danger Index (FFDI). danger days were identiied within three diferent
To understand the processes behind days of very high models, the National Centres for Environmental
FFDI, and assess potential changes in ire weather into Prediction model (NCEP), the Australian Water
the future, the synoptic weather patterns associated Availability Project model (AWAP) and the Climate
with high ire danger in Tasmania were also examined, Futures for Tasmania model. This comparison was
and future changes to these were assessed. used to assess the inter–model variability, and validate
the Climate Futures for Tasmania outputs against
First we tested whether there were any consistent observations. This successful validation allows for
synoptic weather patterns associated with extreme great conidence to be placed in the Climate Futures
ire danger (‘Severe’, ‘Extreme’ and ‘Catastrophic’ ire for Tasmania projections.
danger classiications) in Tasmania. We looked for
the presence of an atmospheric pattern associated The synoptic patterns identiied by Mills (2005) as
with many of the worst ires in south–east Australia being diagnostic for extreme ire weather were
and Tasmania, where a deep cold front with strong found to have been present during many of the
prefrontal winds brings hot, dry air down from the worst ires in Tasmania, including the ires on ‘Black
Australian continent over Tasmania. The presence of Tuesday’ on 7 February 1967 in south–east Tasmania,
such a weather pattern can be diagnosed by a strong the 12 February 1982 and the ires of 4 January 2013
gradient in temperature over Bass Strait and Victoria (Figure 6). The highest ire dangers in south–east
at 850 hPa. This test was devised by Mills (2005) Tasmania were also found to be associated with a
after examining the weather system present on Ash typical pattern of mean sea level pressure (Figure 8).
Wednesday, 1983.
Weather pattern on 04 January 2013 Bushires Kelvin (K)
Figure 6 A strong cold front that draws hot air down over Tasmania is associated with many of the
highest ire danger days. This was the case on the 4 January 2013 shown here, indicated by
the temperature (in Kelvin) of the atmosphere at 850 hPa level. Also shown is the box over
Victoria used to detect the strong gradient.
future ire danger • 20results
Weather patterns associated with
Secondly, we assessed whether these large–scale high Forest Fire Danger Index
weather patterns may change in the future. There
was considerable variability in the frequency of
these systems from decade to decade, and a range
in results from diferent climate models. However, we
found that the higher resolution of the downscaled
Kelvin (K)
simulations gave a more realistic depiction of these
systems than many GCMs, and represented the
observed patterns well.
The analysis identiied a clear signal that these
systems are projected to occur more frequently on
average, with an increase in frequency of at least 10%
by the end of the century. A steady increase in the Baseline: 1964–2002
temperature associated with extreme ire weather
was observed, indicating an increase in the severity
of these events. This can be seen in temperature at
850 hPa during these events from the past into the
future (Figure 7).
Kelvin (K)
The results add greater detail and understanding at
the regional scale, in support of previous studies that
suggest ire weather risks in Tasmania will increase in
response to changes in large–scale climate processes.
For example, areas burned in western Tasmania each
year show a correlation with rainfall in the preceding
October to March (Nicholls & Lucas 2007), and there 2022–2060
is a projected decrease in rainfall during this season.
Positive Indian Ocean Dipole (IOD), a large–scale
climate phenomenon in the Indian Ocean, can
pre–condition fuel for bushire, and the number of
positive IOD events is projected to increase.
Kelvin (K)
Overall, Climate Futures for Tasmania modelling
projections indicate an increase in the frequency and
the severity of ire weather events into the future.
Further, the magnitude of the temperature gradient
is maintained in future projections, indicating that
the synoptic pattern remains similar. These results
suggest that our current understanding of how
weather inluences ire danger and risk will remain 2062–2100
applicable into the future.
Figure 7 The air temperature at the 850 hPa level
during events of strong prefrontal winds and severe ire
weather in Tasmania modelled in periods in the past
and projected into the future. All the events in each
period are averaged to make a composite. Note that in
each period the strength of the temperature gradient
does not change markedly but the temperature of the
air mass increases.
future ire danger • 21The Soil Dryness Index for the East Coast District is
Modelled composite weather projected to increase in spring and summer by 2100
pattern associated with high (Figure 10). The trend for winter, however, is less clear,
Forest Fire Danger Index Values with several models showing little change over time,
and one model indicating a substantial increase by
1961–1980 the end of the century.
Similarly, there is a clear trend towards increasing
values of the Soil Dryness Index in all seasons over
time in the Central Plateau District, with a spread in
the strength of the trend in winter across the models.
1016
In the Western District, all models project an increase
in Soil Dryness Index in all seasons except winter,
when little change occurs.
1015
1014 These seasonal and regional patterns are consistent
with projections of rainfall and synoptic patterns
described in previous Climate Futures for Tasmania
1013
1011 reports.
10
2.5 Validation and Limitations
12
10
10
To check that the simulations were providing realistic
FFDI values, we calculated daily FFDI for the period
10
2002–2012 from observations from Tasmanian
09
Bureau of Meteorology Automatic Weather Stations.
We compared both the values and the spatial
Figure 8 Modelled composite mean sea level distribution of multi–model mean 99th percentile
pressure pattern for elevated Forest Fire FFDI with the observed values. The modelled
Danger Index in south–east Tasmania synoptic patterns associated with high ire danger
for 1961–1980. were also compared to those observed, to assess the
realism of model scenarios of high ire danger.
2.4 Trends in soil moisture
The multi–model mean ire danger validated well
The Soil Dryness Index is one component in the against observations for 2002–2012, with 99th
calculation of the drought factor, which is used to percentile ire dangers having the same distribution
estimate fuel dryness within the Forest Fire Danger and largely similar values to those observed over the
Index. It is also a useful index in its own right, used observational period. The models also reproduce the
as a broad indication of the lammability of diferent synoptic patterns associated with observed high ire
forest types. danger days, giving us conidence that the models
are correctly characterising the changes in ire
The Soil Dryness Index calculated here is based on a danger in Tasmania during this century.
constant value for ‘canopy class’, an indication of the
density of the current vegetation at the site where However, the modelled values of FFDI tend to
Soil Dryness Index is calculated. We used current underestimate the observed values (observations are
values because there is no widely agreed method for above the ‘observations equals modelled values’ line
projecting vegetation community changes through in Figure 11). This is at least partly due to the diferent
time in response to climate change. scales of the 10 km grid compared to the single
point location of the observations. Local and site
An indication of regional and seasonal variability scale processes can lead to higher peaks in variables
in the Soil Dryness Index is presented as the multi– such as wind speed compared to the average
model mean in Figure 9. The inter–model spread calculated over a 10 km grid. The diferences may
across regions and seasons is presented in Figure 9 also partly be due to a consistent underestimation
and Figure 10. Inter‑model variability presents a of some variables, such as wind, by the model. Wind
range of plausible futures. and relative humidity could not be bias–adjusted
because values of these variables were not available
Over time, for each season, in all regions and across in the gridded observational data. This suggests that
Tasmania, there is a trend towards higher Soil Dryness the projected ire danger may be a conservative
Index compared to the 1961–1990 baseline (Figure 9). estimate of the future.
This is one of the driving factors of increases in the
Forest Fire Danger Index.
future ire danger • 22results
Multi–Model Mean for Soil Dryness Index
1961–1990 2010–2039 2040–2069 2070–2099
Spring Spring Spring Spring
Summer Summer Summer Summer
Autumn Autumn Autumn Autumn
Winter Winter Winter Winter
0 20 40 60 80 100 120 140
Soil Dryness Index
Figure 9 Projected multi–model mean seasonal Soil Dryness Index in 30–year average
blocks. Higher values indicate an increased risk of ire (the Soil Dryness Index
is used as an input to calculate the Forest Fire Danger Index). Both spring and
summer were projected to exhibit the most rapid increases in Soil Dryness Index.
future ire danger • 23Comparison of Model Spread — Soil Dryness Index
Summer Winter
East Coast
Summer Winter
Central Plateau
Summer Winter
Western
Figure 10 Comparison of the model spread for the six different models which were used to
calculate average Soil Dryness Index over three Bureau of Meteorology forecast
districts (Western, Central Plateau and East Coast). Note different scales.
future ire danger • 24results
2.5 Validation and Limitations, cont.,
We have used FFDI as a general index of ire danger, and climate projections on page 10). The intention
based on a standard 12.5 tonnes/hectare of available of climate projections is not to make accurate
fuel. However fuel load is inluenced at the landscape predictions regarding the future state of the climate
scale by community structure and composition (for system at any given point in time, but to represent the
example grassland versus forest) and at more local range of plausible futures and establish the envelope
scales by vegetation growth rates, fuel age, structure that the future climate could conceivably occupy.
and composition, and rates of decomposition, which
afect the litter depth, structure and composition. The science underpinning this report was completed
prior to the release of the Fifth Report of the
A comprehensive calculation of site–speciic ire Intergovernmental Panel on Climate Change in
danger would require observations about particular 2014 (AR5). The results are based on climate models
regimes of fuel accumulation, past ire history, and SRES emissions scenarios used in the AR4
environmental factors such as slope and aspect and Coupled Model Intercomparison Project archive
variations in atmospheric stability. The extensive (CMIP3). However, the global temperature changes
empirical data this would require were not available projected in the more recent CMIP5 archive are
for this project. very similar to those in the CMIP3 archive once the
diferent scenarios are taken into account. Regional
Projecting future changes in fuel load is not feasible comparisons of projections from the CMIP5 and
even with such knowledge of current conditions, CMIP3 models have found surface temperature, wind,
because of the unknowable inluence of altered ire and rainfall patterns to be highly consistent between
regime (frequency, intensity and timing of ire) and the archives. The release of the CMIP5 archive models
plant growth, due to factors such as changing CO2 has therefore not made the CMIP3 models redundant.
levels. RCP8.5 projects a similar acceleration in temperature
to SRES A2, although median temperatures are
This report is based on climate projections and consistently higher in the RCP8.5.
therefore should not be interpreted as a prediction
of the future (see deinitions of climate predictions
Observed versus Modelled FFDI Values
for Automatic Weather Station Locations
Observed values obtained with Automatic Weather Stations
Observations are higher
than modelled values
Line: Observations equals Modelled Values
Modelled values at matching locations
Figure 11 Comparison of the multi–model mean of annual 99th percentile Forest Fire Danger Index with corresponding
values from automatic weather stations for the period 2002–2012. Modelled values agree well with
observations, but observed values tend to be higher than modelled values. This suggests the model is most
likely an underestimate of the Forest Fire Danger Index. Differences between observations and modelled
values can be attributed to the different spatial scales. Modelled data are an estimate of broad regions,
where an automatic weather station observes precise measurements at a single site.
future ire danger • 253 Conclusions
Analysis of observed datasets as well as the Climate The total number of days per year categorised as
Futures for Tasmania ine–scale modelling outputs ‘Very High Fire Danger’ , is projected to increase by at
were used to examine future ire danger in Tasmania least 120%. This is 10% per decade, compared to an
through the century (under a scenario of high increase of 10% over recent decades. Organisations
greenhouse gas emissions). Model outputs were with day–to–day operations in forested areas have
directly used in the calculation of Forest Fire Danger operational protocols that are triggered by thresholds
Index to produce results with realistic temporal and of indices such as the Forest Fire Danger Index or
spatial variability for the present climate. This gives the Fire Danger Rating. The number of days when
conidence that they produce useful projections of operations may be restricted per year is projected to
the future. double (Table 3 on page 19 and igure on page 6).
The modelled time series was separated into 20‑year The area of Tasmania categorised in spring as ‘Very
periods to quantify the projected changes in Forest High Fire Danger’, is projected to increase by at least
Fire Danger Index into the future compared to 250% by 2081–2100. This is about 20% per decade.
historical conditions. There were three major periods This indicates an earlier start to the annual ire season,
of interest; the historical period (1961–1980), the resulting in shorter preparation and recovery cycles.
intermediate period (2041–2060), and the future Modest increases were observed during the other
period (2081–2100). Comparing the relative change seasons.
of historical–to–intermediate and historica–to–future
provides context and scale. There is considerable regional variation around
Tasmania. Regions that currently experience the
The projected changes to regional–scale, synoptic– highest forest ire danger are projected to have the
scale and large–scale drivers of ire weather were also most rapid increase in future values of the Forest Fire
examined. There is projected to be more frequent Danger Index.
strong fronts that can bring severe ire weather to
Tasmania, with the increase largely driven by an Bushires already cause extensive damage and
increase in air temperatures. Regional efects such as concern in Tasmania. An increase in ire danger, or
channelling by topography are expected to continue, shifts in the frequency, intensity or timing of ires,
enhancing ire dangers in south–east Tasmania. will have widespread consequences for human
communities and natural systems. This study provides
The projected changes were used to generate a range supporting evidence for stakeholders to prioritise
of metrics of ire danger in Tasmania, all of which show and develop future bushire preparation strategies.
a projected increase. The metrics of greatest interest
include: the area of Tasmania under ‘Total Fire Ban’
conditions; the area of Tasmania in each Fire Danger
Rating category per season; the total number of days
per year categorised as ‘Very High Fire Danger’; the
change in Cumulative Forest Fire Danger Index; and
the regional diferences for each of these observed
around Tasmania.
The area of Tasmania under ‘Total Fire Ban’ conditions
during summer due to ire weather is projected to
increase by at least 75% to 2081–2100 under a high
emissions scenario. This is a 6% increase per decade,
compared to an increase of 13% over recent decades.
future ire danger • 26references
4 References
Fox–Hughes P, Harris RMB, Lee G, Grose M & Bindof NL (2014) Future ire danger climatology for Tasmania, Australia,
using a dynamically downscaled regional climate model. International Journal of Wildland Fire. 23(3) 309–321
http://dx.doi.org/10.1071/WF13126
Grose MR, Fox‑Hughes P, Harris RMB & Bindof, NL (2014) Changes to the drivers of ire weather with a warming
climate — a case study of south–east Tasmania. Climatic Change. 124, 255–269.
IPCC (2012) Managing the Risks of Extreme Events and Disasters to Advance Climate Change Adaptation. A Special
Report of Working Groups I and II of the Intergovernmental Panel on Climate Change [Field CB, V Barros,
TF Stocker, D Qin, DJ Dokken, KL Ebi, MD Mastrandrea, KJ Mach, G–K Plattner, SK Allen, M Tignor & PM Midgley
(eds.)]. Cambridge University Press, Cambridge, UK, and New York, NY, USA, 582 pp.
IPCC (2001) Contribution of Working Group I to the Third Assessment Report of the Intergovernmental Panel on
Climate Change. The Scientiic Basis. Cambridge University Press.
IPCC (2013) Climate Change 2013: The Physical Science Basis. Contribution of Working Group I to the Fifth Assessment
Report of the Intergovernmental Panel on Climate Change [Stocker TF, D Qin, G–K Plattner, M Tignor, SK Allen,
J Boschung, A Nauels, Y Xia, V Bex & PM Midgley (eds.)]. Cambridge University Press, Cambridge, United Kingdom
and New York, NY, USA.
IPCC (2014) Climate Change 2014: Impacts, Adaptation and Vulnerability. Part A: Global and Sectoral Aspects.
Contribution of Working Group II to the Fifth Assessment Report of the Intergovernmental Panel on Climate
Change [Field CB, VR Barros, DJ Dokken, KJ Mach, MD Mastrandrea, TE Bilir, M Chatterjee, KL Ebi, YO Estrada,
RC Genova, B Girma, ES Kissel, AN Levy, S MacCracken, PR Mastrandrea & LL White (eds.)]. Cambridge University
Press, Cambridge, United Kingdon and New York, NY, USA.
Mills G (2005) A re–examination of the synoptic and mesoscale meteorology of Ash Wednesday 1983. Australian
Meteorological Magazine. Vol 54, pp 35–55.
Nicholls N & Lucas C (2007) Interannual variations of area burnt in Tasmanian bushires: relationships with climate and
predictability. International Journal of Wildland Fire, 16:540–546.
Solomon S ed. Climate change 2007 – the physical science basis: Working group I contribution to the fourth assessment
report of the IPCC. Vol. 4. Cambridge University Press, 2007.
future ire danger • 27project acknowledgements
Project Acknowledgements
The Future Fire Danger research was undertaken primarily for the Tasmania State Emergency Service,
through funding from the Natural Disaster Resilience Programme and the Tasmanian Fire Research Fund
(TFRF). The TFRF receives contributions from the Tasmania Fire Service, the Parks and Wildlife Service and
Forestry Tasmania and provides support for research directly relevant to ire management in Tasmania.
The research used the climate projections generated by the Climate Futures for Tasmania project, and
in collaboration with the Tasmania State Government, interpreted the new information to meet the
needs of Tasmanian emergency services and fire agencies.
The research was led by Dr Paul Fox–Hughes in collaboration with the National Environmental
Research Programme’s Landscapes and Policy Hub. We are also grateful for the willing participation
and input from organisations with a stake in future fire danger, including the Tasmania State
Emergency Service, Tasmania Fire Service, Parks and Wildlife Service, Forestry Tasmania,
Aurora Energy, Tas Networks, Tasmania Climate Change Office, Tasmanian Office of Emergency
Management, State Emergency Management Committee, the Tasmania State Fire Management
Council and the University of Tasmania.
Climate Futures for Tasmania Acknowledgements
The Climate Futures for Tasmania project was funded primarily by the State Government of
Tasmania, the Australian Government’s Commonwealth Environment Research Facilities Programme
and Natural Disaster Mitigation Programme. The project also received additional funding support
from Hydro Tasmania.
Scientific leadership and contributions were made from a consortium of organisations including:
Antarctic Climate & Ecosystems Cooperative Research Centre, Tasmanian Department of Primary
Industries, Parks, Water and Environment, Tasmania State Emergency Service, Hydro Tasmania
Consulting, Geoscience Australia, Bureau of Meteorology, CSIRO, Tasmanian Partnership for
Advanced Computing, Tasmanian Institute of Agriculture and the University of Tasmania.
The generation of the Climate Futures for Tasmania climate simulations was commissioned by the
Antarctic Climate & Ecosystems Cooperative Research Centre (ACE CRC), as part of its Climate Futures
for Tasmania project. The climate simulations are freely available through the Tasmanian Partnership
for Advanced Computing digital library at www.tpac.org.au.
The intellectual property rights in the climate simulations belong to the Antarctic Climate &
Ecosystems Cooperative Research Centre. The Antarctic Climate & Ecosystems Cooperative Research
Centre grants to every person a permanent, irrevocable, free, Australia wide, non–exclusive licence
(including a right of sub–licence) to use, reproduce, adapt and exploit the Intellectual Property
Rights of the simulations for any purpose, including a commercial purpose.
Climate Futures for Tasmania is possible with support through funding and research of a consortium of
state and national partners (see back cover).
climate futures for tasmaniaYou can also read