RESEARCH Identification of potential invertebrate bioindicators of restoration trajectory at a quarry site in Hunua, Auckland, New Zealand - New ...
←
→
Page content transcription
If your browser does not render page correctly, please read the page content below
BowieZealand
New   et al.: Invertebrate
               Journal of Ecology
                           indicators
                                   (2019)
                                      of restoration
                                           43(1): 3360
                                                     success
                                                       © 2018 New Zealand Ecological Society.                                         1

                  RESEARCH

Identification of potential invertebrate bioindicators of restoration trajectory at a
quarry site in Hunua, Auckland, New Zealand

Mike H. Bowie1*, Erica Stokvis1, Keith Barber2, John Marris3 and Simon Hodge4
1
  Department of Pest Management & Conservation, Lincoln University, PO Box 85084, Lincoln 7647, New Zealand
2
  Winstone Aggregates, PO Box 17–195, Greenlane, Auckland 1546, New Zealand
3
  Bio-Protection Research Centre, PO Box 85084, Lincoln University, PO Box 85084, Lincoln 7647, New Zealand
4
  Future Farming Centre, Lincoln University, PO Box 85084, Lincoln 7647, New Zealand
*Author for correspondence (Email: mike.bowie@lincoln.ac.nz)

Published online: 21 December 2018

         Abstract: In 2009, the New Zealand company Winstone Aggregates initiated a restoration planting scheme
         to mitigate the ecological damage caused by mining at the Hunua Quarry, near Papakura, New Zealand. By
         employing several collection methods (pitfall traps, artificial cover objects, litter samples, weta motels), and
         comparing invertebrates found in the restoration area with those found in adjacent areas of mature forest and
         unplanted grassland, this study aimed to identify invertebrates that could be used as bioindicators of restoration
         trajectory. Multivariate analyses (NMDS, ANOSIM) indicated that the composition of some invertebrate
         assemblages (e.g. beetles, mites, springtails) may be used to determine whether assemblages in the restoration
         areas had converged towards those in the mature forest. The survey also identified specific taxa (e.g. cave weta,
         spiders) that were more abundant in, or exclusive to, the mature forest, and identified other groups (e.g. exotic
         earthworms, slugs, snails) that typified the grassland invertebrates. Thus, in future invertebrate assessments,
         an abundance of the former taxa, and lack of the latter, would provide an indication of restoration ‘success’,
         and assist in monitoring the trajectory of the invertebrate community from that found in the exotic grassland
         towards an assemblage more typical of the native forest habitat of this region.
         Keywords: bioindicators, ecological monitoring, invertebrate conservation, restoration success

Introduction                                                           considered, and not only the floral components that can be
                                                                       reinstated by planting initiatives (Keesing & Wratten 1998).
Numerous environmental regulations now dictate how mining                   Invertebrates are a vital, functional component of most
and quarrying companies must mitigate environmental damage             ecosystems and can make major contributions to local and
caused by their activities, and restoration of spent mining and        regional biodiversity. Accordingly, several invertebrate taxa are
quarrying sites constitutes a major element of present-day             recommended for use as monitoring tools in the evaluation of
applied ecological activity (Prach & Tolvanen 2016). Mining            post-mining restoration success including: Collembola, Acari
site restoration is mandatory in Australia (Jansen 1997), and          (Greenslade & Majer 1993; Andres & Mateos 2006), Hemiptera
federal USA laws ensure that closed mine sites undergo terrain         (Orabi et al. 2010), Lumbricidae (Majer et al. 2007a; Boyer
reestablishment, topsoil replacement and restoration planting          et al. 2016), Coleoptera (Parmenter & MacMahon 1987),
(Advameg 2016). In New Zealand, land rehabilitation has                Formicidae (Majer et al. 2007b) and Lepidoptera (Holl 1996).
been a mining permit requirement since the 1980s, and the              Although many studies focus on a single higher invertebrate
Resource Management Act 1991 stipulates that environmental             taxon, often the patterns observed with one taxon do not reflect
damage caused by mining needs to be ‘mitigated, avoided or             those seen in others when comparing restored and reference
remedied’ (RMA 1991; Nathan 2012).                                     communities (Longcore 2003). Therefore, a ‘multi-taxon’
     Ecological restoration not only aims to enhance the               approach to invertebrate bioindicators, often associated with
aesthetic value of a degraded site, but also improve soil quality      multiple sampling methods, is frequently advocated (e.g.
and stability, and produce permanent vegetation stands typical         McGeoch 1998; Majer et al. 2007a; Davis & Utrup 2010;
of neighbouring undisturbed land (Prach & Tolvanen 2016).              Řehounková et al. 2016).
More specifically, ecological restoration aspires to increase               Winstone Aggregates, New Zealand’s largest aggregates
biodiversity, re-establish key components of flora and fauna           provider, supplies materials for concrete manufacture and major
and, in doing so, restore the structure and functioning of the         infrastructure developments (Winstone Aggregates 2018). In
lost ecosystem (Longcore 2003; Cooke & Suski 2008). Thus,              1955 the company bought Hunua Quarry, located in the Hunua
to appropriately restore an area the entire ecosystem must be          Ranges Regional Park (Titchall 2015). To comply with current
DOI: 10.20417/nzjecol.43.5
2 New Zealand Journal of Ecology, Vol. 43, No. 1, 2019
New Zealand legislation, the company has proceeded with the scale of whole invertebrate assemblages. Finally, as one of
ecological restoration as a means of reconciling environmental the frequent aims of restoration is to increase biodiversity of
damage caused by its mining activities. Native plant species degraded land, we calculated numerous summary biodiversity
are grown in an on-site nursery, from seeds sourced in the indices to examine whether sensible and consistent patterns
Hunua area, until large enough for planting out. At the time occurred across the restoration sequence for multiple taxa.
that this study was undertaken, over 140 000 plants had been
planted with an aim of generating an area of new forest to
replace that removed during quarrying (Winstone Aggregates Methods
2018). This study has adopted a space-for-time substitution
approach, using a variety of collecting methods, to compare Study area
the abundance and diversity of invertebrates in the replanted
area with those found in neighbouring, undisturbed mature The Hunua Ranges (Papakura, South Auckland) are a series of
forest, which we consider an appropriate reference state for sharp-slanted ranges (up to 688 m high) formed from blocks of
the forest ecosystems in this area (Pickett 1989; Walker et al. uplifted greywacke. The Ranges consist of over 20 000 ha of
2010). Unrestored grassland was also sampled to assess whether native forest where tawa podocarp, kauri-hard beech and taraire
the replanting process had caused a shift in the invertebrate forest are the dominant classes of vegetation. Broadleaf forest
fauna away from the highly modified habitat which formed species include taraire (Beilschmiedia tarairi), puriri (Vitex
the basis of the restoration area 6 years earlier. lucens), pukatea (Laurelia novae-zelandiae), swamp maire
Before a multi-taxon bioindicator approach can be (Syzygium maire) and kahikatea (Dacrycarpus dacrydioides),
developed, it is important to identify which individual with areas of secondary forest dominated by mapou (Myrsine
invertebrate species show clear, statistically significant australis), kānuka (Kunzea robusta) and tree fern (Cyathea
responses, to habitat restoration. The primary aim of the and Dicksonia spp.) (Lindsay et al. 2009). The area receives
study was to identify invertebrates demonstrating potential as 1900–1950 mean annual sunshine hours, and the climate tends
bioindicators of successful restoration trajectory by applying to be humid and mild with few extremes of weather, with 50%
the following criteria: (1) show statistically significant (P < higher mean rainfall (1400–2000 mm annually) and 2–4°C
0.05) differences in abundance among the three habitat types; lower mean annual temperature (at 12°C) than lower lying
(2) show a positive or negative unidirectional shift in abundance areas of Auckland (Chappell 2013).
from the unplanted grassland site to the mature forest via the The study area was adjacent to the operating quarry
restored area; and (3) be sufficiently abundant (at least 10 at Hunua (37° 5'14.32"S 175° 0'9.62"E) and consisted of
specimens recorded) to provide meaningful results. three areas with different vegetation status: a mature forest,
Additionally, multivariate analyses were performed on the an ecological restoration replanting area, and an unplanted
data for some species-rich groups (Coleoptera, Collembola, grassland (Fig. 1). The mature forest area (45 ha) consisted of
Acari) to confirm that differences in the faunas among the three primary or secondary growth forest containing the native tree
habitats occurred, and ascertain whether this approach could species described above. The restored area (39 ha) was planted
identify convergence of restoration and reference habitats at with 24 local eco-sourced tree, shrub and sedge species (see
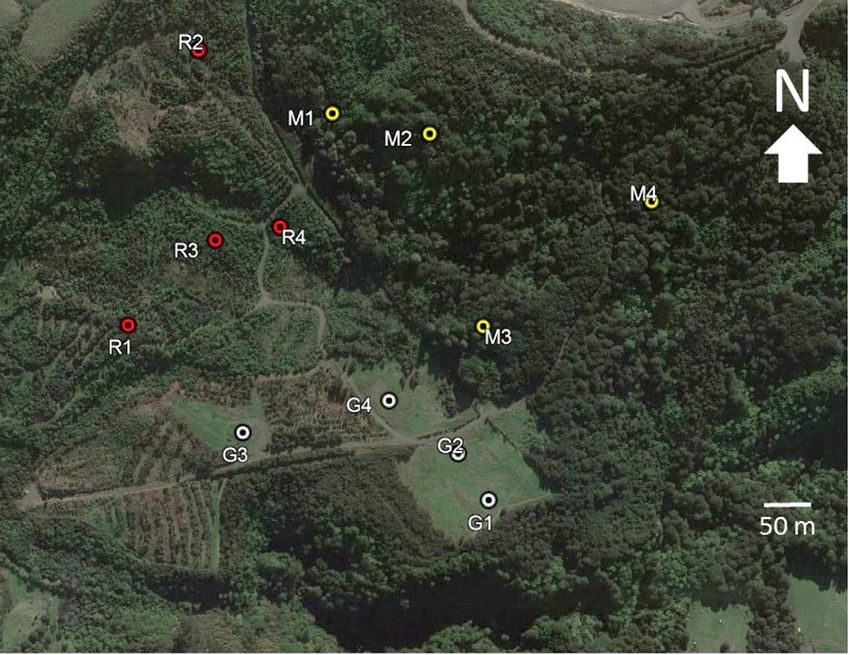
Figure 1. Map of New Zealand showing general location of Hunua, and aerial view of study site (from Google Earth) showing the location
of the unplanted grassland site (G; white circles), restoration site (R; red circles) and mature site (M; yellow circles) at the Winstone
Aggregates Hunua Quarry (37° 04ʹ 48ʺ S 174° 59ʹ 44ʺ E).Bowie et al.: Invertebrate indicators of restoration success 3
Table S1 in Supplementary Material): between 2009 and the pitfall traps were preserved in 70% ethanol and returned to
end of 2014 over 140 000 specimens were planted in this area. Lincoln University, New Zealand, for processing. In order to
By 2014, the trees were approximately 3 m in height and some measure invertebrate diversity, specimens found in the leaf litter
canopy closure was evident. The unplanted grassland area (2 samples were initially separated into recognisable taxonomic
ha) consisted of a mixture of exotic grass species, dominated by units (RTU), with digital photos used as a reference guide to
cocksfoot (Dactylis glomerata), which is un-grazed although distinguish different RTUs. Insects from the pitfall traps were
occasional control of gorse is undertaken. separated into major taxonomic divisions, and the Coleoptera
subsequently identified to species (or RTUs).
Invertebrate collection
To sample invertebrates, four independent sampling stations, Statistical analysis
at least 50 m apart, were established in each of the three To identify any statistically significant differences in abundance
vegetation areas described above (Fig. 1). The whole study of individual taxa among the three vegetation classes we used
area was within an area of approximately 400 × 500 m, and non-parametric Kruskal-Wallis tests (due to the prevalence
the overall proximity of the sampling stations minimised of zeroes in the final data sets), and then inferred differences
the potential influence of environmental factors such as soil between pairs of treatments by visual inspection of mean values.
type, aspect, slope, rainfall and temperature on invertebrate The large number of taxa involved in the survey meant that a
abundance and activity. Similarly, the sampling stations were high number of tests were performed, increasing the chance
all positioned to face north to remove any effects of orientation of Type I statistical errors. However, as these significance
and aspect on the invertebrates collected. tests were used as a screening process to identify potential
At each sampling station, invertebrates were recorded bioindicator taxa, we wished to avoid non-detection of
using four methods: weta motels (four motels per station); potentially useful results (Type II statistical errors). Therefore,
pitfall traps (four traps per station); artificial cover objects we did not correct for multiple testing and retained the use
(four wooden discs per station); and leaf litter extraction (one of P < 0.05 level as an indication of statistically significant
sample per station). For the first three of these methods, the differences.
animals recorded in each of the four sub-samples were pooled For the beetles obtained in the pitfall traps, a number
to give a single value for each independent sampling station. of summary indices describing ecological diversity were
Weta motels are artificial timber refuges for weta calculated based on the whole catch obtained in each vegetation
(Orthoptera: Anostostomatidae & Rhaphidophoridae) and other class. These were: number of families, number of species (S),
invertebrates, and resemble a bird nest-box in their construction the Shannon-Weiner Index (H’), evenness (J’), Simpson’s
(Bowie et al. 2006, 2014; Hodge et al. 2007). Weta motels diversity index (SDI), Simpson’s evenness index (SEI), and
were attached either to stakes or trees depending on whether a species dominance. The indices were calculated as:
suitable tree was available. The motels were placed out on 19
November 2014 and assessed for occupation on 18 December H’ = −Σpi × ln(pi) (1)
2014 and 19 January 2015. Weta resident in the motels were
identified in situ (by MB). J’= H’/ ln(S) (2)
Pitfall traps consisting of plastic cups (69 mm diameter,
depth 94 mm) were sunk into the ground using a soil SDI = 1−Σpi2 (3)
corer (which minimised ground disturbance) and 100 ml
monopropylene glycol placed in each trap as a preservative. SEI = SDI/ [1−(1/S)] (4)
Square plastic roofs were put over the cups and held down
by wire, leaving a gap of 15 mm to prevent entry of rain and where pi was the proportion of individuals consisting of
debris but allowing invertebrates to enter the trap. The pitfall the ith species and S was species richness. Dominance was
traps were placed out on 19 November 2014 and retrieved 30 calculated as pmax , where pmax was the proportion of individuals
days later on 18 December 2014. represented by the most abundant species in the collection. To
Near each set of weta motels and pitfall traps an area compare diversity (H’ and SDI) between each pair of habitat
was cleared to reveal bare soil. Wooden discs (400–600 mm types, a permutation test was used, where the data from two
diameter) were placed in these spaces to act as artificial cover samples were pooled and then randomly assigned to two
objects or ‘cryptozoa boards’, a system previously used to groups (Species Diversity and Richness Package v4, Pisces
survey invertebrates in disused quarries, ecological reserves Conservation Ltd, UK; 2007). The proportion of random
and restoration plantings (Bowie & Frampton 2004; Hodge & permutations (1000) that resulted in a difference in diversity
Standen 2006; Hahner & Bowie 2013). The discs were placed as great as or greater than that found between the original
out on 19 November 2014 and were assessed for invertebrates samples was then used to provide a probability that the two
sheltering under them on 18 December 2014 and 19 January samples had equal diversity.
2015. The records from the two dates were pooled. A single The species-sample matrices obtained for the pitfall-
leaf litter sample (300 × 210 mm) was collected from each collected beetles and litter-collected mites and springtails
sampling station on 19 November 2014. These litter samples were extremely sparse, with the majority of cells equal to
were placed into a Berlese extractor for one week, using 40 zero. To avoid samples appearing similar due to a prevalence
Watt bulbs as a light/heat source, and specimens collected into of shared absences (see Legendre & Gallagher 2001), we
sample vials containing 70% ethanol. compared the compositions of the faunas among the three
vegetation types using non-metric multidimensional scaling
Specimen identification (NMDS) and analysis of similarity (ANOSIM) using square-
Weta in the weta motels and the animals observed under the root transformed data (Community Analysis Package v4,
wooden discs were identified in situ where possible. All of Pisces Conservation Ltd, UK; Henderson & Seaby 2008).
the specimens collected from the leaf litter samples and the As ANOSIM can confound differences among groups with4 New Zealand Journal of Ecology, Vol. 43, No. 1, 2019
differences in scatter within groups, a multivariate homogeneity Wooden discs
of dispersion test (PERMDISP) was performed on each A variety of invertebrate taxa was found under the wooden
data set (PRIMER v7 + PERMANOVA software, PRIME e, discs, although few taxa were found in high numbers or
Albany, NZ; Warton et al. 2012). For the NMDS, a Bray-Curtis with any consistency in each vegetation category (Table 2).
similarity measure was employed and principal components Harvestmen (Opiliones), exotic earthworms (Lumbricidae) and
analysis used to give initial positions of the samples. For the the exotic tiger slug (Limax maximus) were either exclusively,
beetles, these multivariate procedures were performed three or predominantly, found in the restoration area, and thus did
times, on matrices including: abundance of all species, only not represent viable bioindicators of restoration trajectory.
species with total abundance ≥4 across measured sites, and However, the other exotic slugs (Arion spp. and Deroceras
abundance of families. spp.) and snails (Helix aspersa, Oxychilus alliarius and
Cohlopoca buccinella), did show potential as bioindicators,
as more than 10 specimens of each group were recorded, they
Results were significantly different in abundance among sites, and they
showed a unidirectional shift from relatively high abundance
Weta motels in the unplanted grassland, to zero occurrence in the mature
Thirty Auckland tree weta (Hemideina thoracica) were forest areas (Table 2).
observed in the motels over the two observation dates, 27
(90%) of which were recorded at the restored site (Table 1). Pitfall traps
One cave weta (Neonetus sp.) was observed on each assessment The pitfall traps captured a wide variety of invertebrate taxa
date at the mature forest. With this collection method, neither typical of grassland and forest habitats and a number of potential
of these species met all our required criteria to be considered indicators were identified (Tables 3 & 4). Cave weta were
a potential bioindicator of restoration trajectory. over eight times more abundant in the mature forest than in
Table 1. Weta observed in weta motels at the unplanted grassland, restored and mature forest sites in the Hunua Quarry
restoration area on two assessment dates (17/12/14 and 19/1/15). Value given is the mean number (± SEM) of weta found
in four sampling stations (each consisting of four motels). Each P value was obtained from a Kruskal-Wallis test with 2
degrees of freedom and n = 4. Statistically significant results (P < 0.05) are shown in bold.
__________________________________________________________________________________________________________________________________________________________________
Species Date Unplanted grassland Restored Mature P
__________________________________________________________________________________________________________________________________________________________________
Tree weta Hemideina thoracica 2014 0±0 2.75 ± 0.95 0±0 0.027
2015 0±0 4.00 ± 0.91 0.75 ± 0.25 0.008
Cave weta Neonatus sp. 2014 0±0 0±0 0.25 ± 0.25 0.368
2015 0±0 0±0 0.25 ± 0.25 0.368
__________________________________________________________________________________________________________________________________________________________________
Table 2. Invertebrates observed under wooden discs placed out at the unplanted grassland, restored and mature forest sites
in the Hunua Quarry restoration area. Each value given is the mean number of animals found in four sampling stations
(each consisting of four wooden discs). Each P value was obtained from a Kruskal-Wallis test with 2 degrees of freedom
and n = 4. Statistically significant results (P < 0.05) are shown in bold.
__________________________________________________________________________________________________________________________________________________________________
Taxa Unplanted grassland Restored Mature P
__________________________________________________________________________________________________________________________________________________________________
Coleoptera Carabidae 2.75 ± 0.75 3.00 ± 1.78 2.00 ± 1.68 0.750
Curculionidae 0.75 ± 0.75 0±0 0±0 0.368
Elateridae 0±0 0.25 ± 0.25 0±0 0.368
Scarabaeidae 0±0 0.25 ± 0.25 0±0 0.368
Staphylinidae 0.25 ± 0.25 0.50 ± 0.29 0±0 0.295
Blattodea Blattidae 1.0 ± 0.707 0.5 ± 0.5 0±0 0.303
Orthoptera Gryllidae 0.25 ± 0.25 0±0 0±0 0.368
Arachnida Araneae 0.75 ± 0.75 1.25 ± 0.63 1.0 ± 0.58 0.701
Opiliones 0±0 1.5 ± 0.87 0±0 0.027
Myriapoda Diplopoda 0.25 ± 0.25 4.00 ± 1.22 5.50 ± 2.60 0.064
Chilopoda 0±0 0.25 ± 0.25 0±0 0.368
Annelida Earthworms 9.50 ± 4.37 15.8 ± 4.61 1.00 ± 0.71 0.048
Platyhelminthes Flatworms 0.5 ± 0.29 1.0 ± 0.71 0±0 0.256
Mollusca Exotic snails 13.0 ± 5.11 5.25 ± 0.75 0±0 0.008
Tiger slugs 0±0 6.00 ± 3.67 0±0 0.028
Exotic slugs 5.50 ± 1.50 0.75 ± 0.75 0±0 0.014
__________________________________________________________________________________________________________________________________________________________________Bowie et al.: Invertebrate indicators of restoration success 5
the restored and unplanted areas, and similarly the numbers Seven of the 40 beetle species were found to differ
of spiders (Araneae) were considerably higher in the restored significantly (P < 0.05) in abundance among the three
and mature forest than in the unplanted grassland (Table vegetation types, six of which met all three criteria to be
3). Conversely, three ant species (Formicidae: Amblyopone considered valid bioindicators (Table 4). The carabid Holcaspis
australis, Pachycondyla castanea and Tetramorium grassii) mucronata was most abundant in the mature forest compared
were found which, collectively, were more abundant in the with the unplanted grassland and restored areas. It was found
unplanted grassland than the restored and mature forest at all four of the mature forest sampling stations but was not
(Table 3). recorded at all in the unplanted grassland. Also, a species of
As with the wooden discs, exotic slugs were most abundant Cerylonidae (Hypodacnella sp.) and an undetermined species
in the unplanted grasslands and least abundant in the mature of Mycetophagidae were collected in three of the four samples
forest. This pattern was also seen with exotic earthworms from the mature forest but none from the grassland and restored
(Lumbricidae) and the common garden snail (Helix aspersa). areas (Table 4). Conversely, an undetermined species of
Additionally, one or two specimens of each of five native snail Staphylinidae was highly abundant in the unplanted grassland
species were collected only in the mature forest: Thalassohelix (153 specimens) but was not found in the mature forest.
ziczag, Laoma marino, Phrixgnathus sp., Allodiscus dimorphus Similarly, the carabid Rhytisturnus miser was 16 times more
and Cavellia buccinella. abundant in the unplanted grassland than in the mature forest.
In total, 887 beetles, belonging to 40 species in 18 families, Although there appeared to be only a few beetle species
were collected in the pitfall traps. Almost half (19) of the 40 exhibiting clear preferences for one habitat above the others,
species were represented by five or more individuals and only the NMDS analysis clearly grouped the samples from each
six species were recorded as singletons (Table 4). Overall, habitat, especially the four samples taken from the unplanted
more individual beetles were collected in the unplanted grassland (Fig. 2). The ANOSIM procedures indicated that
grassland than the restored area and mature forest. However, significant differences in sample composition (P < 0.001)
the various diversity indices based on the overall catches did occurred among the three groups when including all the
not give a clear separation of the three vegetation classes. The beetle species (R = 0.79; homogeneity of dispersion, F2,9 =
Shannon-Weiner Index (H’) value was significantly lower in 3.01, P = 0.166), only those species represented by four or
the unplanted grassland than both the restoration (permutation more specimens (R = 0.80; homogeneity of dispersion, F2,9
test, P = 0.009) and mature forest areas (P = 0.031), but there = 1.85, P = 0.337), and when family level designations were
was no difference between the mature forest and restoration used (R = 0.65; homogeneity of dispersion, F2,9 = 2.64, P =
area (P = 0.417) (Table 4). The beetle diversity in the unplanted 0.195). Also, when the groups of samples were compared in
grassland as measured by Simpson’s Diversity Index (SDI) a pairwise fashion, all three groups of samples were found
was not different to that found in the restored area (P = 0.357) to be significantly different in composition from each other
and mature forest (P = 0.204), but was different between the (P < 0.05).
restored area and mature forest (P = 0.030). The mature forest Even when using the relatively coarse taxonomic level of
also had the lowest diversity scores in terms of evenness (J and family, the beetle samples from the three different vegetation
SEI) and dominance (Table 4). If more simplistic measures areas formed obvious clusters, with the exception of one
of diversity were considered, the unplanted grassland had sample from the mature forest, the M1 sample, which was also
approximately half the number of beetle families and species distinct in the other two NMDS analyses (Fig. 2). From the
than found in the restored and mature forest areas (Table 4). raw data, it is not easy to see why this sample was so different
Table 3. Invertebrates (excluding Coleoptera) collected in pitfall traps placed in the unplanted grassland, restored and mature
forest sites in the Hunua Quarry restoration area. Each value given is the mean number of animals found in four sampling
stations (each consisting of four pitfall traps). Each P value was obtained from a Kruskal-Wallis test with 2 degrees of
freedom and n = 4. Statistically significant results (P < 0.05) are shown in bold.
__________________________________________________________________________________________________________________________________________________________________
Taxa Unplanted grassland Restored Mature P
__________________________________________________________________________________________________________________________________________________________________
Insecta Cave Weta 0.25 ± 0.25 0.50 ± 0.50 4.00 ± 0.82 0.018
Ground Weta 0±0 0.25 ± 0.25 0.75 ± 0.75 0.573
Dermaptera 0±0 1.75 ± 1.44 0±0 0.113
Diptera 67.0 ± 17.4 48.5 ± 13.3 31.5 ± 12.4 0.333
Formicidae 176.7 ± 44.9 71.5 ± 36.0 22.0 ± 11.6 0.039
Apocrita (wasps) 4.00 ± 0.58 16.0 ± 13.7 3.50 ± 0.29 0.867
Lepidoptera 0.25 ± 0.25 1.25 ± 0.75 0.75 ± 0.48 0.537
Arachnida Araneae 3.00 ± 0.58 21.25 ± 4.61 21.25 ± 1.71 0.023
Pseudoscorpiones 0±0 0.75 ± 0.48 1.00 ± 0.58 0.256
Myriapoda Chilopoda 0.75 ± 0.48 0.75 ± 0.25 5.75 ± 2.17 0.244
Diplopoda 7.75 ± 3.42 5.00 ± 0.71 7.50 ± 1.26 0.523
Mollusca Garden Snails 28.0 ± 13.1 1.25 ± 0.48 0.75 ± 0.48 0.020
Other Snails 45.0 ± 24.4 3.50 ± 2.60 1.50 ± 0.29 0.167
Exotic slugs 21.8 ± 3.64 16.5 ± 6.91 1.00 ± 1.00 0.031
Annelida Lumbricidae 10.0 ± 3.76 8.50 ± 1.32 0.50 ± 0.29 0.036
__________________________________________________________________________________________________________________________________________________________________6 New Zealand Journal of Ecology, Vol. 43, No. 1, 2019
Table 4. Coleoptera collected in pitfall traps placed in the unplanted grassland, restored and mature forest sites in the Hunua
Quarry restoration area. Each value given is the total number of animals found in four sampling stations (each consisting of
four pitfall traps). Each P value was obtained from a Kruskal-Wallis test with 2 degrees of freedom and n = 4. Statistically
significant results (P < 0.05) are shown in bold. Diversity indices were calculated using the whole collection from each site.
__________________________________________________________________________________________________________________________________________________________________
Family Species Unplanted grassland Restored Mature P
__________________________________________________________________________________________________________________________________________________________________
Anthicidae Sapintus aucklandensis - 2 3 0.256
Sapintus pellucidipes - - 3 0.368
Carabidae Clivina vagans 9 1 - 0.241
Ctenognathus bidens 72 110 163 0.777
Ctenognathus cardiophorus 2 - 2 0.577
Ctenognathus lucifugus 1 1 - 0.577
Holcaspis mucronata - 3 17 0.019
Lecanomerus atriceps - 1 1 0.577
Mecodema crenicolle - 5 6 0.142
Rhytisternus miser 49 22 3 0.020
Cerylonidae Hypodacnella sp. - - 13 0.028
Cerambycidae Ptinosoma sp. - 1 1 0.577
Coccinellidae Coccinellidae indet. - - 2 0.368
Corylophidae Corylophidae indet. - 2 - 0.111
Curculionidae Mandalotus miricollis - 1 - 0.368
Phrynixus sp. - 3 6 0.092
Scelodolichus sp. 2 - - 0.111
Elateridae Argrypnus variabilus 18 2 - 0.059
Hydrophilidae Hydrophilidae indet. 12 1 19 0.262
Lathridiidae Aridius costatus - 5 5 0.089
Leiodidae Zeadolopus sp. - - 2 0.111
Leiodidae indet. 1 - 3 1 0.573
Leiodidae indet. 2 - - 1 0.368
Lucanidae Mitophyllus parrinus 1 - - 0.368
Melandryidae Hylobia sp.1 - 3 - 0.113
Hylobia sp.3 - 1 2 0.573
Hylobia sp.2 - 1 - 0.368
Mycetophagidae Mycetophagidae indet. - - 10 0.028
Nitidulidae Epurea sp. - 54 - 0.005
Scarabaeidae Heteronychus arator 20 - - 0.005
Saprosites sp. - 1 - 0.368
Saphobius sp. 1 - - 2 0.111
Saphobius sp. 2 - - 5 0.368
Staphylinidae Silphotelus sp. - - 2 0.368
Staphylinidae indet. 1 - 12 11 0.151
Staphylinidae indet. 2 - 1 - 0.368
Staphylinidae indet. 3 - 3 - 0.113
Staphylinidae indet. 4 153 3 - 0.010
Zopheridae Pristoderus bakewelli 3 15 1 0.174
Syncalis sp. - - 7 0.368
__________________________________________________________________________________________________________________________________________________________________
Individuals 342 257 288
Families 8 14 14
Species 12 26 25
Dominance (%) 44.7 42.6 56.6
Shannon-Weiner H’ 1.636 2.009 1.890
Evenness J 0.659 0.617 0.587
Simpson’s diversity index (SDI) 0.729 0.762 0.667
Simpson’s evenness index (SEI) 0.793 0.790 0.692
__________________________________________________________________________________________________________________________________________________________________Bowie et al.: Invertebrate indicators of restoration success 7
A Hylobia sp 2 NDMS 2 from the other mature forest samples, although it contained no
Saprosites sp. Phrynixus sp. and no Mycetophagidae, which were present in
all of the other mature forest samples. Spatially, the M1 sample
R3
was close to the restored area, especially samples R2 and R4
(Fig. 1), and so might have been influenced by its proximity
M1 to the forest edge. However, sample M3 was also close to the
R4 R2 forest edge, near to the unplanted grassland, and the beetles
C1 Staph indet 4
Rhytisturnus miser
collected in this sample were similar to those collected deeper
into the forest area (M2 and M4).
R1 C4
Sapintus aucklandensis
Aridius costatus
C2 NDMS 1
C3 Leaf litter samples
M3
A total of 66 mite RTUs and 17 springtail RTUs were collected
M2
M4
from the leaf litter samples (Tables S2, S3). However, only
one mite RTU (M32) and no springtail RTUs met all three of
our criteria to be considered bioindicators.
Saphobius sp 1 For both taxa there were no statistically significant
Zeadalopus sp. differences across the three sites in terms of numbers of
individuals and species richness (Table 5). However, even
though there was little separation of the three vegetation
B Epurea sp. NDMS 2 areas based on numerical summaries, the NMDS analyses
suggested a separation of the mite and springtail collections
assemblages in the unplanted grassland from those obtained
R3 in the mature forest (Fig. 3). The ANOSIM procedure on the
mite data (R = 0.52; P < 0.001; homogeneity of dispersion,
R2
Rhytisturnus miser
F2,9 = 3.35, P = 0.198) separated all three groups of samples
M1
Staph indet 1 from each other when compared in a pairwise fashion (P <
R4
C1 0.05; Fig. 3A). For the springtails, the ANOSIM procedure
C2
(R = 0.46; P < 0.001; homogeneity of dispersion, F2,9 = 0.46,
Sapintus aucklandensis C4
Aridius costatus R1 NDMS 1 P = 0.782) indicated that the collections in the mature forest
M2
C3 and restored area were not significantly different (P = 0.071),
M3
whereas both the mature forest (P = 0.014) and restored site
M4
(P = 0.043) were separated from the grassland samples by the
ANOSIM procedure (Fig. 3B).
Myceto. indet
Phrynixus sp.
Discussion
The main aim of this study was, by applying predetermined
C Zopheridae NDMS 2 criteria, to identify potential indicator taxa that could prove
useful in future monitoring events at both this site and other
R3
restoration sites. The information collected allows us to
propose a number of taxa that could be used to help map the
M1 R2
invertebrate assemblage trajectory at the restored site from
that of the exotic grassland and towards that occurring at the
C4
R4 mature forest (Table 6). For example, the unplanted grassland
C1 Staphylinidae site had high numbers of exotic snails, slugs and earthworms,
Elateridae
whereas the mature forest had more spiders, cave weta, and
Anthicidae R1 C2 NDMS 1 the beetles Holcaspis mucronata and Hypodacnella sp. (Table
Lathridiidae
C3 6). In future, if the restoration process is successful, it would
M4 be expected that the restored site would show a decrease in
M2
M3 those taxa associated with unplanted grassland and an increase
in those taxa associated with the mature forest.
Carabid ground beetles have a long history of being used as
Mycetophagidae bioindicators and as monitoring tools to gauge environmental
Curculionidae
impact (Kotze et al. 2009; Eyre et al. 2016). Previous New
Zealand studies of habitat restoration also suggested that
carabids have potential as indicators of restoration success
(Reay & Norton 1999; Bowie et al. 2012). Additionally, as
Figure 2. Scatter plots of NDMS Axis 2 versus NDMS Axis 1
scores of twelve pitfall samples of beetles collected from unplanted the taxonomy of New Zealand ground beetles is well treated
grassland (G: white), restored (R: grey) and mature forests (M: in the literature, carabids represent a sensible and familiar
black) at Hunua Quarry. NDMS was performed on square root group of insects for use in future monitoring events. Spiders
transformed count data for (A) all species (stress = 0.084), (B) were most abundant in the pitfall traps set out in the restored
species represented by ≥4 individuals (stress = 0.069) and (C) and mature forest and, therefore, as a group indicated some
abundance of each family (stress = 0.111) in each sample. divergence in the overall invertebrate assemblage from that8 New Zealand Journal of Ecology, Vol. 43, No. 1, 2019
NMDS Axis 2 found in grassland habitat. Unfortunately, in this study we did
A
not identify the spiders to species level due to time constraints.
There is an opportunity in future work to identify spider species
C4 C1 R1 associated with one habitat type or another.
C2 Although not obvious candidates as bioindicators based
C3
on the data we collected and criteria we set, some invertebrate
groups may still prove useful due to their rarity or endemic
status. For example, the endemic snails Laoma maria,
Allodiscus dimorphus, Thalassohelix ziczag, Allodiscus
M2 dimorphus and Cavellia buccinella were only found in
M1 R3 NMDS Axis 1 the mature forest at Hunua. Due to their high conservation
R4 status, the future occurrence of these species in the recently
planted areas would be meaningful indicators of restoration
M3
R2 success. Similarly, dung beetles are often considered excellent
Control bioindicators, due to their sensitivity to habitat perturbations
M4 and ease of identification (Nichols et al. 2008; Bicknell et
Restored
al. 2014). Three species of dung beetle were present in our
Mature collections, two Saphobius species in the mature forest and a
Saprosites species at the restoration site, and these species might
also be considered valuable indicators in future monitoring
NMDS Axis 2 studies of this site.
B Control Invertebrate communities in early restoration sites often
Restored differ from those found in the reference ecosystem they are
R1 Mature trying to attain, or may not respond in a predictable way to
the species or the diversity of plants used in a replanting
scheme (Longcore 2003; Davis & Utrup 2010). The replanted
R3
areas in this study were all less than 6 years old at the time
C1 M2 of the invertebrate sampling, and often much longer time
M3
M4 periods are required before restoration aims are met (Orabi
et al. 2010). The NMDS and ANOSIM procedures indicated
C4 M1 R4
NMDS Axis 1 that the collections of diverse taxa, such as beetles, mites
C2 and springtails, all exhibited significant differences in faunal
R2
composition between the unplanted grassland habitat acting as
a temporal control, and those occurring in the mature forest,
which represents the target habitat. This separation forms a
basis for the use of a whole-assemblage approach to examining
restoration trajectory. Over time, if restoration is successful,
C3
ordination analysis should indicate that the invertebrates from
the restoration area have separated from those of the unplanted
grassland, but are statistically indistinct from those of the
mature forest. Future work at this site is required to ascertain
Figure 3. Scatter plots of NDMS Axis 2 versus NDMS Axis
1 scores of twelve leaf litter samples of (A) mites (stress = whether the compositions of the restoration and mature forest
0.098) and (B) springtails (stress = 0.123) collected in unplanted invertebrate assemblages have increased in their similarity or
grassland (G: white), restored (R: grey) and mature forests (M: have fully converged.
black) at Hunua Quarry. NDMS was performed on square root Mites were the most diverse taxonomic group in our
transformed count data. survey (66 RTUs) and have been suggested as being valuable
Table 5. Mites (Acari) and springtails (Collembola) obtained from leaf litter samples in the unplanted grassland, restored
and mature forest sites in the Hunua Quarry restoration area. Abundance, species richness, and total species values given
are: mean ± SEM. For total species the overall number of species recorded in each area is given. Invertebrates were collected
from four sampling stations, with four litter samples taken at each station. Each P value was obtained from a Kruskal-Wallis
test with 2 degrees of freedom and n = 4.
__________________________________________________________________________________________________________________________________________________________________
Taxa Unplanted grassland Restored Mature P
__________________________________________________________________________________________________________________________________________________________________
Mites Abundance 74.5 ± 14.3 138.0 ± 67.3 108.5 ± 22.7 0.542
Species richness 11.5 ± 1.3 14.8 ± 3.1 19.5 ± 3.3 0.131
Total species 28 30 42
Springtails Abundance 29.0 ± 10.2 20.8 ± 11.0 55.8 ± 36.8 0.301
Species richness 3.5 ± 0.5 4.75 ± 0.25 4.0 ± 1.1 0.319
Total species 7 11 8
__________________________________________________________________________________________________________________________________________________________________Bowie et al.: Invertebrate indicators of restoration success 9
Table 6. Invertebrate taxa showing associations with the to be implemented more often where restoration success is
two reference habitat types in the Hunua Quarry Restoration gauged using species richness or ecological diversity indices.
Project, New Zealand, and thus showing good potential as However, the diversity indices based on our beetle, mite and
bioindicators of restoration trajectory. springtail collections did not unambiguously separate the three
____________________________________________________________________________
sampling areas. Although increasing species diversity is often
Unplanted
considered a critical component of ecological restoration, the
grassland Mature
____________________________________________________________________________ use of diversity measures as indicators of restoration success is
Weta motels - - not always straightforward as high species diversity can result
Wooden discs Exotic slugs from the presence of exotic or invasive invertebrates (Prach &
Exotic snails
Tolvanen 2016). Therefore, species diversity indices should be
used in conjunction with other measures of ecological value
Pitfall traps Exotic snails Spiders of the species involved, such as their endemic status, rarity,
Exotic slugs Cave weta and whether they are considered typical of the habitat being
Exotic worms restored (Majer et al. 2007a; Gardner-Gee et al. 2015; Boyer
Rhytisternus miser Holcaspis et al. 2016; Řehounková et al. 2016).
mucronata
Heteronychus arator Hypodacnella sp.
Staphylinidae indet. 4 Mycetophagidae sp. Conclusion
Leaf litter - Mite RTU M32
____________________________________________________________________________ This study represents an initial examination of the first stage
of restoration replanting at the Hunua Quarry site. We accept
that, currently, there is a lack of real replication in our study,
as only one restoration project has been investigated, and
bioindicators in mine restoration (Majer et al. 2007a). In similar only one example of each of the three vegetation types was
restoration work at Punakaiki on the West Coast of New surveyed for invertebrates. However, the study has provided
Zealand, and in conservation plantings on New Zealand dairy an initial catalogue of the invertebrates occurring in this area
farms, mites have also been proposed as potential bioindicator of the Hunua Reserve, and identified significant differences in
taxa (Hahner & Bowie 2013; Smith et al. 2016; Curtis et al. invertebrate diversity and abundance among the three habitats.
2017; Esperschuetz et al. 2018). In our study, although only A number of invertebrate taxa have been identified as potential
one mite RTU met all our bioindicator criteria, we found clear indicators of restoration success, which might be used to focus
differences among habitats, especially the grassland and mature future monitoring events, both at this site and at other mine
forest, when using the whole mite assemblage. Although we or quarrying restoration projects. We are aware that in space-
concede that the complex taxonomy and difficulties with for-time studies there is some uncertainty regarding the use
identification can make working with mites problematic, we of undisturbed habitats as the terminal reference condition,
feel the results provide additional evidence of the potential as the restored areas do not share similar history regarding
of soil/litter mites as bioindicators of habitat quality in New disturbance, soil amendments, stability, and so on (Pickett
Zealand, and they warrant further investigation. 1989). However, as the Hunua Quarry replantings continue,
It is important to optimise sampling strategies for and the chronosequence of different aged restoration areas
ecological monitoring, and results obtained by one method develop, future monitoring events can use the bioindicator
may differ from those obtained using another (Majer et al. taxa identified here to detect whether further divergence from
2007a). The different invertebrate sampling methods we baseline grassland habitat has occurred, and evaluate whether
employed allowed us to gauge the usefulness of each method the restoration trajectory of the invertebrate community is
and identify differences in how the perceived response of moving towards that of the neighbouring mature forest.
some taxa was modified by sampling method. For example,
in the weta motels, few cave weta were present, and tree
weta occurred mainly in the restoration site. However, the Acknowledgements
pitfall traps collected no tree weta, but captured many more
cave weta in the mature forest compared with the other two Thanks to Winstone Aggregates for funding the research.
habitats. In general, the pitfall samples provided a high diversity The authors wish to thank Mervyn Hood and Mark Marsh
of taxa with sufficient numbers of specimens to make valid (Winstone Aggregates) for arranging site access. Cor Vink,
conclusions regarding their suitability as bioindicators. Thus, Bruce Marshall, Rowan Emberson, Shaun Forgie (Dung
we advocate the use of pitfall sampling in future surveys of Beetle Innovations) and Sam Brown assisted with specimen
this site, and in other restoration schemes, as a primary means identification. We thank David Pattemore, James Brock, George
of invertebrate monitoring. Perry and the anonymous reviewers for their suggestions on
Previous studies into mine restoration have identified the the manuscript.
requirement for high levels of wide ranging taxonomic skills in
order to accurately identify invertebrates collected to the level
of species. In this study we have compromised by using higher References
taxonomic levels (e.g. families or orders) for some groups or by
adopting a morphospecies or RTU approach (Oliver & Beattie Advameg 2016. Mining. Pollution issues. www.pollutionissues.
1996; Longcore 2003). The use of coarse higher taxonomic com/Li-Na/Mining.html (accessed 14 September 2018)
groups is sometimes justified on the basis that the whole group Andres P, Mateos E 2006. Soil mesofaunal responses to post-
is rare or endemic or typical of the habitat being recreated. mining restoration treatments. Applied Soil Ecology 33:
On the other hand, the use of morphospecies or RTUs tends 67–78.10 New Zealand Journal of Ecology, Vol. 43, No. 1, 2019
Bicknell JE, Phelp SP, Davies RJ, Mann DJ, Struebig MJ, Hodge S, Vink CJ, Banks JC, Bowie MH 2007. The use of tree-
Davies ZG 2014. Dung beetles as indicators for rapid mounted artificial shelters to investigate arboreal spider
impact assessments: evaluating best practice forestry in communities in New Zealand nature reserves. Journal of
the neotropics. Ecological Indicators 43: 154–161. Arachnology 35: 129–136.
Bowie MH, Frampton CM 2004. A practical technique for Holl KD 1996. The effect of coal surface mine reclamation
non-destructive monitoring of soil surface invertebrates on diurnal lepidopteran conservation. Journal of Applied
for ecological restoration programmes. Ecological Ecology 33: 225–236
Management and Restoration 5: 34–42. Jansen A 1997. Terrestrial invertebrate community structure
Bowie MH, Hodge S, Banks JC, Vink CJ 2006. An as an indicator of the success of a tropical rainforest
appraisal of simple tree-mounted shelters for non-lethal restoration project. Restoration Ecology 5: 115–124.
monitoring of weta (Orthoptera: Anostostomatidae and Keesing V, Wratten SD 1998. Indigenous invertebrate
Rhaphidophoridae) in New Zealand nature reserves. components in ecological restoration in agricultural
Journal of Insect Conservation 10: 261–268. landscapes. New Zealand Journal of Ecology 22: 99–104.
Bowie MH, Mountier C, Boyer S, Dickinson N 2012. Baseline Kotze DJ, Assmann T, Noordijk J, Turin H, Vermeulen R
survey for the Punakaiki Coastal Restoration Project. 2009. Carabid beetles as bioindicators: biogeographical,
Lincoln University Wildlife Management Report No. ecological and environmental studies. Proceedings of
50. 46 p. the XIV European Carabidologists Meeting, Westerbork,
Bowie MH, Allen WJ, McCaw J, van Heugten R 2014. Factors 14–18 September 2009. 1573 p.
influencing occupancy of modified artificial refuges for Legendre P, Gallagher ED 2001. Ecologically meaningful
monitoring the range-restricted Banks Peninsula tree transformations for ordination of species data. Oecologia
weta Hemideina ricta (Anostostomatidae). New Zealand 129: 271–280.
Journal of Ecology 38: 132–138. Lindsay H, Wild C, Byers S 2009. Auckland protection
Boyer S, Kim YN, Bowie MH, Lefort MC, Dickinson NM 2016. strategy: a report to the Nature Heritage Fund Committee.
Response of endemic and exotic earthworm communities to Wellington, Nature Heritage Fund. 85 p.
ecological restoration. Restoration Ecology 24: 717–721. Longcore T 2003. Terrestrial arthropods as indicators of
Chappell PR 2013. Climate and weather of Auckland. 2nd ecological restoration success in coastal sage scrub
edn. NIWA Science and Technology Series 60. Auckland, (California, U.S.A.). Restoration Ecology 11: 397–409.
NIWA Taihoro Nukurangi. 40 p. Majer JD, Brennan KEC, Moir ML 2007a. Invertebrates and
Cooke SJ, Suski CD 2008. Ecological restoration and the restoration of a forest ecosystem: 30 years of research
physiology: an overdue integration. BioScience 58: following bauxite mining in Western Australia. Restoration
957–968. Ecology 15: S104–S115.
Curtis K, Bowie M, Ross J 2017. The birds and the bees: Majer JD, Orabi G, Bisevac L 2007b. Ants (Hymenoptera:
identification of bird and invertebrate fauna providing Formicidae) pass the bioindicator scorecard.
ecosystem services following restoration plantings at Myrmecological News 10: 69–76.
the Lincoln University Dairy Farm. Lincoln University McGeoch MA 1998. The selection, testing and application of
Wildlife Management Report No. 63. 51 p. terrestrial insects as bioindicators. Biological Reviews of
Davis CA, Utrup JS 2010. Response of terrestrial invertebrates the Cambridge Philosophical Society 73: 181–201.
to high- and low-diversity grassland restorations in South- Nathan S 2012. Mining and underground resources – The
Central Nebraska. Restoration Ecology 18: 479–488. mining industry. Te Ara – the Encyclopaedia of New
Esperschuetz J, Bowie M, Smith C, Abbott M, Dickinson N Zealand. www.teara.govt.nz/en/mining-and-underground-
2018. Restoration research. Punakaiki Coastal Restoration resources/page-1(accessed 14 September 2018)
Project: 2014–2016. Lincoln University Wildlife Nichols E, Spector S, Louzada J, Larsen T, Ameziquita S,
Management Report No. 60. 107 p. Favilla ME 2008. Ecological functions and ecosystem
Eyre MD, McMillan SD, Critchley CNR 2016. Ground services provided by Scarabaeinae dung beetles. Biological
beetles (Coleoptera, Carabidae) as indicators of change Conservation 141: 1461–1474.
and pattern in the agroecosystem: longer surveys improve Oliver I, Beattie AJ 1996. Invertebrate morphospecies as
understanding. Ecological Indicators 68: 82–88. surrogates for species: a case study. Conservation Biology
Gardner-Gee R, Stanley MC, Beggs JR 2015. Re-forestation 10: 99–109.
restores native dominance in an island beetle fauna. Orabi G, Moir ML, Majer JD 2010. Assessing the success of
Restoration Ecology 23: 268–276. mine restoration using Hemiptera as indicators. Australian
Greenslade P, Majer JD 1993. Recolonization by Collembola Journal of Zoology 58: 243–249.
of rehabilitated bauxite mines in Western Australia. Parmenter RR, MacMahon JA 1987. Successional patterns
Australian Journal of Ecology 18: 385–394. of arthropod recolonization on reclaimed strip mines in
Hahner JL, Bowie MH 2013. Development and testing Southwestern Wyoming: the ground-dwelling beetle fauna
indicators of restoration success. Punakaiki Coastal (Coleoptera). Environmental Entomology 16: 168–177.
Restoration Project. Lincoln University Wildlife Pickett STA 1989. Space-for-time substitution as an alternative
Management Report 52. 224 p. to long-term studies. In: Likens Ed ed. Long-term studies
Henderson P, Seaby R 2008. A practical handbook for in ecology: approaches and alternatives. New York,
multivariate methods. Lymington, Pisces Conservation Springer. Pp. 110–135.
Ltd. 224 p. Prach K, Tolvanen A 2016. How can we restore biodiversity
Hodge S, Standen V 2006. The use of ‘cryptozoa boards’ and ecosystem services in mining and industrial sites?
to examine the distribution of woodlice (Isopoda) and Environmental Science and Pollution Research 23:
millipedes (Diplopoda) in a disused limestone quarry. 13587–13590.
Entomologist’s Monthly Magazine 142: 55–61. Reay RD, Norton DA 1999. Assessing the success of restorationBowie et al.: Invertebrate indicators of restoration success 11
plantings in a temperate New Zealand forest. Restoration Smith CMS, Bowie MH, Hahner JL, Boyer S, Kim YN, Zhong
Ecology 7: 298–308. HT, Abbott M, Rhodes S, Sharp D, Dickinson N 2016.
Řehounková K, Čížek L, Řehounek J, Šebelíková L, Tropek Punakaiki Coastal Restoration Project: a case study for a
R, Lencová K, Bogusch P, Marhoul P, Máca J 2016. consultative and multidisciplinary approach in selecting
Additional disturbances as a beneficial tool for restoration indicators of restoration success for a sand mining closure
of post-mining sites: a multi-taxa approach. Environmental site, West Coast, New Zealand. Catena 136: 91–103.
Science and Pollution Research 23: 13745–13753. Titchall A 2015. The re-greening of Symonds Hill. New Zealand
RMA 1991. Resource Management Act Section 17. Quarrying & Mining Magazine. 8 December 2015.
www.legislation.govt.nz/act/public/1991/0069/latest/ Walker LR, Wardle DA, Bardgett RD, Clarkson BD 2010. The
DLM231999.html (assessed 14 September 2018) use of chronosequences in studies of ecological succession
and soil development. Journal of Ecology 98: 725–736.
Warton DI, Wright ST, Wang Y 2012. Distance-based
multivariate analyses confound location and dispersion
effects. Methods in Ecology and Evolution 3: 89–101.
Editorial board member: David Pattemore Winstone Aggregates 2018. www.winstoneaggregates.co.nz
Received 15 December 2017; accepted 10 July 2018 (assessed 14 September 2018).
Supplementary Material
Additional supporting information may be found in the
supplementary material file for this article:
Table S1. Species planted in restoration at Hunua Quarry.
Table S2. Total abundance and mean abundance per sample
of mite RTUs in litter samples at the three forest sites at
Hunua Quarry.
Table S3. Total abundance and mean abundance per sample
of springtail RTUs in litter samples at the three forest sites at
Hunua Quarry.
The New Zealand Journal of Ecology provides supporting
information supplied by the authors where this may assist
readers. Such materials are peer-reviewed and copy-edited
but any issues relating to this information (other than missing
files) should be addressed to the authors.You can also read