Application of BDq method to complex tropical mixed forest ecosystems in Nigeria
←
→
Page content transcription
If your browser does not render page correctly, please read the page content below
Bois et Forêts des Tropiques – ISSN : L-0006-579X
                                                                                                        Volume 349 – 3e trimestre – septembre 2021 – p. 37-50
                                                                                                              APPLICATION DE LA MÉTHODE BD q / LE POINT SUR…     37

                                                          Application of BDq method
                                                       to complex tropical mixed forest
                                                            ecosystems in Nigeria

Friday Nwabueze Ogana1
José Javier Gorgoso-Varela2
Alfred Ossai Onefeli3

1
  University of Ibadan
Department of Social and Environmental
Forestry
Ibadan
Nigeria

2
 University of Santiago de Compostela
Campus de Lugo
Lugo
Spain

3
  University of Ibadan
Department of Forest Production
and Products
Ibadan
Nigeria

Auteur correspondant /
                                                      Photo 1.
Corresponding author:                                 Tropical mixed forest ecosystem in Nigeria.
Friday Nwabueze OGANA –                               Photo F. N. Ogana.
fn.ogana@ui.edu.ng

Doi : 10.19182/bft2021.349.a36779 – Droit d’auteur © 2021, Bois et Forêts des Tropiques – © Cirad – Date de soumission : 10 décembre 2020 ;
date d’acceptation : 5 mai 2021 ; date de publication : 1er septembre 2021.

                                                                                   Citer l’article / To cite the article
                                                                                   Ogana F. N., Gorgoso-Varela J. J., Onefeli A. O., 2021. Application of BDq
                    Licence Creative Commons :                                     method to complex tropical mixed forest ecosystems in Nigeria. Bois et
                    Attribution - 4.0 International.                               Forêts des Tropiques, 349 : 37-50. Doi : https://doi.org/10.19182/
                    Attribution-4.0 International (CC BY 4.0)                      bft2021.349.a36779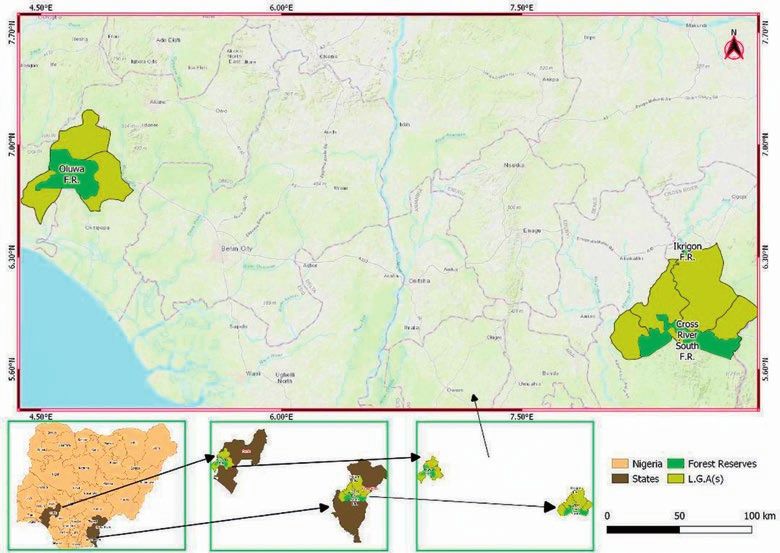
Bois et Forêts des Tropiques – ISSN: L-0006-579X
Volume 349 – 3rd quarter – September 2021 – p. 37-50
38 FOCUS / APPLICATION OF BD q METHOD
F. N. Ogana, J. J. Gorgoso-Varela,
A. O. Onefeli
RÉSUMÉ ABSTRACT RESUMEN
Application de la méthode BDq dans Application of the BDq method Aplicación del método BDq a los
les écosystèmes tropicaux à forêt mixte to complex tropical mixed forest ecosistemas forestales mixtos tropicales
complexe au Nigeria ecosystems in Nigeria complejos de Nigeria
L’absence de pratiques de gestion et de The absence of management practice/ La ausencia de prácticas de gestión y
traitements sylvicoles dans les forêts silvicultural treatments in the complex tratamientos silvícolas en los complejos
tropicales mixtes complexes du Nigeria tropical mixed forests of Nigeria has led bosques mixtos tropicales de Nigeria
conduit à leur exploitation incontrôlée to uncontrolled logging in natural forest ha provocado la tala incontrolada en las
et au déclin de leur biodiversité. Pour stands and loss of biodiversity. To sustain masas forestales naturales y la pérdida
assurer le maintien de la production, de production, protection and conservation de biodiversidad. Con el objetivo de favo-
la protection et de la conservation de ces in these complex tropical mixed stands, recer la producción, la protección y la
peuplements mixtes complexes, la pré- this study proposes the application of a conservación de estas complejas masas
sente étude propose l’application d’une selection method – the BDq method (B: mixtas tropicales, este estudio propone
méthode de sélection, dite méthode basal area, D: maximum diameter, q-ratio) la aplicación de un método de selec-
BDq (B : surface terrière ; D : diamètre to manage these stands. Two strata were ción —el método BDq (B: área basal, D:
maximal ; q-ratio) pour leur gestion. Un used as a pilot test: stratum 1 consisted diámetro máximo, ratio q)— para gestio-
essai pilote a porté sur deux strates, of 15 plots and stratum 2 of 7 plots, each narlas. Se utilizaron dos estratos como
comportant 15 parcelles pour la strate 1 with an area of 0.25 ha. Only trees with prueba piloto: el estrato 1 constaba de
et 7 parcelles pour la strate 2, chacune a diameter at breast height (d) ≥ 10.0 cm 15 parcelas y el estrato 2, de 7 parcelas,
avec une superficie de 0,25 ha. Seuls were considered in this study. Harvesting cada una con una superficie de 0,25 ha.
les arbres avec un diamètre à hauteur with the BDq method was quantified, En este estudio sólo se consideraron los
de poitrine D ≥ 10,0 cm ont été pris en by setting B at 20 m2, 25 m2 and 30 m2/ árboles con un diámetro a la altura nor-
compte pour cette étude. La récolte de ha corresponding respectively to heavy, mal (D) ≥ 10,0 cm. Se cuantificó el apro-
bois avec la méthode BDq a été quanti- medium and light harvesting regimes. vechamiento maderero con el método
fiée selon l’intensité d’exploitation, avec D was set at 65 cm and the q-ratio was BDq, fijando B en 20 m2/ha, 25 m2/ha y
B à 20 m2, 25 m2 et 30 m2/ha correspon- computed for each plot. The results 30 m2/ha, correspondientes respectiva-
dant respectivement à un régime intensif, showed that the three BDq regimes mente a los regímenes de cosecha inten-
modéré et peu intense, pour un diamètre prescribed (heavy, medium and light) siva, media y ligera. D se fijó en 65 cm y
D à 65 cm. Le q-ratio a été calculé pour yielded reasonable felling intensities (FI), se calculó el ratio q para cada parcela.
chacune des parcelles. Les résultats derived as the percentage of extracted Los resultados mostraron que los tres
montrent que les trois régimes BDq pres- volume (Vext) and biomass (Wext). The Vext regímenes de BDq prescritos (intensivo,
crits (intensif, modéré et peu intense) and FI for stratum 1 ranged from 39.94- medio y ligero) dieron lugar a intensida-
permettent des intensités d’abattage (FI) 62.30 m3/ha and 11.22-18.18%; the des de tala (FI) razonables, derivadas
raisonnables, en pourcentage du volume results for stratum 2 were 30.44-51.33 del porcentaje de volumen extraído (Vext)
extrait (Vext) et de la biomasse (Wext). Vext m3/ha and 10.02-17.57%. For biomass, y de la biomasa extraída (Wext). El Vext y
et FI pour la strate 1 varient entre 39,94- the Wext and FI ranged from 18.46-29.82 el FI del estrato 1 obtenidos fueron de
62,30 m3/ha et 11,22-18,18 % et entre t/ha and 9.40-15.95% for stratum 1 39,94-62,30 m3/ha y 11,22-18,18 %; los
30,44-51,33 m3/ha et 10,02-17,57 % and 14.16-24.82 t/ha and 9.73-17.50% resultados del estrato 2 fueron de 30,44-
pour la strate 2. Pour la biomasse, Wext for stratum 2. These findings show that 51,33 m3/ha y 10,02-17,57 %. En cuanto
et FI varient entre 18,46-29,82 t/ha et applying the BDq method to the complex a la biomasa, el Wext y el FI obtenidos fue-
9,40-15,95 % pour la strate 1 et entre tropical mixed forests of Nigeria would ron de 18,46-29,82 t/ha y 9,40-15,95 %
14,16-24,82 t/ha et 9,73-17,50 % pour yield attractive stands. para el estrato 1, y 14,16-24,82 t/ha
la strate 2. Ces constats indiquent que y 9,73-17,50 % para el estrato 2. Estos
l’application de la méthode BDq dans les Keywords: continuous cover forestry, resultados muestran que la aplicación
forêts tropicales mixtes et complexes du natural forest stands, residual basal del método BDq a los complejos bosques
Nigeria permettrait d’obtenir des peuple- area, silvicultural treatment, timber, mixtos tropicales de Nigeria permitiría
ments intéressants. Weibull distribution, Nigeria. obtener producciones de masas foresta-
les interesantes.
Mots-clés : gestion sylvicole à couvert
continu, peuplements forestiers Palabras clave: silvicultura de cobertura
naturels, surface terrière résiduelle, continua, masas forestales naturales,
traitement sylvicole, bois, distribution de área basal residual, tratamiento
Weibull, Nigeria. silvícola, madera, distribución de
Weibull, Nigeria.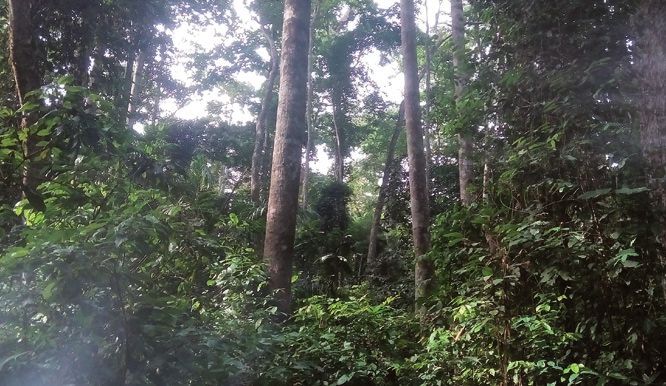
Bois et Forêts des Tropiques – ISSN : L-0006-579X
                                                                                           Volume 349 – 3e trimestre – septembre 2021 – p. 37-50
                                                                                                 APPLICATION DE LA MÉTHODE BD q / LE POINT SUR…     39

                     Introduction

       The tropical rain forest is one of the most diverse biomes
of the world (Dupuy et al., 1999; Turner, 2001). It is charac-
terised by multiple species composition and multi-layered
structure (Temesgen et al., 2014). Such complex ecosystems                The selection method in the CCF systems can best be
provide a wider array of benefits and can address some eco-         achieved with the BDq method (Guldin, 1991). The “BDq
logical and environmental issues compared to monoculture            method refers to the stand structure that can be uniquely
stands (Schütz et al., 2012). To sustain production, protec-        determined for any combination of residual basal area (B),
tion and conservation in the tropical forest ecosystem, there       maximum retained diameter class (D), and negative expo-
is a need to adopt effective management practice(s). Up to          nential constant between diameter classes (q)” (Guldin,
the present time, there is little or no management practice/        1991). Under the BDq method, the harvest is quantified by
silvicultural treatments in the complex tropical mixed forests      specifying values for the residual basal area (B), maximum
of Nigeria. This is evidence in the uncontrolled exploitation       diameter (D) and the q-factor (q). The B, D and q parame-
of natural forest stands in the country.                            ters are then used to derive the target (ideal) stand (Graz
       A well-known management system that will ensure the          and von Gadow, 2005; Guldin, 1991). The distribution of the
sustainability of production, protection and conservation in        target stand is then compared to the actual stand; and har-
the tropical mixed forest stand is Continuous Cover Forestry        vest (allowable cut) is prescribed by the difference between
(CCF). CCF is a management system that is “characterised by         the two stands (Guldin, 1991). Harvest is only permitted for
selective harvesting and natural regeneration” (Schütz et al.,      those trees that exceed the diameter distribution of the tar-
2012). Its operability is based on certain principles which         get stand. The BDq has been consistently used in the mana-
include: continuous cover (avert large clear-felling), stability    gement of uneven-aged stands in different parts of the world
(sustain stable forest structure) and naturalness (biodiver-        (Guldin, 1991; Baker et al., 1996; Cancino and von Gadow,
sity) (Davies et al., 2008). Mason et al. (1999) asserted that      2002; Graz and von Gadow, 2005; Brzeziecki and Kornat,
to ensure continuous cover, trees on stand > 0.25 ha should         2011; Drozdowski et al., 2014; Sharma et al., 2014).
not be completely harvested. The benefits of managing                     To date, there is neither any proper management sys-
forest stand under the CCF systems include but not limited          tem nor silvicultural treatment been carried out in the com-
to improve ecological resilience, maintain the biodiversity         plex tropical mixed stands in Nigeria. It is expected that
of habitats, enhance the stands capacity to resist climate          the use of the BDq method will help to sustain production,
change, improve carbon sequestration potential, aesthetic           protection and conservation in the complex tropical mixed
and recreational value etc. (Guldin, 2011; von Gadow et al.,        forest ecosystem of the region. Therefore, the main objective
2012; Schütz et al., 2012). Despite the importance of the           of this study is to evaluate the use of BDq method in the
CCF system, the system has not been applied to the forest           management of the complex mixed stand in Nigeria.
ecosystems of Nigeria.

     Photo 2.
     Tropical mixed forest ecosystem in Nigeria.
     Photo F. N. Ogana.
Bois et Forêts des Tropiques – ISSN: L-0006-579X
Volume 349 – 3rd quarter – September 2021 – p. 37-50
40 FOCUS / APPLICATION OF BD q METHOD
Figure 1.
Location of stratum 1 which consisted of 15 plots systematically demarcated in Ikrigon and Cross River State Forest Reserves
(Ikrigon+CRSFR) and stratum 2 comprised of 7 plots demarcated in the natural stand of Oluwa Forest Reserve, Ondo State.
Methodology equations developed for tropical forest trees in Nigeria by
Akindele and LeMay (2006). The pan tropical aboveground
Data biomass equation (Chave et al., 2014) was used to estimate
the tree biomass. The biomass function requires diameter,
The data for the study were collected from two strata height and wood density as input variables. Wood density of
located in Cross River State and Ondo State of Nigeria. Both individual tree species was retrieved from the global wood
states are within the tropical rain forest zone of the country. density database (Zanne et al., 2009).
Stratum 1 consisted of 15 plots systematically demarcated in Before the application of the BDq method, the tree spe-
Ikrigon and Cross River State Forest Reserves (Ikrigon+CRSFR). cies were classified as timber, non-commercial timber and
Whilst stratum 2 comprised of 7 plots demarcated in the natu- trees for fruits. The BDq method was then applied to the tim-
ral stand of Oluwa Forest Reserve, Ondo State (see figure 1). ber species. A list of the commercial timber species is pre-
Each plot has an area of 0.25 ha (i.e., 50 m x 50 m). Syste- sented in the appendix (tables A.1. and A.2.).
matic sampling technique was used for the sample plots.
Trees within each plot were identified and enumerated by Tree diameter characterisation
expert taxonomist to the species level. Flora of West Tropical
Africa (Hutchinson et al., 2014) was used for the authenti- Fitting the 3-parameter Weibull function (3P-Weibull)
cation of the identified species. Only trees with diameter at The 3-parameter Weibull function (3P-Weibull) was
breast height (d) ≥ 10.0 cm that were considered in this study. used to describe the diameter distribution of the timber
Diameters at base and breast of individual tree were mea- species in the complex mixed tropical forest ecosystems.
sured using a diameter tape while the measurement of tree This model is simple and flexible and is more suitable than
height was achieved using a vertex. Important stand variables the 2-parameter Weibull function for describing theoretical
such as the number of trees per ha, basal area per ha, quadra- uneven-aged (or irregular) truncated stands, namely with a
tic mean diameter, volume per ha and aboveground biomass minimum diameter inventory. The probability density func-
in tonnes per ha were computed from the data sets (table I). tion (pdf) and cumulative distribution function (cdf) are
The individual tree volume was estimated using the volume expressed as (Gorgoso-Varela and Rojo-Alboreca, 2014):Bois et Forêts des Tropiques – ISSN : L-0006-579X
Volume 349 – 3e trimestre – septembre 2021 – p. 37-50
APPLICATION DE LA MÉTHODE BD q / LE POINT SUR… 41
Moments
This method is based on the relationship between the
parameters of 3P-Weibull and the first and second diameter
moment i.e., arithmetic mean and variance, respectively;
expressed as equation (5) and (6). This method was recently
used by other researchers (Gorgoso-Varela et al., 2020;
where ƒ(x)is the relative frequency of tree; x represents the Pogoda et al., 2020; Sun et al., 2019):
continuous random variable (i.e., tree diameter); α is the
shape parameter (α > 0); β represents the scale parameter
(β > 0); γ is the location parameter. Three frequently used
methods were used to fit the 3P-Weibull to the individual
plot data from both zones: maximum likelihood (ML),
moments (MOM) and percentile. A general adjustment was
used for all methods by taking the location (γ) as the mini-
mum observed tree diameter in each plot due the suitability
of this value for theoretical distributions with “J reversed” where γ represents the location parameter – taken as the
–
shape. smallest diameter of the plot (i.e., 10 cm); d is the arithme-
tic mean diameter; σ2 is the variance and Γ(•)is the gamma
Maximum likelihood (ML) estimation function. The bisection iterative procedure (Gerald and
The ML estimator defined by equations (3) and (4) Wheatley, 1989) was used to solve equations (5) and (6) in
was used to estimate the shape and scale parameter of the SAS/STATTM (SAS Institute Inc., 2004).
3P-Weibull. This method was recently used by Gorgoso-Va-
rela et al. (2020): Percentile
This method is based on the relationship between the
parameters of 3P-Weibull and the diameter percentiles. The
Dubey (Dubey, 1967) percentile method was used in this
study. In this method the scale (β) and shape (α) parameters
of the 3P-Weibull function were estimated with the following
equations:
where x represents tree diameter and n is the number obser-
vation in a plot. The LIFEREG procedure in SAS/STATTM (SAS
Institute Inc., 2004) was used to estimate the shape and
scale parameters.
Table I.
Descriptive statistics of the stand variables from the two strata.
Strata Statistics N G Dg V W
(trees/ha) (m2/ha) (cm) (m3/ha) (tons/ha)
1 (15 plots) Mean 282 24.1 32.6 515 238
SD 78 9.1 3.5 209 71
Minimum 168 11.0 27.3 195 121
Maximum 440 40.9 39.6 919 372
2 (7 plots) Mean 278 19.8 29.9 390 162
SD 57 6.5 2.4 163 73
Minimum 200 14.5 27.2 267 98
Maximum 352 31.7 34.5 711 306
N: number of trees per ha; G: basal area per ha; Dg: quadratic mean diameter; V: volume per ha; W: aboveground biomass;
SD: standard deviation.Bois et Forêts des Tropiques – ISSN: L-0006-579X
Volume 349 – 3rd quarter – September 2021 – p. 37-50
42 FOCUS / APPLICATION OF BD q METHOD
where P63 is the diameter corresponding to the 63rd percen- To quantify the available growing stock for the complex
tile; γ is location parameter; r is equal 0.97; t is 0.17; pr and mixed tropical stands with a specified residual basal (B, m2/
pt represent the diameters corresponding to the 97th and ha) the following expression that is based on diameter class
17th percentiles, respectively. midpoint (di), was applied:
Evaluation statistics
The consistency of the 3P-Weibull function fitted with
ML, moments and percentile was evaluated with Kolmogo-
rov-Smirnov statistic (Dn), Cramér-von Mises statistic (ω2), Substituting Ni = N1 x q(i – 1) into equation (17) give:
mean square error (MSE) and bias. The smaller value of the
evaluation of all statistics indicates a better fit:
which when rearrange will give:
If B = N1 x K3; then N1 = B/K3. Thus K3 is also relevant in the
computation of the diameter distributions.
Specifying the residual basal area (B, m2/ha), maximum
where F(xi) and F0(xi) are the observed cumulative frequency diameter (D, cm) and q-ratio for the tropical mixed forest
distribution and theoretical cumulative frequency distri-
bution, respectively; xi (in cm) represents the diameter (i Under the BDq method, the harvest is often specified
ranged from 1 to n); n is the number of observations; ƒ(xi) first by defining: the residual basal area per ha (B, m2/ha),
and ƒ0(xi) are the observed and predicted relative frequency maximum diameter (D, cm) and q-ratio (i.e., the quotient).
of trees, respectively. In this study, three BDq regimes were evaluated for the tro-
pical mixed forests based on the residual basal area (B, m2/
The ideal irregular structures and the BDq method ha). Since there are no previous studies in this region to
support the choice of residual basal, B was intuitively set
The diameter distribution of uneven-aged forests can at 20, 25 and 30 m2/ha corresponding to heavy, medium
be expressed as (Cancino and von Gadow, 2002): and light-harvesting regimes, respectively. For beech (Fagus
sylvatica L.) stands in Central Europe Schütz et al. (2016)
proposed closely values of 20 and 24 m2/ha. The propor-
where Ni represents the number of trees in ith diameter tional residual basal area B corresponding to the managed
class; di is the diameter class midpoint (in cm); k0 the inter- trees (timber species) was used for the calculations. This
cept and k1 represents the rate of change. is to minimise overexploitation in as much only mode-
The constant rate of change between successive diame- rate allowable cut will be possible in the smaller diameter
ter class is defined by the quotient (q) (equation [14]). It pro- class. Since the minimum harvesting diameter for industrial
vides information on the characteristics such as steepness roundwood is between 30 and 35 cm (Dupuy et al., 1999),
or flatness of the inverse J-shaped distribution (Schütz et al., the maximum diameter (D) was set at 65 cm for the tropical
2012): forest. This is the diameter beyond which it is expected that
a tree should not be considered for timber purpose. Such
commercial timber trees with diameter > D, will be retained
Substituting Ni of equation (13) into equation (14) will give under the ecological system called “Green Tree Retention
equation (15): (GTR)” (Vanha-Majamaa and Jalonen, 2001). Other non-tim-
ber species such as Ricinodendron heudelotii (Baill.) Heckel,
Parkia bicolor A. Chev., Diospyros crassiflora Hiern will also
be managed under GTR.
The quotient (q) was computed for each plot from the
where w (in cm) is the width of the diameter class. Other tropical forest data as the arithmetic mean of the values
parameters are previously defined. From equation (14), Ni + 1 obtained from two successive diameter classes. A large
can be defined as: Ni x q. Thus, given a specific value of q and value (≥ 1.69) will yield a high ratio of small trees to larger
with Ni + 1 known, the number of trees in individual diameter ones – implies the production of smaller sawn-timber. Whilst
class can be computed (Graz and von Gadow, 2005). This a small value (≤ 1.1) will produce a low ratio of small trees to
can be achieved with the general expression: Ni = N1 x q(i – 1) larger ones – implies the production of larger sawn-timber
where N1 is the number of trees in the largest diameter class (Guldin, 1991).
(Cancino and von Gadow, 2002).Bois et Forêts des Tropiques – ISSN : L-0006-579X
Volume 349 – 3e trimestre – septembre 2021 – p. 37-50
APPLICATION DE LA MÉTHODE BD q / LE POINT SUR… 43
Results and discussion
The descriptive statistics of the estimated location (γ),
Application of the BDq: the felling intensity (FI), scale (β) and shape (α) parameters of the Weibull distribu-
volume (V, m3/ha) and biomass (W, tons/ha) to extract tion by maximum likelihood, moments and percentiles are
presented in table II. The computed Weibull location parame-
Diameter distribution of the target (i.e., ideal) stand ter was the same for all methods because the parameter was
derived was compared by the BDq parameters and the taken as the minimum observed diameter per inventory plot.
actual distribution derived from the inventory data. The The mean values of the location parameter for stratum 1
difference between the two distributions was used to deter- (Ikrigon+CRSFR) and stratum 2 (Oluwa FR) were 10.8467 and
mine the number of trees per ha to extract from the stand 10.4428, respectively. This parameter marks the beginning
(Guldin, 1991) and the corresponding volume and biomass. of the diameter distribution. A similar adjustment has been
To ensure sustainability, the felling intensity (FI) was defined used to achieve good performance with Weibull distribution
as: in the tropical rain forest zone (Ogana et al., 2015; Ogana
and Gorgoso-Varela, 2015). The estimated scale and shape
parameters varied across the estimation methods. The
values of the estimated parameters reflect an ideal struc-
ture of all-aged natural forest i.e., inverse J-shaped diameter
[20] distributions. Of the three parameters of the Weibull dis-
where FI is the felling intensity; Ni represents the number of tribution, the shape parameter is the most important with
trees per ha in diameter class in actual diameter distribu- respect to the BDq method. This is based on the fact that it
tion; N(i+1)t number of trees per ha in diameter class direc- determines the shape of the diameter distributions. A value
tly higher to i in the target (ideal) diameter distribution; Pi of α ≤ 1 produces an inverse J-shaped (Vinet and Zhedanov,
represents the product (i.e., volume or biomass) of diameter 2011). The mean values of the shape parameter (α) for stra-
class i and Pt represents the total actual products (volume tum 2 were within the limit α ≤ 1 especially, estimates from
or biomass). moments and percentile methods.
Table II.
Parameter values for the Weibull distribution fitted using three estimation methods.
Strata Method Par. Mean SD Minimum Maximum
1 (N=15) ML γ 10.8467 1.0343 10.0000 14.0000
β 20.0789 4.1944 14.5138 29.7753
α 1.2091 0.2410 0.8387 1.8861
Moment γ 10.8467 1.0343 10.0000 14.0000
β 19.4796 4.5537 13.1217 29.7334
α 1.1856 0.2818 0.8529 1.9288
Percentile γ 10.8467 1.0343 10.0000 14.0000
β 19.9762 5.8586 12.5420 31.3400
α 1.1210 0.2448 0.7850 1.7595
2 (N=7) ML γ 10.4428 0.3047 10.0000 10.9000
β 14.0344 1.9001 11.6868 17.6960
α 1.0266 0.0905 0.8854 1.1814
Moment γ 10.4428 0.3047 10.0000 10.9000
β 12.9741 1.9798 10.7358 16.6752
α 0.9303 0.1489 0.7180 1.1855
Percentile γ 10.4428 0.3047 10.0000 10.9000
β 11.5551 1.9195 9.6640 15.3800
α 0.9870 0.1188 0.8604 1.1721
Par.: parameter; SD: standard deviation; ML: maximum likelihood.Bois et Forêts des Tropiques – ISSN: L-0006-579X
Volume 349 – 3rd quarter – September 2021 – p. 37-50
44 FOCUS / APPLICATION OF BD q METHOD
using moments can be disaggregated
from a yield table and apply. A parallel
Table III. study by Sun et al. (2019) also reported
Characterisation of the natural mixed strata considering timber species accor- good fit with the Weibull function fitted by
ding to shape parameter α of the Weibull distribution fitted by moments. moment for characterising diameter dis-
tributions in uneven-aged mixed stands
of pine and oak. In Nigeria, Ogana (2020)
Strata Uneven-aged Two-aged Even-aged Total plots also observed that using moment-based
(α ≤ 1) (1 < α ≤ 1.35) (α > 1.35) estimator to fit the Weibull distribution
produced results comparable to other
complex estimators. The author eva-
1 6 (40%) 5 (33.3%) 4 (26.7%) 15
luated ten estimators used for the Wei-
2 6 (85.7%) 1 (14.3%) 0 (0%) 7
bull distribution in the study.
The line plots of the mean square
error statistic describing the fit of the Wei-
bull distribution fitted by ML, moments
and percentile across the diameter
Table IV.
classes are presented in figures 2 and 3.
Mean values of Kolmogorov-Smirnov statistic (Dn),
Cramér-von Mises statistic (ω2), Mean Squared Error (MSE) and bias. The line patterns produced by the Weibull
distribution fitted by the three methods
were the same – characterised by increa-
Strata Method Dn ω2 MSE bias sing and decreasing behaviour. However,
the MSE declined steadily in the larger
diameter classes in both strata.
1 ML 0.105788 0.096385 0.000332 0.000186 The mean statistics of the q-ratio for
Moment 0.105100 0.082868 0.000339 0.000173 the total plots and the uneven-aged plots
Percentile 0.110735 0.147039 0.000324 0.000824 (i.e., plots considering timber species) in
2 ML 0.115378 0.110994 0.000283 0.000262 the two strata are shown in table V. The
Moment 0.121492 0.079650 0.000311 0.000396 mean values of the q-ratio for the une-
Percentile 0.122601 0.119634 0.000294 0.000610 ven-aged plots in stratum 1 and stratum 2
were 1.479 and 1.487, respectively. The
Characterisation of the natural stand strata conside- ratio will ensure the sustainable produc-
ring timber species according to the shape parameter (α) tion of both sawn-timber in the mixed stands. Guldin (1991)
of the Weibull distribution fitted by moments showed that asserted that a larger “q-ratio will steepen the ideal (target)
40% of the plots was classified as uneven-aged (α ≤ 1), distribution, retaining more small trees than larger ones and
33.3% as two-aged i.e., “semi-regular” (1 < α ≤ 1.35) and in consequence, increasing harvesting volume in the mixed
26.7% as even-aged (α > 1.35) in stratum 1 (Ikrigon+CSFR) stands”. An ideal q-ratio could be intuitively chosen for a
(table III). However, in stratum 2 (Oluwa forest FR), 85.7% stand depending on the economic policy or management
of the plots were classified as uneven-aged and 14.3% as goal (Graz and von Gadow, 2005). However, it is more sui-
two-aged. No plot was in the class of even-aged. It is essen- table to compute q-ratio for the individual plot, such a proce-
tial to recognise two-aged stands because they could be dure will improve accuracy and provide flexibility.
changed to uneven-aged without considerable alteration of The results of a simulated logging by applying the three
their present structure. regimes of BDq to the two strata in which the maximum
The result of the evaluation statistics showed that the diameter (D) was set at 65 cm and q-ratio derived by plot is
Weibull distribution fitted by maximum likelihood, moments shown in table VI. The three regimes specified were heavy
and percentile performed better in the first stratum (Ikri- (20 m2/ha), medium (25 m2/ha) and light (30 m2/ha). For
gon+CRSFR) compared with the second stratum (Oluwa each regime and stratum, the ideal basal area per ha applied
forest) (table IV). The Weibull distribution fitted by moments (Bapplied) was lower compared with the specification for that
had the smallest Kolmogorov-Smirnov (Dn) (0.105100) regime. The values only correspond to the quantity of timber
statistic, Cramér-von Mises statistic (ω2) (0.082868) and species in the stratum. Only timber species are managed
bias (0.000173) in stratum 1 (Ikrigon+CSFR) (table IV). It under the BDq method; whilst some species will be retained
also presented the smallest Cramér-von Mises statistic as GTR, including non-timber and fruit trees. If a heavy BDq
(ω2) (0.079650) in the second stratum. The Weibull distri- regime is to be considered for the uneven-aged plots in stra-
bution fitted with Maximum likelihood performed equally tum 1, the number of trees per ha to extract (Next) is 28.56
well, especially in the second stratum. The Weibull distri- N/ha with corresponding volume (Vext) and biomass (Wext) of
bution fitted by percentile produced the poorest fits. The 62.30 m3/ha and 29.82 tons/ha, respectively. The required
estimation method by moments remains one of the simp- felling intensities in % volume and biomass of the total of
lest procedures for estimating the parameters of the Weibull the managed species (FIM) will be 18.18 and 15.95, res-
distributions. The variance and mean diameter required for pectively. In the case of stratum 2 using heavy BDq regime,Bois et Forêts des Tropiques – ISSN : L-0006-579X
Volume 349 – 3e trimestre – septembre 2021 – p. 37-50
APPLICATION DE LA MÉTHODE BD q / LE POINT SUR… 45
Stratum 1
0.003
Maximum Likelihood
0.0025
Moments
Percentile
0.002
MSE
0.0015
0.001
0.0005
0
10.5
13.5
16.5
19.5
22.5
25.5
28.5
31.5
34.5
37.5
40.5
43.5
46.5
49.5
52.5
55.5
58.5
61.5
64.5
67.5
70.5
73.5
76.5
79.5
82.5
85.5
88.5
91.5
94.5
97.5
100.5
103.5
106.5
109.5
112.5
115.5
118.5
121.5
124.5
DBH (cm)
Figure 2.
Behaviour of the MSE for the fits by maximum likelihood, moments and percentile in each diameter class for stratum 1.
Stratum 2
0.003
Maximum Likelihood
0.0025
Moments
Percentile
0.002
MSE
0.0015
0.001
0.0005
0
10.5
13.5
16.5
19.5
22.5
25.5
28.5
31.5
34.5
37.5
40.5
43.5
46.5
49.5
52.5
55.5
58.5
61.5
64.5
67.5
70.5
73.5
76.5
79.5
82.5
85.5
88.5
91.5
94.5
97.5
100.5
103.5
106.5
109.5
112.5
115.5
118.5
DBH (cm)
Figure 3.
Behaviour of the MSE for the fits by maximum likelihood, moments and percentile in each diameter class for stratum 2.Bois et Forêts des Tropiques – ISSN: L-0006-579X
Volume 349 – 3rd quarter – September 2021 – p. 37-50
46 FOCUS / APPLICATION OF BD q METHOD
Table V.
Mean statistics of the q factor for total plots and uneven-aged plots
in both strata.
Strata Mean SD Maximum Minimum
1 (total plots) 1.479 0.150 1.750 1.200
1 (uneven-aged plots) 1.479 0.171 1.678 1.200
2 (total plots) 1.489 0.137 1.778 1.361
2 (uneven-aged plots) 1.487 0.149 1.778 1.361
Next will equal to 34.60 N/ha and will yield Vext and Wext of above D, together with other non-timber species will consti-
51.33 m3/ha and 24.68 tons/ha, respectively. The FIM for tute part of the GTR. Few timber species are available for har-
volume and biomass in the simulated logging will be 17.57 vest in stratum 2. Some timber species in the lower diame-
and 17.50, respectively. To our knowledge, this is the first ter class of 22.5 and 27.5 cm could also be harvested for
application of the BDq method to a complex mixed tropical other purposes (e.g. pole) under heavy and medium regimes
forest ecosystem, especially in Nigeria. (treatments) except in stratum 2 plot 1. List of timber species
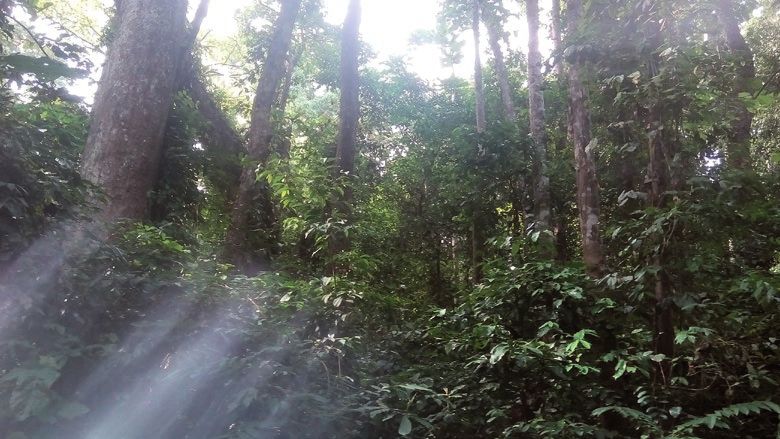
The graph of the observed and target (ideal) diameter in those classes include Pterygota bequaertii De Wild., Celtis
distributions of timber species derived by the applying three zenkeri Engl., Bombax buonopozense P. Beauv., Terminalia
regimes of B, with D = 65 cm and q computed for each plot superba Engl. & Diels, Picralima nitida (Stapf) T. Durand &
in the two strata is presented in figure 4. Four representative H. Durand, Milicia excelsa (Welw.) C.C. Berg, Triplochiton
plots (2 each from stratum 1 and stratum 2) with the highest scleroxylon K. Schum., Malacantha alnifolia (Baker) Pierre,
density were used. From stratum 1, plot 4 with a q fac- Cedrela odorata L., Cleistopholis patens (Benth.) Engl. &
tor = 1.43, harvesting is only possible in diameter classes Diels, Antiaris toxicaria Lesch., and Hannoa klaineana Pierre
of 37.5, 47.5 and 52.5 cm. The commercial timber species ex Engl.
in those classes are Cola gigantea A. Chev., and Gmelina Adoption of the BDq selection method will ensure sus-
arborea Roxb. Other commercial timber species such as Dia- tainable management of the mixed stands. And as part of
lium pachyphyllum Harms, Dialium guineense Willd. could the CCF systems, the method will enhance the stands’ capa-
also be harvested in the stratum (plot 6). The commercial city to resist climate change, improve carbon sequestra-
timber such as Albizia perrieri (Drake) R. Vig., Afzelia afri- tion potential, promote better biodiversity of habitats, etc.
cana Sm., Dialium guineense Willd., Milicia excelsa (Welw.) (Schütz et al., 2012).
C.C. Berg and Pterocarpus santalinoides DC. with diameter
Table VI.
Mean values in each stratum after application of three regimes of the BDq method for D = 65 cm
and q calculated by plot.
Strata Regime BTotal Bapplied Next Vext FIM FIT Wext FIM
(m2/ha) (m2/ha) (Pies/ha) (m3/ha) (%V) (%V) (tons/ha) (%W)
1 (total plots) Heavy 20 15.52 69.43 190.66 37.19 30.94 82.05 36.53
Medium 25 19.41 52.94 166.11 31.47 26.20 70.77 30.77
Light 30 23.29 41.99 147.07 27.15 22.59 62.32 26.47
1 (uneven-aged plots) Heavy 20 15.52 28.56 62.30 18.18 14.62 29.82 15.95
Medium 25 19.41 15.55 47.65 13.68 10.98 22.22 11.63
Light 30 23.29 9.84 39.94 11.22 8.88 18.46 9.40
2 (total plots) Heavy 20 14.69 30.36 44.74 15.70 11.69 21.56 15.72
Medium 25 18.37 18.66 33.84 11.34 8.79 15.97 11.14
Light 30 22.04 12.49 26.09 8.59 6.77 12.14 8.34
2 (uneven-aged plots) Heavy 20 14.69 34.60 51.33 17.57 13.32 24.68 17.50
Medium 25 18.37 21.77 39.48 13.23 10.26 18.63 12.99
Light 30 22.04 14.57 30.44 10.02 7.90 14.16 9.73
B: residual basal area for the commercial managed species; Next: number of trees to extract; Vext: volume to extract;
FIM: felling intensity in % volume and biomass of the total of the managed species; FIT: felling intensity in % of the total volume
of species in the stratum (timber, non-timber and trees for fruits); Wext: biomass to extract.Bois et Forêts des Tropiques – ISSN : L-0006-579X
Volume 349 – 3e trimestre – septembre 2021 – p. 37-50
APPLICATION DE LA MÉTHODE BD q / LE POINT SUR… 47
140 Stratum 1: Mixed Forest N observed
Plot 4; q = 1.43
120 Heavy treatment
Medium treatment
100 Light treatment
80
Trees/ha
60
40
20
0
5
5
5
5
5
5
.5
.5
.5
.5
.5
.5
.5
.5
.5
.5
.5
.5
.5
.5
.5
.5
.5
5
2.
7.
2.
7.
2.
7.
12
17
22
27
32
37
42
47
52
57
62
67
72
77
82
87
92
97
10
10
11
11
12
12
DBH (cm)
140 Stratum 1: Mixed Forest
N observed
Plot 6; q = 1.33
120 Heavy treatment
Medium treatment
100 Light treatment
80
Trees/ha
60
40
20
0
12.5 17.5 22.5 27.5 32.5 37.5 42.5 47.5 52.5 57.5 62.5 67.5 72.5
DBH (cm)
140 Stratum 2: Mixed Forest
Plot 1; q = 1.45 N observed
120 Heavy treatment
Medium treatment
100 Light treatment
80
Trees/ha
60
40
20
0
12.5
17.5
22.5
27.5
32.5
37.5
42.5
47.5
52.5
57.5
62.5
67.5
72.5
77.5
82.5
87.5
92.5
97.5
102.5
107.5
112.5
117.5
DBH (cm)
140 Stratum 2: Mixed Forest
Plot 7; q =1.42 N observed
120 Heavy treatment
Medium treatment
100 Light treatment
80
Trees/ha
60
40
20
0
12.5 17.5 22.5 27.5 32.5 37.5 42.5 47.5 52.5 57.5 62.5 67.5 72.5
DBH (cm)
Figure 4.
Observed and ideal diameter distributions of timber species derived by applying BDq method for three values of B,
D = 65 cm and q computed for the individual plots in the two strata.Bois et Forêts des Tropiques – ISSN: L-0006-579X
Volume 349 – 3rd quarter – September 2021 – p. 37-50
48 FOCUS / APPLICATION OF BD q METHOD
Appendice
Table A.1.
Commercial timber species in stratum 1.
S/N Species S/N Species S/N Species
1 Afzelia africana 26 Dialium guineense 51 Pterocarpus mibreadii
2 Albizia gummifera 27 Dialium pachyphyllum 52 Pterocarpus osun
3 Albizia lebbeck 28 Distemonanthus benthamianus 53 Pterocarpus santalinoides
4 Albizia perrieri 29 Dracaena mannii 54 Pterocarpus soyauxi
5 Albizia zygia 30 Entandrophragma cylindricum 55 Pterygota macrocarpa
6 Allanblackia floribunda 31 Funtumia africana 56 Pycnanthus angolensis
7 Alstonia boonei 32 Funtumia elastica 57 Spathodea campanulata
8 Anthocleista vogelii 33 Gmelina arborea 58 Staudtia stipitata
9 Antiaris toxicaria 34 Gossweilerodendron balsamiferum 59 Sterculia setigera
10 Baillonella toxisperma 35 Hylodendron gabunense 60 Strombosia pustulata
11 Barteria nigritana 36 Khaya grandifoliola 61 Symphonia globulifera
12 Berlinia confusa 37 Khaya ivorensis 62 Tectona grandis
13 Blighia sapida 38 Klainedoxa gabonensis 63 Terminalia superba
14 Borassus aethiopium 39 Lannea welwitschii 64 Tetrapleura tetraptera
15 Brachystegia nigerica 40 Lophira alata 65 Treculia obovoidea
16 Carapa procera 41 Lovoa trichilioides 66 Uapaca guineensis
17 Ceiba petandra 42 Margaritaria discoidea 67 Uapaca staudtii
18 Celtis zenkeri 43 Milicia excelsa 68 Xylopia aethiopica
19 Chrysophyllum giganteum 44 Musanga cecropioides 69 Zanthoxylum zanthoxyloides
20 Cleistopholis patens 45 Pausinystalia talbotii
21 Coelocaryon preussii 46 Pentaclethra macrophylla
22 Cola gigantea 47 Pentadesma butyracea
23 Combretodendron macrocarpum 48 Pierreodendron africanum
24 Cylicodiscus gabunnesis 49 Piptadeniastrum africanum
25 Daniella ogea 50 Pseudospondias microcarpa
Table A.2.
Commercial timber species in stratum 2.
S/N Species S/N Species
1 Afzelia bipindensis 22 Lovoa trichilioides
2 Albizia ferruginea 23 Malacantha alnifolia
3 Anthocleista djalonensis 24 Mansonia altissima
4 Antiaris toxicaria 25 Maranthes robusta
5 Bombax buonopozense 26 Milicia excelsa
6 Brachystegia eurycoma 27 Mitragyna stipulosa
7 Carapa procera 28 Musanga cecropioides
8 Cedrela odorata 29 Nesogordonia papaverifera
9 Ceiba pentandra 30 Pausinystalia talbotii
10 Celtis zenkeri 31 Picralima nitida
11 Cleistopholis patens 32 Pterygota bequaertii
12 Cordia millenii 33 Pterygota macrocarpa
13 Distemonanthus benthamianus 34 Pycnanthus angolensis
14 Entandrophragma angolense 35 Staudtia stipitata
15 Entandrophragma cylindricum 36 Sterculia rhinopetala
16 Ficus mucuso 37 Sterculia tragacantha
17 Funtumia elastica 38 Strombosia pustulata
18 Guarea cedrata 39 Terminalia superba
19 Hannoa klaineana 40 Triplochiton scleroxylon
20 Khaya ivorensis 41 Uapaca heudelotiiBois et Forêts des Tropiques – ISSN : L-0006-579X
Volume 349 – 3e trimestre – septembre 2021 – p. 37-50
APPLICATION DE LA MÉTHODE BD q / LE POINT SUR… 49
Conclusion
This study has successively applied the BDq method Drozdowski S., Bielak K., Buraczyk W., Gawron L., Jaros R.,
to the complex mixed tropical forests of Nigeria. Harvest in Zybura H., 2014. Silvicultural planning in complex struc-
the stands was defined using three regimes of residual basal tures of silver fir by means of the BDq method in Zagnańsk
area (20, 25 and 30 m2/ha) with desirable felling intensi- Forest District. Sylwan, 158 (9): 651-660. https://www.
ties that would ensure the sustainability of the timber spe- researchgate.net/profile/Stanislaw_Drozdowski2/
cies. The number of trees to extract from the stand and the publication/286935815_Silvicultural_planning_in_
corresponding volume and aboveground biomass by using complex_structures_of_silver_fir_by_means_of_the_
the BDq method were rational. Commercial timber species BDq_method_in_Zagnansk_Forest_District/links/
with a diameter greater than the 65 cm, together with other 56715f2408ae0d8b0cc2f0a0.pdf
non-timber and trees for fruits will comprise the GTR sys- Dubey S. D., 1967. Some Percentile Estimators for Weibull
tem. Thus, with the adoption of BDq method more attractive Parameters. Technometrics, 9 (1): 119-129. https://doi.org/
stand will be produced. 10.1080/00401706.1967.10490445
Dupuy B., Maitre H.-F., Amsallem I., 1999. Tropical forest
Funding management techniques: a review of the sustainability of
This research did not receive any specific grant from funding forest management practices in tropical countries. Working
agencies in the public, commercial, or not-for-profit sectors. Paper, FAO/FPIRS/04. http://www.fao.org/3/a-x4110e.pdf
von Gadow K., Zhang C. Y., Wehenkel C., Pommerening A.,
Corral-Rivas J., Korol M., et al., 2012. Forest Structure and
Diversity. In: Pukkala T., von Gadow K. (eds). Continuous
Cover Forestry. Managing Forest Ecosystems, vol. 23,
29-83. Dordrecht, Netherlands, Springer. https://doi.
org/10.1007/978-94-007-2202-6_2
References Gerald C. F., Wheatley P. O., 1989. Applied numerical analy-
sis. 4th edition. Reading, MA, USA, Addison-Wesley Publi-
Akindele S. O., LeMay V. M., 2006. Development of tree
shing Co.
volume equations for common timber species in the tro-
pical rain forest area of Nigeria. Forest Ecology and Mana- Gorgoso-Varela J. J., Rojo-Alboreca A., 2014. Use of Gumbel
gement, 226 (1-3): 41-48. https://doi.org/10.1016/j. and Weibull functions to model extreme values of diameter
foreco.2006.01.022 distributions in forest stands. Annals of Forest Science, 71:
741-750. https://doi.org/10.1007/s13595-014-0369-1
Baker J. B., Cain M. D., Guldin J. M., Murphy P. A., Shelton M.
G., 1996. Uneven-aged silviculture for the loblolly and short- Gorgoso-Varela J. J., Ogana F. N., Ige P. O., 2020. A compari-
leaf pine forest cover types. In: General Technical Report son between derivative and numerical optimization methods
Southern Research Station, USDA Forest Service, S0-118: used for diameter distribution estimation. Scandinavian
iv, 65 p. U.S. Department of Agriculture, Forest Service, Sou- Journal of Forest Research, 35 (3-4): 156-164. https://doi.
thern Forest Experiment Station. https://doi.org/10.2737/ org/10.1080/02827581.2020.1760343
so-gtr-118 Graz F. P., von Gadow K., 2005. Application of a ‘stem
Brzeziecki B., Kornat A., 2011. Application of the BDq number guide curve’ for sustainable harvest control in
method in uneven-aged stands silviculture. Sylwan, 155 the dry woodland savanna of northern Namibia. Sou-
(9): 589-598. https://www.cabdirect.org/cabdirect/abs- thern African Forestry Journal, 204 (1): 37-44. https://doi.
tract/20113395708 org/10.2989/10295920509505225
Cancino J., von Gadow K., 2002. Stem number guide curves Guldin J. M., 1991. Uneven-aged BDq regulation of Sierra
for uneven-aged forests development and limitations. In: Nevada mixed conifers. Western Journal of Applied Forestry,
von Gadow K., Nagel J., Saborowski J. (eds). Continuous 6 (2): 27-32. https://doi.org/10.1093/wjaf/6.2.27
Cover Forestry. Managing Forest Ecosystems, vol. 4, Guldin J. M., 2011. Experience with the selection method in
163-174. Dordrecht, Netherlands, Springer. https://doi. pine stands in the southern United States, with implications
org/10.1007/978-94-015-9886-6_13 for future application. Forestry, 84 (5): 539-546. https://doi.
Chave J., Réjou-Méchain M., Búrquez A., Chidumayo E., Col- org/10.1093/forestry/cpr035
gan M. S., Delitti W. B. C., et al., 2014. Improved allometric Hutchinson J., Datziel J. M., Keay R. W. J., Hepper F. N., 2014.
models to estimate the aboveground biomass of tropical Flora of West Tropical Africa. Vol.1, Part 2. London, UK, Royal
trees. Global Change Biology, 20 (10): 3177-3190. https:// Botanical Gardens, Kew, 330 p.
doi.org/10.1111/gcb.12629 Mason B., Kerr G., Simpson J., 1999. What is continuous
Davies O., Haufe J., Pommerening A., 2008. Silvicultural cover forestry? Forestry Commission Information, Note 29.
principles of continuous cover forestry: a guide to best prac- Forestry Commission, Edinburgh.
tice. Forestry Commission Wales, England, 111 p.Bois et Forêts des Tropiques – ISSN: L-0006-579X
Volume 349 – 3rd quarter – September 2021 – p. 37-50
50 FOCUS / APPLICATION OF BD q METHOD
Ogana F. N., 2020. An evaluation of ten estimators for fitting Vinet L., Zhedanov A., 2011. A “missing” family of clas-
two-parameter weibull function to Nigerian forest stands. sical orthogonal polynomials. Journal of Physics A:
Eurasian Journal of Forest Science, 8 (2): 129-139. https:// Mathematical and Theoretical, 44: 085201. https://doi.
doi.org/10.31195/ejejfs.712992 org/10.1088/1751-8113/44/8/085201
Ogana F. N., Gorgoso-Varela J. J., 2015. Comparison of Zanne A. E., Lopez-Gonzalez G., Coomes D. A., Ilic J., Jansen
estimation methods for fitting Weibull distribution to the S., Lewis S. L., et al., 2009. Data from: Towards a worldwide
natural stand of Oluwa forest reserve, Ondo State, Nigeria. wood economics spectrum. Global wood density database.
Journal of Research in Forestry, Wildlife and Environment, 7 Dryad, Dataset. https://doi.org/10.5061/dryad.234
(2): 81-90. https://www.ajol.info/index.php/jrfwe/article/
view/125077
Ogana F. N., Osho J. S. A., Gorgoso-Varela J. J., 2015. Compa-
rison of beta, gamma Weibull distributions for characterising
Ogana et al. – Contribution des auteurs
tree diameter in Oluwa forest reserve, Ondo State, Nigeria.
Rôle du contributeur Noms des auteurs
Journal of Natural Sciences Research, 5 (4): 28-36. https://
iiste.org/Journals/index.php/JNSR/article/view/20167 Conceptualization F. N. Ogana
Pogoda P., Ochał W., Orzeł S., 2020. Performance of Kernel Data Curation F. N. Ogana
estimator and Johnson SB function for modeling diameter dis- Formal Analysis J. J. Gorgoso-Varela
tribution of black alder (Alnus glutinosa (L.) Gaertn.) stands.
Methodology F. N. Ogana
Forests, 11 (6). https://doi.org/10.3390/F11060634
SAS Institute Inc., 2004. SAS/STAT 9.1 User’s Guide (Vol. Resources A. O. Onefeli
1-7). Cary, NC, USA, SAS Institute Inc. https://www.scirp. Visualization F. N. Ogana, J. J. Gorgoso-Varela
org/(S(i43dyn45teexjx455qlt3d2q))/reference/References- Writing – Original Draft F. N. Ogana
Papers.aspx?ReferenceID=1625989 Preparation
Schütz J. P., Pukkala T., Donoso P. J., von Gadow K., 2012. Writing – Review & J. J. Gorgoso-Varela, A. O. Onefeli
Editing
Historical emergence and current application of CCF. In: Puk-
kala T., von Gadow K. (eds). Continuous Cover Forestry.
Managing Forest Ecosystems, vol. 23, 1-28. Dordrecht,
Netherlands, Springer. https://doi.org/10.1007/978-94-
007-2202-6_1
Schütz J. P., Saniga M., Diaci J., Vrska T., 2016. Comparing Bois et Forêts des Tropiques - Revue scientifique du Cirad -
close-to-nature silviculture with processes in pristine forest: © Bois et Forêts des Tropiques © Cirad
lessons from Central Europe. Annals of Forest Science, 73:
911-921. https://doi.org/10.1007/s13595-016-0579-9
Sharma A., Bohn K., Jose S., Cropper W. P., 2014. Converting
even-aged plantations to uneven-aged stand conditions: A
simulation analysis of silvicultural regimes with slash pine Cirad - Campus international de Baillarguet,
(Pinus elliottii Engelm.). Forest Science, 60 (5): 893-906. 34398 Montpellier Cedex 5, France
Contact : bft@cirad.fr - ISSN : L-0006-579X
https://doi.org/10.5849/forsci.13-097
Sun S., Cao Q. V., Cao T., 2019. Characterizing diameter dis-
tributions for uneven-aged pine-oak mixed forests in the
Qinling Mountains of China. Forests, 10 (7): 596. https://
doi.org/10.3390/f10070596
Temesgen H., Zhang C. H., Zhao X. H., 2014. Modelling tree
height-diameter relationships in multi-species and mul-
ti-layered forests: A large observational study from Nor-
theast China. Forest Ecology and Management, 316: 78-89.
https://doi.org/10.1016/j.foreco.2013.07.035
Turner I. M., 2001. The Ecology of Trees in the Tropical Rain
Forest. In: The Ecology of Trees. Cambridge Tropical Biology
Series, Cambridge University Press, 298 p. https://doi.
org/10.1017/cbo9780511542206
Vanha-Majamaa I., Jalonen J., 2001. Green tree reten-
tion in Fennoscandian forestry. Scandinavian Jour-
nal of Forest Research, 16 (1): 79-90. https://doi.
org/10.1080/028275801300004433You can also read