Linkage mapping identifies a non synonymous mutation - in FLOWERING LOCUS T (FT B1) - Nature
←
→
Page content transcription
If your browser does not render page correctly, please read the page content below
www.nature.com/scientificreports
OPEN Linkage mapping identifies
a non‑synonymous mutation
in FLOWERING LOCUS T (FT‑B1)
increasing spikelet number
per spike
1* 1,3
Jonathan Brassac , Quddoos H. Muqaddasi , Jörg Plieske2, Martin W. Ganal2 &
Marion S. Röder 1
Total spikelet number per spike (TSN) is a major component of spike architecture in wheat (Triticum
aestivum L.). A major and consistent quantitative trait locus (QTL) was discovered for TSN in a
doubled haploid spring wheat population grown in the field over 4 years. The QTL on chromosome 7B
explained up to 20.5% of phenotypic variance. In its physical interval (7B: 6.37–21.67 Mb), the gene
FLOWERING LOCUS T (FT-B1) emerged as candidate for the observed effect. In one of the parental
lines, FT-B1 carried a non-synonymous substitution on position 19 of the coding sequence. This
mutation modifying an aspartic acid (D) into a histidine (H) occurred in a highly conserved position.
The mutation was observed with a frequency of ca. 68% in a set of 135 hexaploid wheat varieties
and landraces, while it was not found in other plant species. FT-B1 only showed a minor effect on
heading and flowering time (FT) which were dominated by a major QTL on chromosome 5A caused by
segregation of the vernalization gene VRN-A1. Individuals carrying the FT-B1 allele with amino acid
histidine had, on average, a higher number of spikelets (15.1) than individuals with the aspartic acid
allele (14.3) independent of their VRN-A1 allele. We show that the effect of TSN is not mainly related
to flowering time; however, the duration of pre-anthesis phases may play a major role.
In light of a growing world population, the increase of wheat yield and the genetic mechanisms behind are of
immediate interest. It was shown that grain yield in German winter wheat cultivars was highly correlated with
grain number per s pike1 and, therefore, the genes and mechanisms determining inflorescence and spike architec-
ture in cereals have been in the focus of research (reviewed in Gauley and Boden2; Koppolu and Schnurbusch3).
The unbranched spike of wheat contains one spikelet per node and is terminated with a single terminal spikelet
at the apical end of the inflorescence. Each spikelet contains 8–12 florets and produces usually 3–5 grains per
spikelet1. Important determinants of grain number are the floret f ertility4 as well as spike fruiting efficiency
(grains per unit spike dry weight at anthesis)5,6. Among the complex network of spike-related traits, total spikelet
number per spike (TSN) was studied in several reports. In genetic approaches, TSN appears usually as a quanti-
escribed7–9. A few genes influencing TSN are known;
tative trait and several quantitative trait loci (QTL) were d
among them are (1) the Q gene involved in wheat domestication10,11, (2) a putative ortholog to rice MOC112, and
(3) a wheat ortholog (TaAPO-A1 or WAPO-A1) to rice ABERRANT PANICLE ORGANIZATION (APO1)13–15.
Besides the modulation of spikelet meristem identity genes, the genetic regulation of spikelet initiation
through timing and florigenic signals plays a major role in the determination of TSN. Homologs of Arabidopsis
FLOWERING LOCUS T (FT)16–18, such as HEADING DATE 3a (Hd3a) and RICE FLOWERING LOCUS T 1
(RFT1) in rice promote transition to flowering and t illering19–21. In wheat, the FT-B1 gene on chromosome 7B
was originally reported as VRN-B3 that affects the vernalization requirement in wheat and—besides the three
VRN-1 genes—that determines the spring or winter growth type of hexaploid wheat22,23. In wheat FT-B1 acts
downstream of PHOTOPERIOD-1 (PPD-1) gene to influence spikelet number, with loss of FT-B1 resulting in
1
Leibniz Institute of Plant Genetics and Crop Plant Research (IPK), Corrensstr 3, 06466 Stadt Seeland OT
Gatersleben, Germany. 2TraitGenetics GmbH, Am Schwabeplan 1b, 06466 Stadt Seeland OT Gatersleben,
Germany. 3Present address: European Wheat Breeding Center, BASF Agricultural Solutions GmbH, Am
Schwabeplan 8, 06466 Stadt Seeland OT Gatersleben, Germany. *email: brassac@ipk‑gatersleben.de
Scientific Reports | (2021) 11:1585 | https://doi.org/10.1038/s41598-020-80473-0 1
Vol.:(0123456789)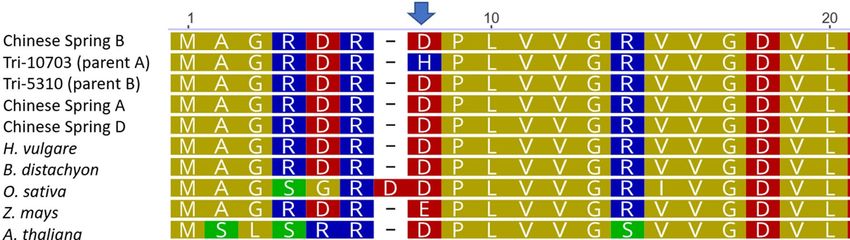
www.nature.com/scientificreports/
Figure 1. Phenotypic distribution of the best linear unbiased estimations (BLUEs) of the investigated traits.
Arrows indicate the phenotypes of the parental lines with parent A corresponding to TRI-10703 and parent B to
TRI-5310.
increased spikelet number in a thermally responsive m anner2,24,25. An ortholog of the maize domestication gene
TEOSINTE BRANCHED 1 (TB1) was reported to interact with FT-B1 in a dosage-dependent manner to promote
the formation of paired spikelets in wheat by activating a cascade of floral meristem identity g enes26.
FT-B1 is a member of an evolutionarily well-conserved gene family [phosphatidylethanolamine-binding
protein (PEBP)] that is present in all taxa including bacteria, animals, and p lants27. Among angiosperms, three
subfamilies are described FT-like, MFT-like (MOTHER OF FT AND TFL), and TFL1-like genes (TERMINAL
FLOWER1)17. Phylogenetic analyses identified MFT—the only member of the PEBP family in mosses—as the
ancestral gene, and its duplication in FT/TFL1-like genes and their divergence coincided with the evolution of
vascular plants28,29. Although sharing a high homology, the genes have been described to be partially redundant as
flowering promoters (FT and MFT) or to act in an antagonist manner (TFL1)17,30. Compared to the two other gene
families, FT-like genes, evolving via small- and large-scale duplications, are the most numerous among monocots
with 13 paralogs identified in rice, five in barley, and nine in wheat based on expressed sequences tags (ESTs)
data31,32. Due to their impact on the phenology and flowering architecture of crops, FT-like genes have been a
target of selection during domestication and subsequent range expansion to adapt to new e nvironments33,34.
In this study, we performed linkage mapping to investigate the genetic basis of total spikelet number per
spike and its associated traits viz., spike length, heading date, and flowering time in a doubled haploid spring
wheat population. Our analyses identified a large-effect locus that harbored FT-B1—a candidate gene for TSN.
The origin and frequency of a non-synonymous mutation associated with an increased spikelet number was
investigated by analyzing a large diversity of land plants and a panel of hexaploid wheat varieties. Moreover, we
also investigated the interaction of FT-B1 with the vernalization gene VRN-A1 that segregated in the studied
population.
Results
Description of phenotypic data. The doubled haploid (DH) population-2 described in Muqaddasi et al.35
was grown on the field and characterized for 4 years (2016–2019) for total spikelet number (TSN) per spike,
spike length (SL), heading date (HD), and flowering time (FT). The best linear unbiased estimations (BLUEs)
showed a wide variation within and across years for all traits, with TSN and SL being normally distributed (Sha-
piro–Wilk test: P = 0.82 for TSN, P = 0.06 for SL, P = 0.001 for HD, and P = 0.003 for FT). Although the parental
lines did not differ much for their flowering traits (HD and FT), the population presented a bimodal distribution
(Fig. 1) resulting from the segregation of the vernalization genes VRN-A1 and VRN-B135. The parental line TRI-
10703 carried the dominant allele Vrn-A1a and the recessive allele vrn-B1, while TRI-5310 harbored the reces-
sive allele vrn-A1 and the dominant allele Vrn-B1. For the spike morphology traits (TSN and SL), the parental
genotype TRI-10703 (parent-A) systematically performed better than parental genotype TRI-5310 (parent-B;
Fig. 1, Supplementary Figure S1). The ANOVA indicated significant (P < 0.001) genotypic and environmental
differences for all traits. High repeatability values (H2 = 0.89–0.96) were obtained for biological replicates of TSN
Scientific Reports | (2021) 11:1585 | https://doi.org/10.1038/s41598-020-80473-0 2
Vol:.(1234567890)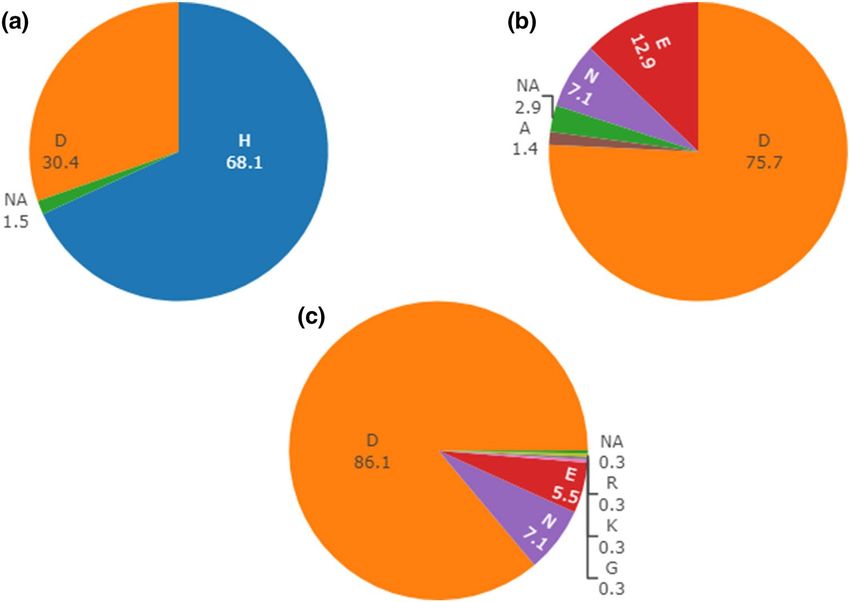
www.nature.com/scientificreports/

                                   Trait   Parameter   2016      2017     2018     2019     BLUEs
                                           Minimum     8.10      13.40    12.80    12.10    12.25
                                           Mean        12.85     16.16    14.99    14.90    14.70
                                           Maximum     17.50     19.20    17.80    18.10    17.57
                                   TSN     σ2G         1.99      1.36     1.00     1.50     0.84
                                           σ2GxE       –         –        –        –        0.60
                                           σ2e         2.07      1.02     0.96     1.34     1.77
                                           H2          0.91      0.93     0.91     0.92     0.81
                                           Minimum     5.00      8.05     7.55     7.50     7.90
                                           Mean        8.30      10.70    9.11     9.78     9.44
                                           Maximum     10.90     14.00    12.15    12.40    12.18
                                   SL      σ2G         0.86      1.39     0.66     0.74     0.37
                                           σ2GxE       –         –        –        –        0.47
                                           σ2e         0.99      0.74     0.35     0.84     1.17
                                           H2          0.90      0.95     0.95     0.90     0.71
                                           Minimum     153       148      144      149      148.93
                                           Mean        157.04    151.30   151.56   150.91   152.80
                                           Maximum     165       159      168      156      159.60
                                   HD      σ2G         –         –        –        –        6.10
                                           σ2GxE       –         –        –        –        –
                                           σ2e         –         –        –        –        3.28
                                           H2          –         –        –        –        0.88
                                           Minimum     157       152      150      154      153.75
                                           Mean        160.99    157.51   155.91   156.28   157.69
                                           Maximum     171       163      170      160      163.5
                                   FT      σ2G         –         –        –        –        5.01
                                           σ2GxE       –         –        –        –        –
                                           σ2e         –         –        –        –        2.79
                                           H2          –         –        –        –        0.88

                                  Table 1.  Summary statistics for total spikelet number (TSN), spike length (SL), heading date (HD), and
                                  flowering time (FT) across 4 years and their corresponding best linear unbiased estimations (BLUEs). σ2G
                                  genotypic variance, σ2GxE genotype-by-environment variance, σ2e residual variance, H2 repeatability among
                                  replicates (single years) or broad-sense heritability (BLUEs).

                                  and SL. Broad sense heritability values calculated over 4 years ranged between 0.71 for SL and 0.88 for FT and
                                  HD (Table 1). The Pearson correlation coefficient calculated based on BLUEs indicated a positive and significant
                                  (P < 0.001) correlation of TSN with SL, HD and FT, and between HD and FT, while the correlation between SL
                                  and the flowering traits was null (Fig. 2).

                                  Mapping of quantitative trait loci (QTL).               Composite interval mapping identified a total of 56 individual
                                  QTL at 28 loci for all years, all traits and their resulting BLUEs (Table 2, Supplementary Table S1). However, only
                                  a single major QTL per trait was found consistent, i.e., present in all the years and their corresponding BLUEs, on
                                  chromosome 5A for FT and HD and on chromosome 7B for TSN (Fig. 3, Table 2). No consistent QTL were iden-
                                  tified for SL. The FT (QFt.ipk-5A) and HD (QHd.ipk-5A) QTL collocated at 145.01–171.23 cM and explained
                                  29.7–66.4% and 23–63.6% of phenotypic variance, respectively. These QTL most probably correspond to the
                                  vernalization gene VRN-A1 (TraesCS5A02G391700). For QTsn.ipk-7B—located at 0–33.46 cM—the phenotypic
                                  variance amounted to 13.1–20.5%. Interestingly, minor QTL for the three other traits (viz., QHd.ipk-7B, QFt.ipk-
                                  7B.1, QFt.ipk-7B.2, and QSl.ipk-7B.1) were identified within or overlapping the QTsn.ipk-7B interval.

                                  Identification of candidate gene FT‑B1 in the physical region. The mapping onto the IWGSC Ref-
                                  Seq v1.1 of the most significant markers defining the QTsn.ipk-7B interval identified for the BLUEs resulted
                                  in a physical interval spanning from 6.37 to 21.67 Mb. The region harbored 121 high-confidence genes (Sup-
                                  plementary Table S2). Potential candidates included two genes annotated as CLAVATA3/ESR (CLE)-related
                                  protein, six annotated as MADS box transcription factors, and the FLOWERING LOCUS T (VRN-B3 or FT-B1,
                                  TraesCS7B02G013100) located at 9.7 Mb (9,702,354–9,704,354 bp). Among the 121 high-confidence genes, 26
                                  harbored a total of 56 non-synonymous mutations between both parental lines. All non-synonymous mutations
                                  were analyzed with PROVEAN to evaluate their potential effect on the proteins. This analysis identified eight
                                  potentially deleterious mutations distributed among six genes including FT-B1 (Supplementary Table S3). This
                                  gene—an ortholog of Arabidopsis FT and rice RFT1—has three predicted exons encoding a phosphatidylethan-
                                  olamine-binding protein (PEBP). FT-B1 had a single non-synonymous substitution close to the start codon. At

Scientific Reports |   (2021) 11:1585 |                    https://doi.org/10.1038/s41598-020-80473-0                                                 3

                                                                                                                                                 Vol.:(0123456789)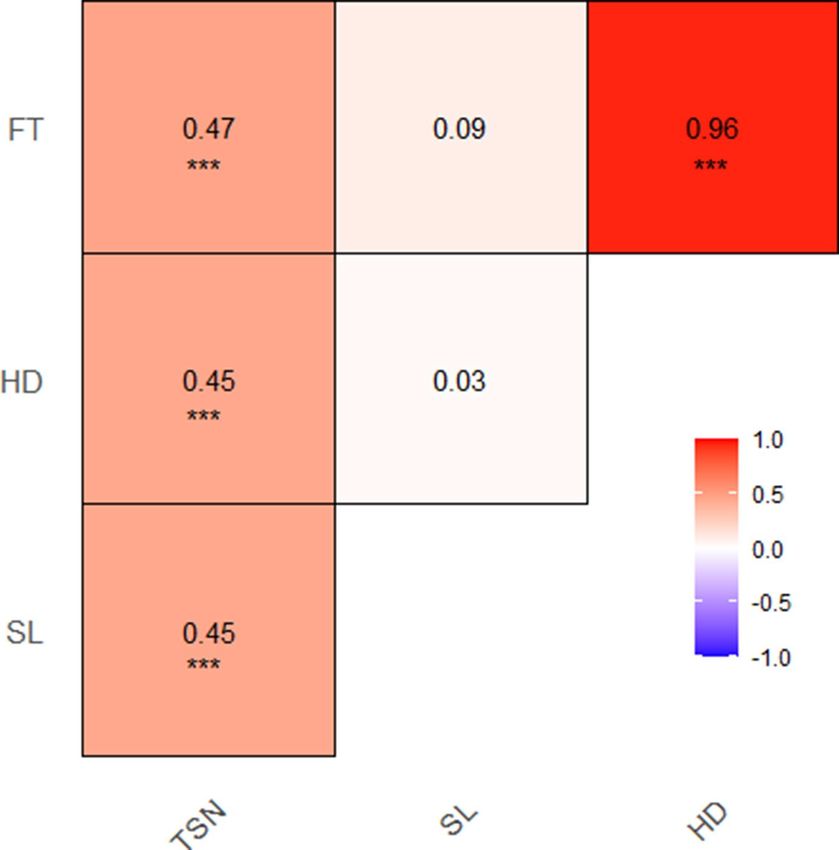
www.nature.com/scientificreports/
Figure 2. Pearson’s correlation coefficient of the best linear unbiased estimations (BLUEs) of total spikelet
number (TSN), spike length (SL), heading date (HD), and flowering time (FT). Significance of the correlations is
indicated with ***P < 0.001.
position 19 in the coding sequence, the parental genotype TRI-5310 (parent-B) and the reference Chinese Spring
have a G, while TRI-10703 (parent-A) has a C. This mutation modifying an aspartic acid (D) into a histidine (H),
although located outside of predicted domains, occurred in a highly conserved position. The 1.5 kb upstream
region of FT-B1 was also searched for transcription factors using the bread wheat epigenomic map (http://bioin
fo.sibs.ac.cn/cs_epigenome)36. The region harbored potential binding sites for RAP211, ERF2 and RAMOSA1,
however, none were polymorphic between both parents.
Development of a KASP marker significantly associated with TSN. To confirm FT-B1 as a can-
didate gene for TSN, a KASP marker was developed for the described mutation in FT-B1 and genotyping was
performed across the whole DH-population. The marker was included in the original matrix for a second round
of composite interval mapping for TSN. The KASP marker was the most significant marker for QTsn.ipk-7B in
the BLUEs and all years but 2017 and explained 10.6–22.9% of phenotypic variance (Supplementary Figure S2,
Supplementary Table S4).
Interaction between VRN‑A1 and FT‑B1 on phenotypic expression of traits. The genotyping for
VRN-A1 was done according to Zhang et al.23 and alleles were coded according to the rest of the data with TRI-
10703 as parent A and TRI-5310 as parent B. A two-way factorial ANOVA for the effects of VRN-A1 and FT-B1
on all traits revealed a highly significant effect of FT-B1 but not VRN-A1 on TSN, while both genes were found
significant for the three other traits (Table 3, Supplementary Table S5). The interaction of both genes was not
significant. Indeed, individuals carrying the FT-B1 A allele with amino acid histidine had on average a higher
number of spikelets (15.1) than individuals with the B allele (14.3) independent of their VRN-A1 allele (Fig. 4).
Individuals carrying the dominant Vrn-A1a allele (A) flowered on average 3 days earlier than individuals with
the recessive vrn-A1 allele (B), while the difference in flowering time caused by the respective FT-B1 allele was
only 1 day. However, this difference was only significant for individuals carrying the dominant Vrn-A1a allele
(Wilcoxon test, P = 0.002). For SL, individuals with the recessive vrn-A1 allele (B), the spike was on average
0.48 cm (Wilcoxon test, P = 0.005) shorter than for the Vrn-A1a allele (A).
Scientific Reports | (2021) 11:1585 | https://doi.org/10.1038/s41598-020-80473-0 4
Vol:.(1234567890)www.nature.com/scientificreports/
QTL Environment LOD score LOD interval (cM) R2 (%) Additive effect
QTsn.ipk-1A BLUEs 3.36 5.19–23.32 7 − 0.27
QTsn.ipk-2B.1 2016/BLUEs 4.2–5.84 111.32–131.49 10.2–12.8 − 0.5 to − 0.39
QTsn.ipk-2B.2 2019 5.28 141.81–148.22 13.2 − 0.49
QTsn.ipk-5A.1 2016/2017 3.36–3.6 43.2–99.98 8.2–9.1 − 0.38 to 0.47
QTsn.ipk-5A.2 2016/2019 4.51–5.61 145.01–177.1 11–14.2 − 0.56 to − 0.54
QTsn.ipk-5B 2019 4.98 88.84–101.21 12.4 0.51
QTsn.ipk-7A 2018 3.43 34.57–54.46 8.6 0.31
QTsn.ipk-7B ALL 4.87–7.59 0–33.46 13.1–20.5 0.44 to 0.59
QSl.ipk-4B 2016/2018/BLUEs 3.2–4.96 62.01–82.01 7.4–11.6 0.20 to 0.29
QSl.ipk-4D 2018 4.85 0–13.66 12 0.29
QSl.ipk-5A.1 2016 3.76 0–4.45 10 0.32
QSl.ipk-5A.2 2018 5.34 106.39–118.65 12.7 0.3
QSl.ipk-5B.1 2016 4.26 113.75–129.91 11.7 − 0.37
QSl.ipk-5B.2 2019 3.74 88.84–111.19 7.8 0.27
QSl.ipk-7A 2018/2019/BLUEs 3.34–6.02 54.46–75.24 9.9–16.3 0.24 to 0.40
QSl.ipk-7B.1 2016/2017/BLUEs 4.2–4.67 0–13.31 11.1–15 0.25 to 0.47
QSl.ipk-7B.2 2019 8.61 37.92–50.71 23.8 0.45
QSl.ipk-7B.3 2019 4.85 127.74–148.26 12.3 − 0.33
QHd.ipk-4A 2016/2017/BLUEs 3.5–5.65 115.64–149.36 5.1–10 0.55 to 0.86
QHd.ipk-5A ALL 7.65–30.18 145.01–171.23 23–63.6 − 4.48 to − 0.83
QHd.ipk-5B.1 2016 3.73 75.44–88.84 4.9 0.56
QHd.ipk-5B.2 2018 6.1 126.06–138.28 6.4 1.53
QHd.ipk-7B 2017/BLUEs 3.22–3.64 13.31–37.92 3.7–9.7 0.50 to 0.87
QFt.ipk-4A 2019/BLUEs 4.72–6.23 115.64–149.36 9.1–12.4 0.45 to 0.73
QFt.ipk-5A ALL 10.22–31.6 145.01–169.33 29.7–66.4 − 4.15 to − 0.80
QFt.ipk-5B 2018 7.16 111.19–116.95 8 1.56
QFt.ipk-7B.1 2016/2017/BLUEs 3.25–5.03 0–13.31 5.2–10.1 0.55 to 0.82
QFt.ipk-7B.2 2018/2019 3.78–5.99 25.36–37.92 6.5–8.4 0.37 to 1.06
Table 2. Summary of quantitative trait loci (QTL) for total spikelet number (TSN), spike length (SL),
heading date (HD), and flowering time (FT) across 4 years and their corresponding best linear unbiased
estimations (BLUEs). Name of the quantitative trait loci (QTL), environment in which the QTL was identified
(Environment), logarithm of odds to declare the presence of a QTL (LOD score), genetic support interval
at LOD-1.5 (LOD interval), percentage of phenotypic variance explained by the QTL (R2), estimated effect
of putative QTL with positive values for TRI-10703 (parent A) and negative values for TRI-5310 (parent B;
additive effect). The full table with description of each individual QTL is available as Supplementary Table S1
online.
Analysis of frequency of the observed mutation in FT‑B1. In the wheat reference genome, a total
of 67 genes, including genes annotated as MFT-like and TFL1-like, were classified as FT-B1 paralogs in the
EnsemblPlants database with 27 identified in the B genome, whereas, 20 in each of the A- and D-genomes.
Among those 70 PEBP genes, including FT-B1 and its homoeologues on chromosomes 7A and 7D (TraesC-
S7A02G115400 and TraesCS7D02G111600), the majority possessed an aspartic acid (D) but none had a histidine
(Fig. 5b). The homoeologues in the parental lines were identical to each other and to the reference (Fig. 6). In a
set of 377 homologs retrieved by PROVEAN from the NCBI database across a large diversity of flowering plants
as well as a few Gymnosperms, 86.4% had a D, 7.1% possessed an asparagine (N), and 5.5% had a glutamic acid
(E). Three sequences had another amino acid but none had an H (Fig. 5c). This mutation obtained a PROVEAN
score of − 4.267 and is therefore considered deleterious. However, in a set of 135 wheat varieties and landraces
genotyped with the high-density array Axiom37, ca. 68% carried the mutation (marker AX-94810990; Fig. 5a)
while none of the bread wheat progenitors (eight T. turgidum and one Aegilops speltoides accession) included in
this genotyping effort had it.
Discussion
FLOWERING LOCUS T is a likely candidate for a major TSN‑QTL. A consistent major QTL for TSN
was discovered over 4 years in the field-grown doubled haploid population TRI-10703 × TRI-5310 on chromo-
some 7BS explaining up to 20.5% of phenotypic variance. The FLOWERING LOCUS T (FT-B1) gene located in
the most significant QTL interval (7B: 6.3–21.7 Mb) was considered as most likely candidate for the observed
effect on TSN, because (1) FT-B1 carried a non-synonymous mutation causing an amino acid exchange in the
parental lines, (2) a QTL analysis including the KASP marker based on the mutation confirmed its significant
association with TSN, and (3) FT-B1 was previously associated with effects on spikelet number in the literature.
Scientific Reports | (2021) 11:1585 | https://doi.org/10.1038/s41598-020-80473-0 5
Vol.:(0123456789)www.nature.com/scientificreports/
Figure 3. Quantitative trait loci (QTL) map of total spikelet number (TSN), spike length (SL), heading date
(HD), and flowering time (FT) in a DH-population of spring wheat grown over 4 years and their corresponding
best linear unbiased estimations (BLUEs). The horizontal dashed lines indicate the corresponding logarithm of
odds (LOD) threshold estimated at α = 0.05 with 1000 permutations to assess the QTL significance.
FT-B1 VRN-A1 FT-B1:VRN-A1
TSN *** NS NS
SL ** ** NS
HD *** *** NS
FT *** *** NS
Table 3. P values from two-way ANOVAs for the effects of FT-B1 and VRN-A1 and their interaction
(FT-B1:VRN-A1) on total spikelet number (TSN), spike length (SL), heading date (HD), and flowering
time (FT) based on their best linear unbiased estimations (BLUEs). The full ANOVA results are available as
Supplementary Table S5 online. *P < 0.05; **P < 0.01; ***P < 0.001; NS, P > 0.05.
Scientific Reports | (2021) 11:1585 | https://doi.org/10.1038/s41598-020-80473-0 6
Vol:.(1234567890)www.nature.com/scientificreports/
Figure 4. Allele-wise phenotypic distribution of the KASP marker designed for FT-B1 of the best linear
unbiased estimations (BLUEs) for the investigated traits in dominant (A) or recessive (B) VRN-A1 background.
Significance of the mean differences of the marker alleles obtained from a Wilcoxon rank-sum test.
Moreover, the analysis of all non-synonymous mutations within the QTL interval confirmed FT-B1 as a likely
candidate. Overexpression of FT-B1 did not have an effect on spikelet number but accelerated flowering time
in warm conditions while deletion of FT-B1 nearly doubled the flowering time and increased spike length and
spikelet number24,25. According to Boden et al.38 the expression of FT-B1 is regulated by the pseudo-response
regulator gene Ppd-1 and a reduced expression of FT-B1 was associated with paired spikelet formation and
inflorescence architecture.
FT-B1 is usually associated with flowering time or heading date. Higher FT-B1 transcripts levels controlled
by the insertion of a retrotransposon in the promoter region (“Hope” allele) accelerated flowering time and
transgenic winter wheat transformed with the Hope promoter behaved like spring types. The retrotransposon
characteristic of the highly expressed FT-B1 allele from variety “Hope”22,39 was not present in our parental lines.
Changes in the expression of the wild type FT-B1 were shown to coincide with major transition of the inflores-
cence meristem2.
Different effects of FT‑B1 and VRN‑A1 on flowering time and total spikelet number. Our pop-
ulation is segregating for the vernalization genes VRN-A1 and VRN-B1, as well as for the photoperiodism gene
Ppd-D1. The heading and flowering time were in all years governed by a major QTL on chromosome 5A which
represented the effect of VRN-A1, while on chromosome 7B representing FT-B1 only minor QTL were observed
for HD and FT (Table 2, Supplementary Table S1). VRN-A1 had highly significant effects on HD, FT and SL but
not on TSN. On the other hand, FT-B1 was highly significant for TSN and showed small effects on the other
three traits (Fig. 4, Table 3). In the correlations, increased TSN was correlated with increased SL as well as with
delayed HD and FT. However, FT-B1 affected spikelet formation without a major effect on the flowering time.
It may, therefore, be concluded that the FT-B1 effects on pre-flowering phases play a major role. The effects of
sub-phases in plant growth of wheat on yield and yield components were highlighted by Guo et al.40,41, where
spikelet initiation and spikelet number was associated with double ridge to terminal spikelet stage. Dixon et al.24
reported that flowering time, in contrast to spikelet number, was not responsive to changes in ambient tempera-
ture in a ft-b1 NIL, suggesting that the promotion of inflorescence development between the double ridge and
terminal spikelet stages is regulated by FT-independent thermally responsive factors. In contrast to Arabidopsis,
where FT induces flowering at elevated growth temperature42, the accelerated development pace of domesticated
wheat under high temperature is largely independent of FT24,43. Li et al.44 investigated the interactions between
the three wheat MADS-box genes VRN1, FUL2 and FUL3 and showed delayed formation of the terminal spikelet
and increased number of spikelets per spike in VRN1-null and ful2-null mutants. Flowering delays in VRN1-null
Scientific Reports | (2021) 11:1585 | https://doi.org/10.1038/s41598-020-80473-0 7
Vol.:(0123456789)www.nature.com/scientificreports/
Figure 5. Intraspecific, intragenomic and interspecific diversity for the FT-B1 mutation. All values are
percentages. (a) Allele frequency across 135 wheat varieties sequenced with the Axiom marker AX-94810990 of
the nucleotide substitution, with C translating to histidine (H) and G translating to aspartic acid (D). (b) Allele
frequency for the corresponding amino acid position across 70 PEBP genes annotated in the wheat reference
genome. (c) Allele frequency for the corresponding amino acid position across 377 homologs retrieved from the
PROVEAN analysis across a large diversity of plants.
Figure 6. Sequence alignment of the 20 first amino acids of a subset of FT-B1 homologs including the
homoeologues on chromosome 7A and 7D. The wheat reference sequence (Chinese Spring), the sequences of
the two parental lines, and FT-B1 homologs in diverse species viz. Hordeum vulgare, Brachypodium distachyon,
Oryza sativa, Zea mays, and Arabidopsis thaliana. The blue arrow indicates the position of the aspartic acid (D)
to histidine (H) mutation present in the parent A and associated with elevated total spikelet number. The amino
acids are color coded according to their side chain polarity with nonpolar (gold), polar (green), basic polar
(blue), and acidic polar (red).
mutants were associated with reduced FT1 transcript levels in leaves. Also changes in expression level of FLOW-
ERING LOCUS T2 (FT2), the closest paralog of the FT1 gene in temperate grasses, were associated with changes
in spikelet number, flowering time and fertility45,46. Another QTL-study reported three pleiotropic QTL regions
associated with spikelet number and heading date on chromosomes 2A, 7A and 7D, with FT-A1 considered as
candidate gene for QTspn/Hd.cau-7A9.
A non‑synonymous mutation in exon1 of FT‑B1 is widespread in the species T. aesti-
vum. Sequencing of the parental lines of the DH-population allowed us to screen for mutations and indels
affecting the genes annotated in the physical interval corresponding to the major QTL. Evaluating all non-
Scientific Reports | (2021) 11:1585 | https://doi.org/10.1038/s41598-020-80473-0 8
Vol:.(1234567890)www.nature.com/scientificreports/
synonymous mutations affecting the 121 high-confidence genes present in the QTL interval, only eight were
considered as potentially deleterious. Among those, we identified a non-synonymous substitution in exon1 of
FT-B1 in our parental lines changing the aspartic acid (D) into a histidine (H). Analyzing a collection of more
than 300 sequences of FT-B1 homologs, including homoeologues and paralogs, covering a large diversity of land
plants revealed that the mutation was novel in hexaploid wheat. However, it appeared that the mutation, present
with the array code AX-94810990 on the high-density genotyping arrays Axiom 820 K and 35 K, is probably
widespread (68%) in wheat varieties and landraces but absent in the few tetraploid and Ae. speltoides accessions
screened to validate the 820 K array37. The mutation from D to H confers a phenotype similar but weaker than
the complete loss of FT-B1 (and 400 other genes) described in Dixon et al.24 and Finnegan et al.25. We conclude
that this could be a mutation potentially only slightly impairing the protein which remains suitable in breeding.
Taken together, our results suggest that this variant is a novelty private to hexaploid wheat where it was favored
potentially for its positive impact on the grain yield. It may also have been selected for winter hardiness as
the histidine mutation was found to be associated with an increased frost tolerance47. Interestingly, analysis of
transgenic rice showed that Hd3a—a rice FT homolog—accumulated in axillary meristems and promoted the
formation of branches21. Analyzing FT-like genes in maize and rice, Zheng et al.34 have shown that those genes
had been under positive selection during domestication allowing the plants to adapt to different environments
during the range expansion of by modulating their flowering time.
Conclusion
Linkage mapping revealed the effects of FT-B1 on total spikelet number in the genetic background of a doubled
haploid spring wheat population, while the heading and flowering time was dominated by the effects of a segre-
gating VRN-A1 gene. A non-synonymous mutation in FT-B1 causing an amino acid exchange from aspartic acid
to histidine was observed in the parental lines of the mapping population. The observed mutation is widespread
in hexaploid wheat, but could not be detected in any other orthologs and paralogs within the higher plants. It
may be speculated that effects of FT-B1 on subphase duration of wheat affect the final spikelet number rather
than the flowering time. This is a first report about a structural variation in FT-B1 influencing TSN, which is also
inheritable, while other reports were mainly based on expression analysis or the complete loss described in Dixon
et al.24 and Finnegan et al.25 consisting of the first 23 Mb of chromosome 7B encompassing more than 400 genes.
Materials and methods
Plant material and field trials. The doubled haploid (DH) spring wheat population-2 consisting of 159
lines was previously described in Muqaddasi et al.35. The parental lines, conserved at the IPK Genebank, were
TRI-10703 (landrace from Greece) and TRI-5310 (variety Eureke from France). The accessions were originally
selected for their contrasting anther extrusion phenotypes but exhibited a large difference for total spikelet num-
ber per spike (TSN). The DH population and its parental lines were sown at the end of March and grown in 2 m 2
plots on the field in IPK Gatersleben for four consecutive cropping seasons (2016–2019) and characterized each
year for TSN, spike length (SL), heading date (HD), and flowering time (FT).
Phenotyping and data analysis. The spike traits (TSN and SL) were recorded from ten spikes per plot as
the total number of spikelets and spike length in centimeters (cm) from basal spikelet to the top of a spike but
excluding the awns. The flowering traits (HD and FT) were recorded for each year as the number of days between
the first of January and when approximately half of the spikes in a plot emerged and flowered, respectively.
Phenotypic data were analyzed following Muqaddasi et al.35. Specifically, best linear unbiased estimations
(BLUEs) were calculated per year for the spike traits and across years for all traits by assuming fixed effects for
the intercept and the genotype and all others as random. All phenotyping data analyses, including ANOVAs,
Pearson’s correlation coefficient analyses, repeatability among replicates, broad-sense-heritability across years,
and statistical tests, were performed using the software R48.
Genotyping and QTL mapping. The 159 lines were genotyped with a custom-designed 15 k Infinium
a rray49 by the company TraitGenetics GmbH in Gatersleben, Germany, that resulted in 3,457 polymorphic mark-
ers. The 15 k Infinium array was created as a cost-effective option based on the 90 k Infinium array described
by Wang et al.50. Data filtering and linkage map construction were previously described in Muqaddasi et al.35.
The quantitative trait loci (QTL) underlying the four traits were analyzed by composite interval mapping
(CIM)51 in Windows QTL Cartographer 2.552. For each trait, single year and across year BLUEs were used to
calculate both forward and backward regression. The step size was set at 2 cM. To identify significant QTL at
α = 0.05, thresholds for the logarithm of odds (LOD) values were estimated with 1000 permutation53. Confidence
interval for the significant QTL were defined as a continuous genomic region comprised within a 1.5-LOD from
the marker with the highest LOD per chromosome passing the threshold54. QTL repeatedly identified in the
same interval each year and in their BLUEs were defined as major and consistent.
Analysis of the physical region. All genomic analyses were performed in Geneious Prime 2020.0.5
(https://www.geneious.com). First the sequences of the markers corresponding to the consistent QTL’s genetic
intervals were obtained from Wang et al.50 and BLASTed on their assigned chromosome of the wheat genome
reference sequence55 to define genomic intervals. The physical interval defined for QTsn.ipk-7B was retrieved
from the assemblies of the parental lines sequenced at 10 × coverage with Illumina paired-end sequencing (Hise-
qXTEN PE150) and assembled as described in Muqaddasi et al.35. The sequences of the genes present in the
interval were mapped to the sequences of the parental lines and then extracted. Mapping was performed with
the Geneious mapper set to “Custom sensitivity” based on the “Medium–Low Sensitivity” parameters but with a
Scientific Reports | (2021) 11:1585 | https://doi.org/10.1038/s41598-020-80473-0 9
Vol.:(0123456789)www.nature.com/scientificreports/
maximum gap size of 2000 bp to accommodate for missing data regions. Multiple sequence alignments (MSA)
for each gene consisting of the sequences of the reference and of the two parental lines were obtained by run-
ning the same mapping procedure using the genic sequences of Chinese Spring as reference. Polymorphisms
between both parental lines were annotated in the MSAs. To narrow down to potential candidates, the func-
tional annotations of the genes in the interval were inspected which revealed the presence of two CLAVATA3/
ESR (CLE)-related proteins, six MADS box transcription factors, and the FLOWERING LOCUS T (VRN-B3 or
FT-B1, TraesCS7B02G013100). The potential effect of the non-synonymous substitutions affecting FT-B1 and all
other high-confidence genes present within the interval were analyzed with PROVEAN (Protein variation effect
analyzer)56. The bread wheat epigenomic map (http://bioinfo.sibs.ac.cn/cs_epigenome)36 was used to identify
the location of potential transcription factors in the 1.5 kb region upstream from FT-B1.
Interaction between FT‑B1 and VRN‑A1. To test the potential interaction between the candidate gene
FT-B1 and the vernalization gene VRN-A1, the whole population was genotyped with a Kompetitive Allele
Specific PCR (KASP) marker based on the FT-B1 SNP (Supplementary Table S6) and VRN-A1 primers23. All the
traits were analyzed with a two-way factorial ANOVA and allele-wise phenotypic distribution was illustrated by
plotting the boxplots. The effect of the different alleles at both loci for all traits were evaluated with a Wilcoxon
rank-sum test.
Intragenomic, intra‑ and interspecific analyses. The EnsemblPlant database (https://plants.ensem
bl.org) was used to identify and recover the protein sequences of all genes classified as paralogs of the three
homoeologues (TraesCS7A02G115400, TraesCS7B02G013100, and TraesCS7D02G111600). The sequences were
then aligned with MAFFT v7.45057,58 in Geneious. The CerealsDB database (www.cerealsdb.uk.net)59 and the
function “Extract genotype for a specific SNP” were used to obtain the genotyping score of the Axiom 820 K
array marker AX-94810990 covering the non-synonymous mutation identified in FT-B1. Samples with the
ancestral (G) or the derived allele (C) were scored with BB and AA, respectively. Among the 475 genotypes
recovered, only the samples identified as varieties, landraces, tetraploid and Aegilops speltoides, according to
Winfield et al.37, were kept to evaluate the frequency of the mutation across bread wheat and its progenitors.
Interspecific analyses were performed on the set of 377 homolog sequences retrieved by the PROVEAN analysis.
Received: 5 October 2020; Accepted: 17 December 2020
References
1. Sakuma, S. & Schnurbusch, T. Of floral fortune: Tinkering with the grain yield potential of cereal crops. New Phytol. 225, 1873–1882
(2020).
2. Gauley, A. & Boden, S. A. Genetic pathways controlling inflorescence architecture and development in wheat and barley. J. Integr.
Plant Biol. 61, 296–309 (2019).
3. Koppolu, R. & Schnurbusch, T. Developmental pathways for shaping spike inflorescence architecture in barley and wheat. J. Integr.
Plant Biol. 61, 278–295 (2019).
4. Guo, Z. et al. Genome-wide association analyses of 54 traits identified multiple loci for the determination of floret fertility in wheat.
New Phytol. 214, 257–270 (2017).
5. Pretini, N. et al. A comprehensive study of spike fruiting efficiency in wheat. Crop Sci. 60, 1541–1555 (2020).
6. Pretini, N. et al. Identification and validation of QTL for spike fertile floret and fruiting efficiencies in hexaploid wheat (Triti-
cum aestivum L.). Theor. Appl. Genet. 133, 2655–2671 (2020).
7. Liu, J. et al. A genome-wide association study of wheat spike related traits in China. Front. Plant Sci. 9, 1584. https: //doi.org/10.3389/
fpls.2018.01584(2018).
8. Würschum, T., Leiser, W. L., Langer, S. M., Tucker, M. R. & Longin, C. F. H. Phenotypic and genetic analysis of spike and kernel
characteristics in wheat reveals long-term genetic trends of grain yield components. Theor. Appl. Genet. 131, 2071–2084 (2018).
9. Chen, Z. et al. Pleiotropic QTL influencing spikelet number and heading date in common wheat (Triticum aestivum L.). Theor.
Appl. Genet. 133, 1825–1838 (2020).
10. Debernardi, J. M., Lin, H., Chuck, G., Faris, J. D. & Dubcovsky, J. microRNA172 plays a crucial role in wheat spike morphogenesis
and grain threshability. Development 144, 1966–1975 (2017).
11. Greenwood, J. R., Finnegan, E. J., Watanabe, N., Trevaskis, B. & Swain, S. M. New alleles of the wheat domestication gene Q reveal
multiple roles in growth and reproductive development. Development 144, 1959–1965 (2017).
12. Zhang, B. et al. Novel function of a putative MOC1 ortholog associated with spikelet number per spike in common wheat. Sci.
Rep. 5, 12211. https://doi.org/10.1038/srep12211 (2015).
13. Kuzay, S. et al. Identification of a candidate gene for a QTL for spikelet number per spike on wheat chromosome arm 7AL by
high-resolution genetic mapping. Theor. Appl. Genet. 132, 2689–2705 (2019).
14. Muqaddasi, Q. H. et al. TaAPO-A1, an ortholog of rice ABERRANT PANICLE ORGANIZATION 1, is associated with total spike-
let number per spike in elite European hexaploid winter wheat (Triticum aestivum L.) varieties. Sci. Rep. 9, 13853. https://doi.
org/10.1038/s41598-019-50331-9 (2019).
15. Voss-Fels, K. P. et al. High-resolution mapping of rachis nodes per rachis, a critical determinant of grain yield components in
wheat. Theor. Appl. Genet. 132, 2707–2719 (2019).
16. Kardailsky, I. et al. Activation tagging of the floral inducer FT. Science 286, 1962–1965 (1999).
17. Kobayashi, Y., Kaya, H., Goto, K., Iwabuchi, M. & Araki, T. A pair of related genes with antagonistic roles in mediating flowering
signals. Science 286, 1960–1962 (1999).
18. Corbesier, L. et al. FT protein movement contributes to long-distance signaling in floral induction of Arabidopsis. Science 316,
1030–1033 (2007).
19. Kojima, S. et al. Hd3a, a rice ortholog of the Arabidopsis FT gene, promotes transition to flowering downstream of Hd1 under
short-day conditions. Plant Cell. Physiol. 43, 1096–1105 (2002).
Scientific Reports | (2021) 11:1585 | https://doi.org/10.1038/s41598-020-80473-0 10
Vol:.(1234567890)www.nature.com/scientificreports/
20. Komiya, R., Ikegami, A., Tamaki, S., Yokoi, S. & Shimamoto, K. Hd3a and RFT1 are essential for flowering in rice. Development
135, 767–774 (2008).
21. Tsuji, H. et al. Hd3a promotes lateral branching in rice. Plant J. 82, 256–266 (2015).
22. Yan, L. et al. The wheat and barley vernalization gene VRN3 is an orthologue of FT. Proc. Natl. Acad. Sci. USA 103, 19581–19586
(2006).
23. Zhang, X. K. et al. Allelic variation at the vernalization genes Vrn-A1, Vrn-B1, Vrn-D1, and Vrn-B3 in Chinese wheat cultivars and
their association with growth habit. Crop Sci. 48, 458–470 (2008).
24. Dixon, L. E. et al. Developmental responses of bread wheat to changes in ambient temperature following deletion of a locus that
includes FLOWERING LOCUS T1. Plant Cell Environ. 41, 1715–1725 (2018).
25. Finnegan, E. J. et al. Zebularine treatment is associated with deletion of FT-B1 leading to an increase in spikelet number in bread
wheat. Plant Cell Environ. 41, 1346–1360 (2018).
26. Dixon, L. E. et al. TEOSINTE BRANCHED 1 regulates inflorescence architecture and development in bread wheat (Triticum aes-
tivum). Plant Cell 30, 563–581 (2018).
27. Karlgren, A. et al. Evolution of the PEBP gene family in plants: Functional diversification in seed plant evolution. Plant Physiol.
156, 1967–1977 (2011).
28. Hedman, H., Källman, T. & Lagercrantz, U. Early evolution of the MFT-like gene family in plants. Plant Mol. Biol. 70, 359–369
(2009).
29. Jin, S., Nasim, Z., Susila, H. & Ahn, J. H. Evolution and functional diversification of FLOWERING LOCUS T/TERMINAL FLOWER 1
family genes in plants. Semin. Cell Dev. Biol. https://doi.org/10.1016/j.semcdb.2020.05.007 (2020).
30. Hanzawa, Y., Money, T. & Bradley, D. A single amino acid converts a repressor to an activator of flowering. Proc. Natl. Acad. Sci.
USA 102, 7748–7753 (2005).
31. Chardon, F. & Damerval, C. Phylogenomic analysis of the PEBP gene family in cereals. J. Mol. Evol. 61, 579–590 (2005).
32. Faure, S., Higgins, J., Turner, A. & Laurie, D. A. The FLOWERING LOCUS T-like gene family in barley (Hordeum vulgare). Genetics
176, 599–609 (2007).
33. Izawa, T. Adaptation of flowering-time by natural and artificial selection in Arabidopsis and rice. J. Exp. Bot. 58, 3091–3097 (2007).
34. Zheng, X.-M. et al. Evolution of the PEBP gene family and selective signature on FT-like clade. J. Syst. Evol. 54, 502–510 (2016).
35. Muqaddasi, Q. H., Jayakodi, M., Börner, A. & Röder, M. S. Identification of consistent QTL with large effect on anther extrusion
in doubled haploid populations developed from spring wheat accessions in German Federal ex situ Genebank. Theor. Appl. Genet.
132, 3035–3045 (2019).
36. Li, Z. et al. The bread wheat epigenomic map reveals distinct chromatin architectural and evolutionary features of functional
genetic elements. Genome Biol. 20, 139. https://doi.org/10.1186/s13059-019-1746-8 (2019).
37. Winfield, M. O. et al. High-density SNP genotyping array for hexaploid wheat and its secondary and tertiary gene pool. Plant
Biotechnol. J. 14, 1195–1206 (2016).
38. Boden, S. A. et al. Ppd-1 is a key regulator of inflorescence architecture and paired spikelet development in wheat. Nat. Plants 1,
14016. https://doi.org/10.1038/nplants.2014.16 (2015).
39. Nitcher, R., Pearce, S., Tranquilli, G., Zhang, X. & Dubcovsky, J. Effect of the Hope FT-B1 allele on wheat heading time and yield
components. J. Hered. 105, 666–675 (2014).
40. Guo, Z., Chen, D., Röder, M. S., Ganal, M. W. & Schnurbusch, T. Genetic dissection of pre-anthesis sub-phase durations during
the reproductive spike development of wheat. Plant J. 95, 909–918 (2018).
41. Guo, Z. et al. Genome-wide association analyses of plant growth traits during the stem elongation phase in wheat. Plant Biotechnol.
J. 16, 2042–2052 (2018).
42. Balasubramanian, S., Sureshkumar, S., Lempe, J. & Weigel, D. Potent induction of Arabidopsis thaliana flowering by elevated growth
temperature. PLOS Genet. 2, e106. https://doi.org/10.1371/journal.pgen.0020106 (2006).
43. Hemming, M. N., Walford, S. A., Fieg, S., Dennis, E. S. & Trevaskis, B. Identification of high-temperature-responsive genes in
cereals. Plant Physiol. 158, 1439–1450 (2012).
44. Li, C. et al. Wheat VRN1, FUL2 and FUL3 play critical and redundant roles in spikelet development and spike determinacy.
Development 146, dev175398. https://doi.org/10.1242/dev.175398 (2019).
45. Shaw, L. M. et al. FLOWERING LOCUS T 2 regulates spike development and fertility in temperate cereals. J. Exp. Bot. 70, 193–204
(2019).
46. Gauley, A. & Boden, S. A. Step-wise increases in FT1 expression regulate seasonal progression of flowering in wheat (Triticum aes-
tivum). New Phytol. https://doi.org/10.1111/nph.16910 (2020).
47. Babben, S. et al. Association genetics studies on frost tolerance in wheat (Triticum aestivum L.) reveal new highly conserved amino
acid substitutions in CBF-A3, CBF-A15, VRN3 and PPD1 genes. BMC Genom. 19, 409. https: //doi.org/10.1186/s12864 -018-4795-6
(2018).
48. R Core Team. R: A Language and Environment for Statistical Computing. R Foundation for Statistical Computing, Vienna, Austria
(2020). https://www.R-project.org/.
49. Soleimani, B. et al. Comparison between core set selection methods using different Illumina marker platforms: A case study of
assessment of diversity in wheat. Front. Plant Sci. 11, 1040. https://doi.org/10.3389/fpls.2020.01040 (2020).
50. Wang, S. et al. Characterization of polyploid wheat genomic diversity using a high-density 90,000 single nucleotide polymorphism
array. Plant Biotechnol. J. 12, 787–796 (2014).
51. Zeng, Z. B. Precision mapping of quantitative trait loci. Genetics 136, 1457–1468 (1994).
52. Wang, S., Basten, C. J. & Zeng, Z. B. Windows QTL Cartographer 2.5_011 (North Carolina State University, Raleigh, 2012).
53. Churchill, G. A. & Doerge, R. W. Empirical threshold values for quantitative trait mapping. Genetics 138, 963–971 (1994).
54. Silva, L. D. C. E., Wang, S. & Zeng, Z.-B. Composite interval mapping and multiple interval mapping: Procedures and guidelines
for using Windows QTL cartographer. In Quantitative Trait Loci (QTL): Methods and Protocols (ed. Rifkin, S. A.) 75–119 (Humana
Press, Totowa, 2012).
55. International Wheat Genome Consortium et al. Shifting the limits in wheat research and breeding using a fully annotated reference
genome. Science 361, eaar7191. https://doi.org/10.1126/science.aar7191 (2018).
56. Choi, Y. & Chan, A. P. PROVEAN web server: A tool to predict the functional effect of amino acid substitutions and indels. Bio-
informatics 31, 2745–2747 (2015).
57. Katoh, K., Misawa, K., Kuma, K. & Miyata, T. MAFFT: A novel method for rapid multiple sequence alignment based on fast Fourier
transform. Nucl. Acids Res. 30, 3059–3066 (2002).
58. Katoh, K. & Standley, D. M. MAFFT multiple sequence alignment software version 7: Improvements in performance and usability.
Mol. Biol. Evol. 30, 772–780 (2013).
59. Wilkinson, P. A. et al. CerealsDB 2.0: An integrated resource for plant breeders and scientists. BMC Bioinform. 13, 219. https://
doi.org/10.1186/1471-2105-13-219 (2012).
Scientific Reports | (2021) 11:1585 | https://doi.org/10.1038/s41598-020-80473-0 11
Vol.:(0123456789)www.nature.com/scientificreports/
Acknowledgements
This study was funded by internal sources of IPK. We are grateful to Ellen Weiß, Anette Heber, Ute Ostermann,
and Sonja Allner for help in data collection. We thank Guy Golan for discussion and comments on the manu-
script. We are grateful to the three anonymous reviewers for their critical comments and suggestions.
Author contributions
M.S.R. and Q.H.M. conceived, designed, and performed the experiments. J.P. and M.W.G. performed genotyping.
J.B. and Q.H.M. analyzed the data. J.B. and M.S.R. contributed to the interpretation of the results and wrote the
manuscript. All authors reviewed the manuscript.
Funding
Open Access funding enabled and organized by Projekt DEAL.
Competing interests
On behalf of all authors, Jonathan Brassac states that there is no conflict of interest. J.P. and M.W.G. are members
of the company TraitGenetics GmbH. This does, however, in no way limit the availability or sharing of data and
materials.
Additional information
Supplementary Information The online version contains supplementary material available at https://doi.
org/10.1038/s41598-020-80473-0.
Correspondence and requests for materials should be addressed to J.B.
Reprints and permissions information is available at www.nature.com/reprints.
Publisher’s note Springer Nature remains neutral with regard to jurisdictional claims in published maps and
institutional affiliations.
Open Access This article is licensed under a Creative Commons Attribution 4.0 International
License, which permits use, sharing, adaptation, distribution and reproduction in any medium or
format, as long as you give appropriate credit to the original author(s) and the source, provide a link to the
Creative Commons licence, and indicate if changes were made. The images or other third party material in this
article are included in the article’s Creative Commons licence, unless indicated otherwise in a credit line to the
material. If material is not included in the article’s Creative Commons licence and your intended use is not
permitted by statutory regulation or exceeds the permitted use, you will need to obtain permission directly from
the copyright holder. To view a copy of this licence, visit http://creativecommons.org/licenses/by/4.0/.
© The Author(s) 2021
Scientific Reports | (2021) 11:1585 | https://doi.org/10.1038/s41598-020-80473-0 12
Vol:.(1234567890)You can also read