Maintaining higher leaf photosynthesis after heading stage could promote biomass accumulation in rice - Nature
←
→
Page content transcription
If your browser does not render page correctly, please read the page content below
www.nature.com/scientificreports
OPEN Maintaining higher leaf
photosynthesis after heading
stage could promote biomass
accumulation in rice
Sotaro Honda1,4, Satoshi Ohkubo1,4, Nan Su San1, Anothai Nakkasame1, Kazuki Tomisawa1,
Keisuke Katsura1, Taiichiro Ookawa1, Atsushi J. Nagano2 & Shunsuke Adachi1,3*
Leaf photosynthetic rate changes across the growing season as crop plants age. Most studies of
leaf photosynthesis focus on a specific growth stage, leaving the question of which pattern of
photosynthetic dynamics maximizes crop productivity unanswered. Here we obtained high-frequency
data of canopy leaf CO2 assimilation rate (A) of two elite rice (Oryza sativa) cultivars and 76 inbred lines
across the whole growing season. The integrated A value after heading was positively associated with
crop growth rate (CGR) from heading to harvest, but that before heading was not. A curve-smoothing
analysis of A after heading showed that accumulated A at > 80% of its maximum (A80) was positively
correlated with CGR in analyses of all lines mixed and of lines grouped by genetic background, while
the maximum A and accumulated A at ≤ 80% were less strongly correlated with CGR. We also found
a genomic region (~ 12.2 Mb) that may enhance both A80 and aboveground biomass at harvest. We
propose that maintaining a high A after heading, rather than having high maximum A, is a potential
target for enhancing rice biomass accumulation.
Abbreviations
A Net CO2 assimilation rate per leaf area
A80 Accumulated A at > 80% of Amax
Aall Accumulated A during Phase II
Adec Accumulated A at ≤ 80% of Amax
AGB I Aboveground biomass at first sampling
AGBII Aboveground biomass at second sampling
Aint Integrated A
Aint Phase I Integrated A during Phase I
Aint Phase II Integrated A during Phase II
Amax Maximum fitted value of A during Phase II
CGR Crop growth rate
CGRPhase I CGR during Phase I
CGRPhase II CGR during Phase II
CSSL Chromosome segment substitution line
DAT Days after transplanting
Donset 1 Day before A declined below 80% of Amax
DTH Days to heading
Koshihikari lines Koshihikari-background CSSLs and Koshihikari
LA Leaf area
LAmean Phase I Mean single LA during Phase I
LAmean Phase II Mean single LA during Phase II
SPAD80 Mean SPAD value before Donset
1
Graduate School of Agriculture, Tokyo University of Agriculture and Technology, 3‑5‑8 Saiwaicho, Fuchu,
Tokyo 183‑8509, Japan. 2Faculty of Agriculture, Ryukoku University, Yokotani 1‑5, Seta Oe‑cho, Otsu,
Shiga 520‑2194, Japan. 3College of Agriculture, Ibaraki University, 3‑21‑1 Chuo, Ami, Inashiki, Ibaraki 300‑0393,
Japan. 4These authors contributed equally: Sotaro Honda and Satoshi Ohkubo. *email: shunsuke.adachi.0210@
vc.ibaraki.ac.jp
Scientific Reports | (2021) 11:7579 | https://doi.org/10.1038/s41598-021-86983-9 1
Vol.:(0123456789)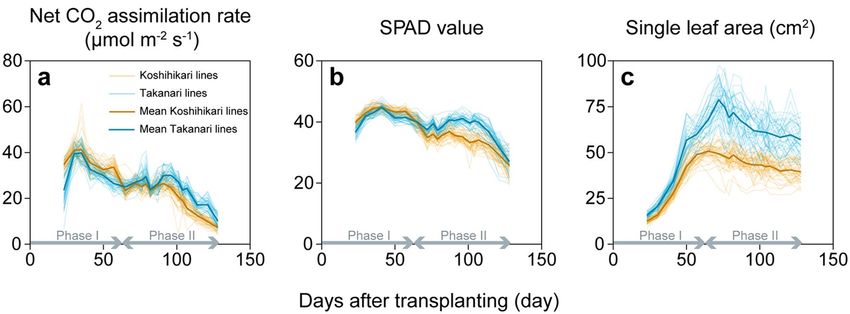
www.nature.com/scientificreports/
SPADdec Mean SPAD value after Donset
Takanari lines Takanari-background CSSLs and Takanari
Rice (Oryza sativa) is one of the most important cereal crops worldwide. To meet the increasing demand for
grain as the world’s population increases, rice productivity must be increased by ~ 50% relative to the current
level by 20501,2. The rice yield increases during the “green revolution” depended largely on the development of
semi-dwarf cultivars with greater harvest index and on greatly increased N fertilizer application3,4. This strategy
is reaching its limits, however, because harvest index is reaching its theoretical maximum and excess application
of N fertilizer causes environmental pollution5–7. Further enhancement of grain yield must be achieved through
increases of total biomass accumulation via improved radiation use efficiency without increased nutrient inputs8.
Single-leaf photosynthesis has long been considered a target trait for increasing radiation use efficiency6,9,10.
Recent studies have shown the importance of enhancing single-leaf photosynthesis and crop productivity in the
field11; for example, the promoted recovery from photoprotection increased biomass production in tobacco (Nico-
tiana tabacum)12, and overproduction of ribulose-1,5-bisphosphate carboxylase/oxygenase (Rubisco) increased
grain yield in r ice13.
Using natural genetic resources could be a useful approach for improving p hotosynthesis14–16. Wide intraspe-
cific variation in net C O2 assimilation rate per leaf area (A) has been found in several crop species, includ-
ing rice17–19 and wheat (Triticum aestivum)20,21. The underlying genetic variations can be used in quantitative
genetic analyses to identify genomic regions relating to leaf photosynthesis, facilitating DNA marker-assisted
selection14,16. An important question in such an approach is whether the enhanced A effectively increases total
biomass production and grain yield22. Positive close correlations of A with plant (or crop) growth rate, bio-
mass production, and final yield through large-scale surveys of diverse sets of accessions have been reported in
rice19,23,24, wheat25,26 and soybean (Glycine max)27. Simulation analyses showed that a 25% increase in single-leaf
photosynthesis based on rice genetic resources could enhance biomass production by 22–29%28. Furthermore,
newer rice cultivars developed in Japan with high yield capacity have higher A than older cultivars, especially
after heading29,30. These studies underpin the potential for enhanced productivity by improved photosynthesis
achieved through the use of natural genetic resources.
In contrast, there are many conflicting results on the photosynthesis–productivity relationship. Poor cor-
relations between A and biomass accumulation have been reported in r ice18,31, wheat21 and maize (Zea mays)32.
For example, Jahn et al. found a significant negative correlation between A and dry biomass among 20 diverse
rice varieties18. Our previous research also showed that a near isogenic rice line with enhanced A significantly
reduced the grain yield than its parental cultivars33. Many agronomists have been questioned the effects of the
genetic improvement of single-leaf photosynthesis for better crop y ields34,35. In fact, crop breeding has often
selected increased leaf area production at the expense of photosynthetic capacity, as occurred in wheat36. The
inconsistencies between studies could reduce the potential value of natural genetic resources for improving leaf
photosynthesis and delay the enhancement of crop productivity.
The value of A changes across the growing season owing to the progression of plant age and leaf
senescence37–39. However, most studies of the photosynthesis–productivity relationship selected only one or
two growth stages for evaluation of p hotosynthesis18,19,26,30. Such a “snapshot” analysis can reveal only limited
aspects of crop production and potentially cause inconsistent results. The need for comprehensive evaluation
is supported by the fact that the total C O2 uptake per tobacco plant, calculated from multiple measurements
of leaves at several positions throughout the day and the growing season, agreed well with actual dry weight
increase40. Therefore, multiple photosynthetic measurements are necessary when we examine natural genetic
resources across their growing season.
Conventional open gas exchange systems require several to tens of minutes to acclimatize a leaf to the leaf
chamber, limiting the number of samples to be e xamined41. To overcome this limitation, we recently created a
new closed gas exchange system (MIC-100; Masa International Corporation, Kyoto, Japan), which takes 15–20 s
per measurement, ~ 90% less than conventional open gas exchange systems. We hypothesize that with the new
measurement system, tracing photosynthetic dynamics of multiple rice accessions across their growing season
will tell us which photosynthetic dynamics can maximize productivity and which developmental stage should
be targeted in breeding for photosynthesis.
In previous studies, our research group determined that the indica cultivar Takanari, which has one of the
highest grain yields among Japanese rice cultivars, accumulated more biomass than Nipponbare and Koshihi-
kari, standard japonica cultivars42,43. Since then, Takanari has been widely used to analyse the physiological and
molecular mechanisms of biomass accumulation44–50 and their effects on grain yield51–54. Although the higher
biomass accumulation in Takanari is characterized by a higher net assimilation rate around the full heading stage,
which could be partly explained by the higher leaf photosynthetic capacity, only rough analysis of gas exchange
during growth has been c onducted43. Here, we aimed at collecting the data on temporal changes in canopy
photosynthesis of Koshihikari and Takanari over the entire growing season by using the MIC-100 to analyse its
association with crop growth rate (CGR) and total biomass accumulation. We assumed that photosynthesis in
the uppermost fully expanded leaf is representative of canopy photosynthesis, since it has the highest photosyn-
thetic capacity and receives the strongest radiation in the c anopy43,46,55. We also observed ontogenic changes of
chlorophyll content (SPAD value) and single leaf area (single LA). To analyse the phenotypic variation caused
by introgressions between the cultivars, we used reciprocal sets of chromosome segment substitution lines
(reciprocal CSSLs) derived from a Koshihikari/Takanari cross52,56. Each CSSL carries a single genomic segment
from the donor cultivar (either Koshihikari or Takanari) in the genetic background of the other cultivar, and the
full set of substituted segments covers the entire g enome52,57. The variation in flowering date is much smaller in
CSSLs than in other populations such as recombinant inbred lines, which is advantageous in examining whether
Scientific Reports | (2021) 11:7579 | https://doi.org/10.1038/s41598-021-86983-9 2
Vol:.(1234567890)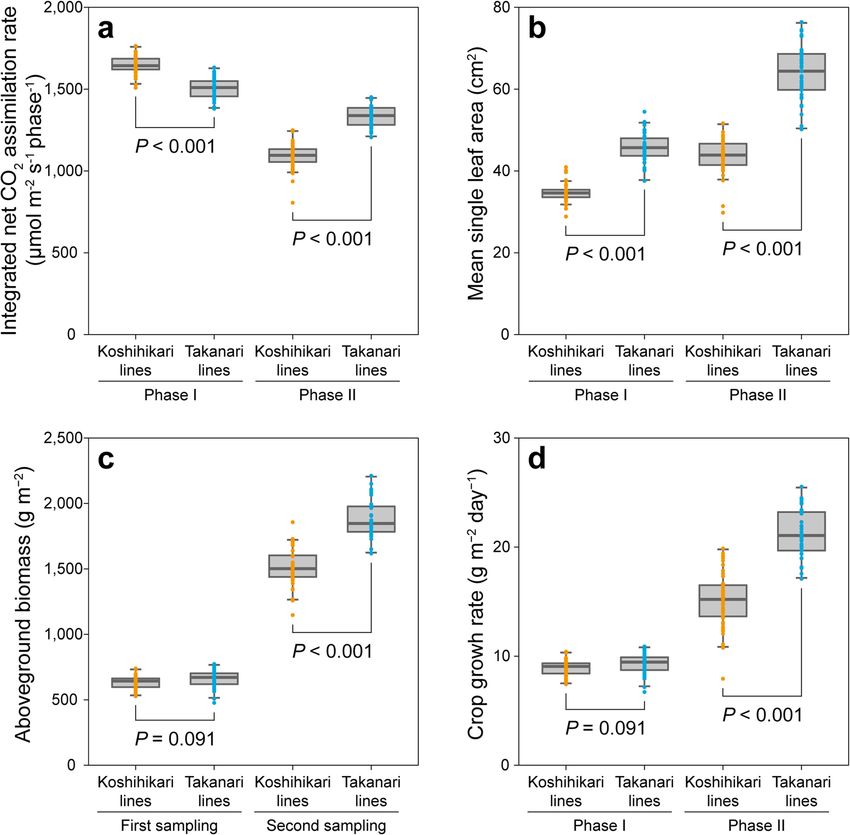
www.nature.com/scientificreports/
Figure 1. Dynamics of (a) net CO2 assimilation rate, (b) SPAD value and (c) single leaf area across the entire
growing season. Koshihikari lines, Koshihikari-background CSSLs and Koshihikari; Takanari lines, Takanari-
background CSSLs and Takanari (n = 3). Mean phenotypic values are also shown. Phase I, transplanting to
first biomass sampling (71 days after transplanting, DAT); Phase II, first biomass sampling to second biomass
sampling (129 DAT).
changes in photosynthesis affect biomass accumulation. From this study, we propose that maintaining a high
rate of photosynthesis after heading, rather than having a high maximum photosynthetic rate, can increase total
biomass accumulation.
Results
Ontogenic changes in photosynthesis and biomass accumulation. We divided the growth period
into Phase I—from transplanting to the first biomass sampling (at heading)—and Phase II—from the first sam-
pling to the second sampling (at harvest) (Fig. 1). (See days to heading [DTH] data of all rice lines in Supplemen-
tary Dataset S1.) As a general trend, A reached the maximum at around 30–35 days after transplanting (DAT)
and then gradually decreased over time (Fig. 1a). During Phase I, A values of Takanari-background CSSLs and
Takanari (Takanari lines) were lower by 10% in average than those of Koshihikari-background CSSLs and Koshi-
hikari (Koshihikari lines). During Phase II, A values of Takanari lines remained higher than those of Koshihikari
lines (Fig. 1a). SPAD values showed a similar trend (Fig. 1b). Single LA gradually increased with crop growth
and reached a maximum at around 65 DAT in Koshihikari lines and 72 DAT in Takanari lines (Fig. 1c). Single
LA of Takanari lines was larger than that of Koshihikari lines during Phase I, and larger still during Phase II
(Fig. 1c).
Integrated A (Aint), the apparent total CO2 uptake calculated by sum of trapezoidal area under each pair of
adjacent measurements, was 10% lower in Takanari lines than in Koshihikari lines during Phase I, but was 23%
higher during Phase II (P < 0.001; Fig. 2a). Mean single LA was significantly higher in Takanari lines than in
Koshihikari lines during Phase I, and even higher during Phase II (P < 0.001; Fig. 2b). There was no significant
difference in aboveground biomass at the first sampling ( AGB I) or in CGR during Phase I (CGR Phase I) between
Koshihikari lines and Takanari lines, while AGB at the second sampling (AGB II) and CGR during Phase II
(CGR Phase II) were significantly higher in Takanari lines than in Koshihikari lines, by 25% and 40%, respectively
(P < 0.001; Fig. 2c,d). The standard deviation (SD) in each background was larger during Phase II than during
Phase I (for instance, for CGR in Koshihikari lines: 0.72 during Phase I but 2.51 during Phase II; Supplementary
Table S1). These results indicate that the genetic differences between Koshihikari and Takanari and between
lines of each genetic background were more notable during Phase II than during Phase I. The AGB II was closely
correlated with CGR Phase II (r = 0.97), not with CGR Phase I (r = 0.34; Supplementary Fig. S4). CGR Phase I was not
correlated with Aint during Phase I (Aint Phase I) (r = − 0.10) and was only slightly correlated with mean single
LA during Phase I ( LAmean Phase I) (r = 0.28), while CGR Phase II was strongly correlated with these values (r = 0.75
for Aint during Phase II [Aint Phase II], r = 0.82 for mean single LA during Phase II [ LAmean Phase II]; Supplementary
Fig. S4). These results indicate that AGB II depends largely on CGR Phase II, which in turn is correlated closely with
photosynthesis and single LA during Phase II.
Curve‑smoothing analysis during Phase II and associations of parameters with crop growth
rate. For detailed analysis of photosynthetic dynamics during Phase II, we applied curve-smoothing analysis
to the A and SPAD values (Fig. 3a,d). Both curves were upward-convex, peaking several days after beginning of
Phase II, and decreased over time. The total area under the curve (Aall) and the maximum A (Amax) were higher
in Takanari than in Koshihikari, by around 26% each (Fig. 3b,c). When Aall was divided into accumulated A
at > 80% of Amax (A80) and accumulated A at ≤ 80% of Amax (Adec) at Donset (1 day before A declined below 80% of
Amax), Takanari had a higher A80 than Koshihikari but a similar Adec (Fig. 3b,c). Takanari also had higher values
of SPAD80 and S PADdec (the mean SPAD values of the two phases divided at Donset) than Koshihikari (Fig. 3e,f).
The values of all CSSLs are shown in the Supplementary Dataset S1.
Scientific Reports | (2021) 11:7579 | https://doi.org/10.1038/s41598-021-86983-9 3
Vol.:(0123456789)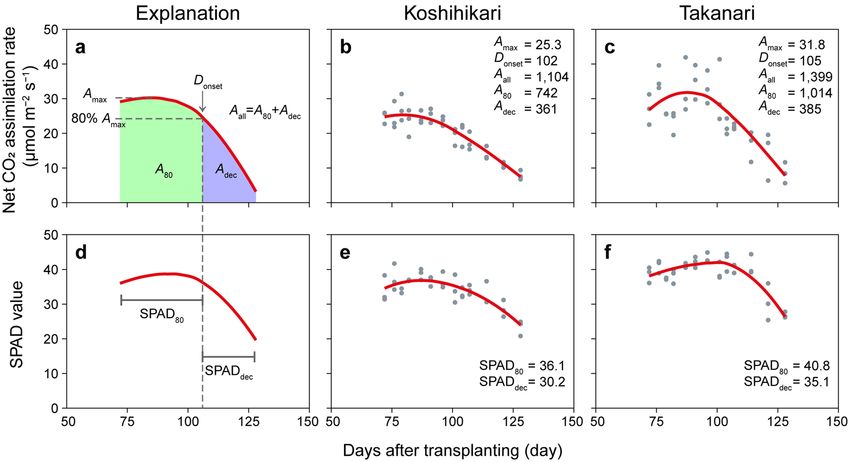
www.nature.com/scientificreports/
Figure 2. Comparisons of phenotypes between Koshihikari lines and Takanari lines. (a) Integrated net CO2
assimilation rate, (b) mean single leaf area, (c) dry weight of aboveground biomass, (d) crop growth rate.
Abbreviations as in Fig. 1. Boxplots: central line, median; boxes, interquartile range (IQR); whiskers, 1.5 × IQR;
points, actual data.
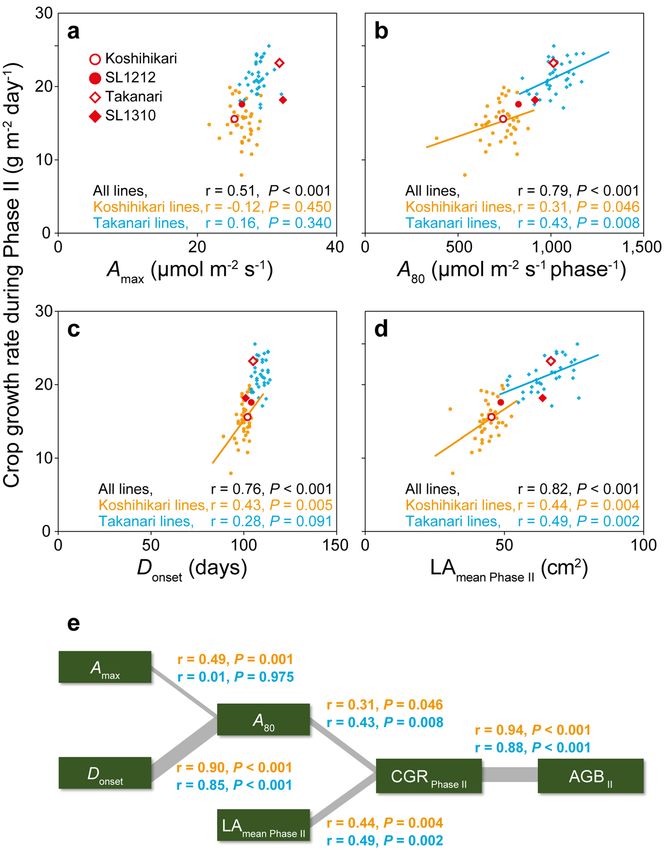
The correlations between biomass accumulation and photosynthetic parameters after heading showed that
CGR Phase II was closely correlated with Aall (Fig. 4). In turn, Aall was closely correlated with Amax, A80 and Donset,
and was moderately negatively correlated with Adec. These results suggest that Aall is determined mainly by A80,
the magnitude of which can be explained by both Amax and Donset. CGR Phase II was positively correlated with DTH
and LAmean Phase II, indicating that a later heading date and a larger single LA could enhance biomass accumulation.
SPAD80 was positively correlated with A80, but SPADdec was not correlated with Adec.
Analysis by genetic background. The results of the above analyses should be affected considerably by the
genetic background, because the Takanari lines had consistently higher values of most parameters after head-
ing. So we conducted separate analyses by genetic background. AGB II was closely correlated with CGR Phase II in
each background (r = 0.94 for Koshihikari lines, r = 0.88 for Takanari lines; Supplementary Fig. S5). CGR Phase II
was not correlated with Amax in either background (r = − 0.12 for Koshihikari lines, r = 0.16 for Takanari lines),
but it was significantly correlated with A80 (r = 0.31 for Koshihikari lines; r = 0.43 for Takanari lines) and with
Donset (r = 0.43 for Koshihikari lines; Supplementary Fig. S5, Fig. 5a–c). The association between CGR Phase II and
Donset in Takanari lines was close to significant (r = 0.28, P = 0.091; Supplementary Fig. S5b, Fig. 5c). These results
indicate that maintaining a high rate of photosynthesis for longer, rather than having a higher Amax, was related
to higher biomass accumulation during Phase II in each background. We also found a significant relationship
between CGR Phase II and LAmean Phase II in each background (r = 0.44 for Koshihikari lines, r = 0.49 for Takanari
lines; Supplementary Fig. S5, Fig. 5d). The factors affecting total biomass accumulation are presented in Fig. 5e.
Scientific Reports | (2021) 11:7579 | https://doi.org/10.1038/s41598-021-86983-9 4
Vol:.(1234567890)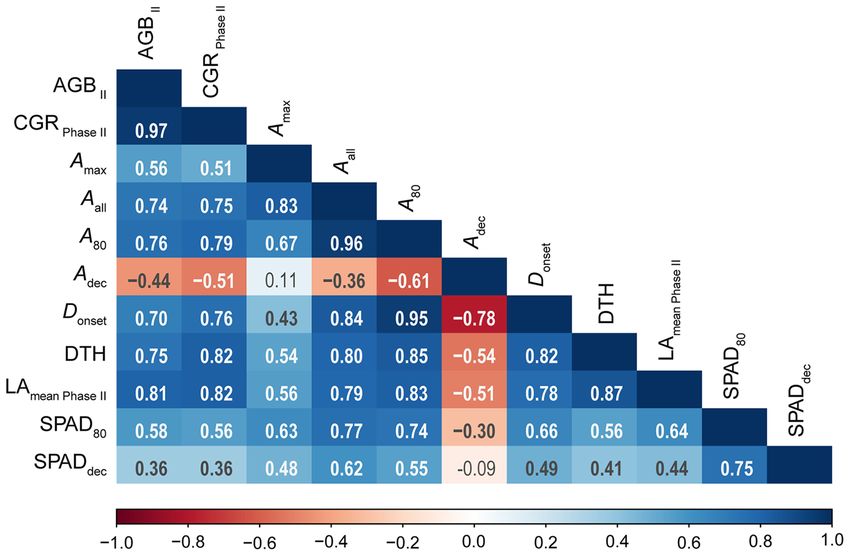
www.nature.com/scientificreports/
Figure 3. Curve-smoothing analysis for net C O2 assimilation rates (A) and SPAD values during Phase II. (a)
A curve. Amax, maximum fitted value of A; Donset, 1 day before A declined below 80% of Amax; Aall, accumulated
A during Phase II; A80, accumulated A from 72 DAT to Donset; Adec, accumulated A from Donset to 128 DAT.
(b,c) Curve-smoothing analysis of A for (b) Koshihikari and (c) Takanari. Grey points, actual data; red lines,
smoothed curves. (d) SPAD curve. S PAD80, mean SPAD value before Donset; SPADdec, mean SPAD value after
Donset. (e,f) Curve-smoothing analysis of SPAD for (e) Koshihikari and (f) Takanari.
Figure 4. Pearson’s correlation coefficients of pairs of traits (biomass accumulation, C O2 assimilation and other
agronomic traits) during Phase II among all lines examined. Values in bold type are significant (P < 0.05, two-
sided t-test). Blue, positive correlation; red, negative correlation. AGB II, dry weight of aboveground biomass
harvested at 128 DAT; CGR Phase II, crop growth rate during Phase II; DTH, days to heading; L Amean Phase II, mean
value of single leaf area during Phase II. Other abbreviations as in Fig. 3.
Scientific Reports | (2021) 11:7579 | https://doi.org/10.1038/s41598-021-86983-9 5
Vol.:(0123456789)www.nature.com/scientificreports/
Figure 5. Relationships between CGR Phase II and (a) Amax, (b) A80, (c) Donset and (d) LAmean Phase II. Orange,
Koshihikari lines; blue, Takanari lines. (e) Schematic model showing the factors affecting biomass accumulation.
Abbreviations as in Figs. 3 and 4.
By multiple linear regression analysis, the combined contribution of A80 and L Amean Phase II to CGR Phase II variation
was 25% for Koshihikari lines and 31% for Takanari lines.
Among the CSSLs, A80 values of SL1212 and SL1310, with a single genomic segment on chromosome 3 from
the introgression parent, were, respectively, 11% higher than that of Koshihikari and 10% lower than that of
Takanari (Supplementary Fig. S6b). S PAD80 was similar between each pair of the parent and the CSSL, suggesting
less difference in biochemical properties (Supplementary Fig. S6c). AGB II and CGR Phase II of SL1212 were 13% and
13%, respectively, higher than those of Koshihikari, and those of SL1310 were 14% and 28% lower than those of
Takanari (Supplementary Fig. S6d,e). These results suggest that genes on the genomic region of chromosome 3
Scientific Reports | (2021) 11:7579 | https://doi.org/10.1038/s41598-021-86983-9 6
Vol:.(1234567890)www.nature.com/scientificreports/
(17.0–29.2 Mb) regulate both photosynthesis and total biomass accumulation. We also found some yield-related
genes included in this genomic region (Supplementary Table S2; Supplementary Dataset S2)58.
Discussion
Improving leaf photosynthetic capacity has long been considered a promising target to increase biomass pro-
duction and yield in crop species6,9,10. However, poor correlations between leaf photosynthetic rate and biomass
accumulation or yield have been reported, perhaps in part owing to limited d atasets18,21,31,32,59. To understand
the association of photosynthetic rate and biomass accumulation across the entire growing season, we obtained
high-frequency data of A, SPAD and single LA of the canopy leaf and tested correlations with CGR using recip-
rocal CSSLs and their parental cultivars.
During Phase I (transplanting to heading), differences in leaf photosynthesis had little effect on biomass
production. Takanari lines had lower A and SPAD values and larger single LA than Koshihikari lines (Figs. 1, 2).
AGB I and CGR Phase I did not differ between Koshihikari and Takanari lines (Fig. 2), which can be explained by
the offset of the lower A by the larger single LA in Takanari lines. Taylaran et al. likewise showed that Takanari
had a similar plant growth rate to Koshihikari during the vegetative stage owing to its lower net assimilation
rate but the higher mean leaf area per p lant43. We also found a smaller variation in these traits among lines of
each background (41 Koshihikari lines, 37 Takanari lines) during Phase I than during Phase II (Fig. 2; Sup-
plementary Table S1), which suggests that the genomic introgressions between the cultivars have little effect on
phenotypic expression before heading. In contrast, a wide genetic variation in biomass accumulation (227%)
among 204 global mini-core accessions and 11 elite Chinese rice cultivars at the mid-vegetative stage (60 days
after emergence) was r eported19. The authors also showed that A under low light was highly related to biomass
accumulation, suggesting that simultaneous improvements of photosynthetic rate and biomass accumulation
during early growth can be achieved by using a diverse set of germplasms19.
During Phase II (heading to harvest), photosynthetic parameters were closely associated with biomass accu-
mulation. The A value of Takanari lines increased and remained higher than that of Koshihikari lines until the
final examination (Fig. 1a). The positive correlations between photosynthetic parameters (Amax, Aall, A80) and
biomass accumulation parameters (CGR Phase II and AGB II) in the analysis of all datasets combined indicate that
the consistently higher photosynthetic capacity in Takanari lines contributes to the enhanced biomass accu-
mulation compared to Koshihikari lines (Fig. 4). The large difference in A between Koshihikari and Takanari
after heading stage has been repeatedly reported43–45,48. This is explained in part by the enhanced root system
development in Takanari, increasing water and nitrogen u ptake43. Additionally, the steeper nitrogen distribution
to the upper canopy leaf in Takanari can lead to the effective use of s unlight6. In the separate analysis of each
background, CGR Phase II and A80 were significantly correlated in both Koshihikari and Takanari lines (Supple-
mentary Fig. S5). Interestingly, in this analysis, Amax was not correlated with CGR Phase II in either Koshihikari or
Takanari lines (Fig. 5a, Supplementary Fig. S5). In addition, Amax was not correlated with A80 in Takanari lines,
although it was significantly correlated in Koshihikari lines (Supplementary Fig. S5), suggesting that increasing
Amax is not always an efficient strategy for enhancing biomass accumulation. Many physiological and molecular
analyses have focused on the maximum photosynthetic rate of the flag leaf on the assumption that it has the
highest photosynthetic activity in the crop canopy after heading, which would be closely correlated with biomass
accumulation and y ield26,44,56,60,61. However, our results show that maintaining a high rate of photosynthesis after
heading, rather than having a high Amax, is more closely associated with biomass accumulation. We identified
a genomic region that may simultaneously increase (or decrease) A80 and CGR Phase II without increasing Amax
(Fig. 5, Supplementary Fig. S6). We propose that as limited evaluation of photosynthesis could select lines with
poor biomass accumulation, ontogenic changes in photosynthesis after heading should be examined for simul-
taneously enhancing photosynthetic performance and biomass accumulation.
The variation in LAmean Phase II was also associated with the variation in CGR Phase II in both the combined analy-
sis of all lines and the separate analyses of Koshihikari and Takanari lines (Figs. 4, 5d, Supplementary Fig. S5).
This suggests that breeding for the selection of plants with larger flag leaves may enhance the total biomass
accumulation. However, very large leaves and too many tillers could reduce sunlight penetration into the canopy,
thereby increasing canopy respiration rate and decreasing the total biomass accumulation62. This issue may not
be obvious in our results, but it should be considered in different growth environments.
Although we found significant correlations of A80 and LAmean Phase II with CGR Phase II, the combined contribu-
tion of A80 and LAmean Phase II to CGR Phase II variation was only 25–31%. This indicates the presence of other major
determinants behind the variation in CGR. The first possibility is tiller growth: active tillering increases the total
leaf area of a plant, greatly contributing to total biomass accumulation and panicle n umber63. Although we did
not examine tiller numbers here, panicle number varies widely among these C SSLs52. The second possibility is
the photosynthetic capacity and single LA of leaves at lower positions. A recent study showed that the balance of
photosynthetic capacity between the flag leaf and the leaf immediately below it has significant effects on canopy
photosynthesis in w heat64. The third possibility is the degree of light penetration to the bottom of the canopy.
Better light penetration, which is achieved by large leaf inclination angles and decreased chlorophyll content
of the canopy leaves, can maximize canopy p hotosynthesis6,65. Takanari has one of the highest leaf inclination
angles among rice cultivars, which is considered an important determinant of its higher biomass a ccumulation66.
The fourth possibility is adaptation to the environment, especially light and vapour pressure deficit. Sunlight
reaching the leaf surface fluctuates on the order of minutes to seconds owing to cloud, wind and self-shading67.
The time-lag inherent in reaching a new steady-state rate of photosynthesis after a fluctuation would diminish
the total carbon gain68,69. The photosynthetic rate can decrease in the afternoon on sunny days with high vapour
pressure deficit, so-called “midday depression”, largely because of closed stomata and photoinhibition3,70. So we
need a comprehensive simulation model using these complex physiological factors and the association of the
Scientific Reports | (2021) 11:7579 | https://doi.org/10.1038/s41598-021-86983-9 7
Vol.:(0123456789)www.nature.com/scientificreports/
underlying genomic regions to explain the difference in biomass accumulation among lines. Our high-frequency
datasets of photosynthesis may contribute to the development of such a model.
In conclusion, maintaining a higher photosynthetic rate, rather than achieving the maximum rate, after head-
ing was closely associated with biomass accumulation. We identified a genomic region likely to simultaneously
increase A80 and biomass accumulation, although further investigation is necessary. We propose that examina-
tion of the dynamics of photosynthesis throughout the entire growing period is important to the use of natural
genetic resources for breeding selection. In contrast, the limited contribution of A80 to biomass production
suggests essential roles of other physiological factors in biomass variation. A comprehensive model explaining
the role of genetic variation in biomass accumulation by multiple physiological properties and the roles of key
genes is required.
Methods
Plant cultivation. Collection of plant material, must comply with relevant institutional, national, and inter-
national guidelines and legislation. The rice seeds of Koshihikari and Takanari and reciprocal sets of CSSLs
(41 lines in Koshihikari background, 39 lines in Takanari background)52 were obtained from Institute of Crop
Science, National Agriculture and Food Research Organization, Tsukuba, Japan, with a material transfer agree-
ment. Lines SL1208, SL1335 and SL1336 had a dwarf plant structure, probably due to hybrid breakdown asso-
ciated with the interaction of hbd2 and hbd3, and SL1320 did not produce panicles during the experiment,
probably owing to the inserted Hd1 gene52. We excluded these four lines from our analyses. Seeds were sown in
plastic cups filled with artificial soil on 7 May 2019, and the seedlings were grown until the fourth to fifth leaf
stage in the greenhouse. They were transplanted into a paddy field (an alluvial clay loam) of Tokyo University
of Agriculture and Technology (35° 39′ N, 139° 28′ E) on 22 May with a basal dressing of inorganic fertilizer
supplying 30 kg N, 60 kg P, and 60 kg K ha−1. One-third of the total N was applied as ammonium sulphate, and
the other two-thirds as slow-release urea (LP-50 & LPS-100; JCAM Agri Co., Ltd, Tokyo, Japan). No topdressing
was applied. The plant density was 22.2 m−2 (at a spacing of 30 cm × 15 cm) with one plant per hill, and plants
were grown under submerged conditions. Each line was grown in three replicate plots in 2 rows of 20 plants
(60 cm × 300 cm). Plots were randomized, but lines of each background group were planted adjacent (Supple-
mentary Fig. S1).
Phenotypic analysis. The uppermost newly expanded leaf on the main tiller of one plant per plot was
used for phenotypic analyses. The net CO2 assimilation rate was measured with a closed-type portable pho-
tosynthesis system (MIC-100; Masa International Corporation, Kyoto, Japan; https://www.weather.co.jp/catal
og_html/MIC-100.html), which consists of a console and a chamber head with an aperture area of 2 cm × 3 cm
(Supplementary Fig. S2a). A non-dispersive infrared sensor at the bottom of the chamber measures CO2 con-
centration every 0.1 s. To prevent rapid inactivation of the leaf ’s photosynthetic activity, a light-emitting diode
lamp at the chamber top supplies a photosynthetic photon flux density of 1200 μmol photons m−2 s−1. After an
intact leaf is enclosed in the chamber clip, air flow from the atmosphere is blocked off, and the rate of decrease
of CO2 concentration from 400 to 390 ppm is monitored to calculate net CO2 assimilation rate. Each measure-
ment was completed within 20 s. Measurements were taken in sunlight between 08:00 and 13:00 h on dry days
(the solar radiation during measurements was 500–1300 μmol photons m−2 s−1). The SPAD value as a proxy for
leaf chlorophyll content was measured with a chlorophyll meter (SPAD-502; Konica Minolta, Osaka, Japan; Sup-
plementary Fig. S2b). Leaves were sampled and transported to the laboratory without dehydration. The leaves
put in a transparent folder were passed through a commercial document scanner (ScanSnap iX1500; Fujitsu,
Kanagawa, Japan; Supplementary Fig. S2c). The single LA and the partial LA in the MIC-100 chamber were
measured in ImageJ software (National Institutes of Health, Bethesda, MD, USA). The partial LA was used for
the calculation of net C
O2 assimilation rate per leaf area (A, μmol m −2 s−1). Measurements were conducted once
a week from 3 weeks after transplanting (14 June, 23 DAT) to harvest (27 September, 128 DAT), and additional
measurements were also conducted around heading and mid-ripening stage (20 days in total). In total, 246
leaves were measured per day, 4632 leaves during the experiment. Aint was calculated by summing the trapezoi-
dal area under each pair of adjacent measurement cycles. Mean single LA was calculated as the average of linear
interpolated values.
Sampling of aboveground biomass. The aboveground biomass was examined at heading (1 August, 71
DAT; AGB I) and harvest (28 September, 129 DAT; AGB II). Eight plants in each plot were sampled and air-dried
in a greenhouse until weighing. Air-dried samples of parental plants were dried in a ventilated oven to calculate
the water content ratio of the air-dried samples. The biomass accumulation was expressed as dry weight (g) per
m2. CGR from transplanting (considered as 0) to heading (Phase I) and from heading to harvest (Phase II) were
calculated.
Curve smoothing and statistical analysis. All statistical analyses were performed in R v. 4.0.2
software71. The changes in A and SPAD values during Phase II in each rice line were smoothed by the Locally
Weighted Scatterplot Smoother (LOESS) algorithm with the smoothing parameter fixed at 1.072. We defined
Amax (μmol m−2 s−1) as the maximum fitted value of A, and Donset (day) as 1 day before A declined below 80% of
Amax (Fig. 3a). We also defined Aall (μmol m−2 s−1 phase−1) as accumulated A by curve-smoothing during Phase
II (from 72 to 128 DAT), A80 (μmol m −2 s−1 phase−1) as accumulated A from 72 DAT to Donset, and Adec (μmol
m−2 s−1 phase−1) as accumulated A from Donset to 128 DAT (Fig. 3a). We show the changes in correlation coef-
ficients between CGR Phase II and A10 to A90 (accumulated A at > 10% to > 90% of Amax, Supplementary Fig. S7).
SPAD80 is the mean SPAD value from 72 DAT to Donset, and SPADdec is mean SPAD value from Donset to 128 DAT.
Scientific Reports | (2021) 11:7579 | https://doi.org/10.1038/s41598-021-86983-9 8
Vol:.(1234567890)www.nature.com/scientificreports/
Statistical differences were tested by Welch’s two-sided t-test. Pearson’s correlation coefficient was calculated, and
the significance of relationships was tested by two-sided t-tests.
Data availability
All data and plant materials are available from the corresponding author on reasonable request.
Received: 5 December 2020; Accepted: 23 March 2021
References
1. Ray, D. K., Mueller, N. D., West, P. C. & Foley, J. A. Yield trends are insufficient to double global crop production by 2050. PLoS
ONE 8, e66428. https://doi.org/10.1371/journal.pone.0066428 (2013).
2. Long, S. P., Marshall-Colon, A. & Zhu, X.-G. Meeting the global food demand of the future by engineering crop photosynthesis
and yield potential. Cell 161, 56–66 (2015).
3. Peng, S. et al. Grain yield of rice cultivars and lines developed in the Philippines since 1966. Crop Sci. 40, 307–314 (2000).
4. Murchie, E. H., Pinto, M. & Horton, P. Agriculture and the new challenges for photosynthesis research. New Phytol. 181, 532–552
(2009).
5. Mann, C. C. Crop scientists seek a new revolution. Science 283, 310–314 (1999).
6. Long, S. P., Zhu, X.-G., Naidu, S. L. & Ort, D. R. Can improvement in photosynthesis increase crop yields?. Plant Cell Environ. 29,
315–330 (2006).
7. Sage, R. F., Adachi, S. & Hirasawa, T. Improving photosynthesis in rice: From small steps to giant leaps. In Achieving Sustainable
Cultivation of Rice Volume 1: Breeding for Higher Yield and Quality (ed. Sasaki, T.) 99–130 (Burleigh Dodds Science Publishing,
2017).
8. Zhu, X.-G., Long, S. P. & Ort, D. R. Improving photosynthetic efficiency for greater yield. Ann. Rev. Plant Biol. 61, 235–261 (2010).
9. Monteith, J. L. & Moss, C. Climate and the efficiency of crop production in Britain. Philos. Trans. R. Soc. B Biol. Sci. 281, 277–294
(1977).
10. Furbank, R. T., Sharwood, R., Estavillo, G. M., Silva-Perez, V. & Condon, A. G. Photons to food: Genetic improvement of cereal
crop photosynthesis. J. Exp. Bot. 71, 2226–2238 (2020).
11. Simkin, A. J., López-Calcagno, P. E. & Raines, C. A. Feeding the world: Improving photosynthetic efficiency for sustainable crop
production. J. Exp. Bot. 70, 1119–1140 (2019).
12. Kromdijk, J. et al. Improving photosynthesis and crop productivity by accelerating recovery from photoprotection. Science 354,
857–861 (2016).
13. Yoon, D.-K. et al. Transgenic rice overproducing Rubisco exhibits increased yields with improved nitrogen-use efficiency in an
experimental paddy field. Nat. Food 1, 134–139. https://doi.org/10.1038/s43016-020-0033-x (2020).
14. Flood, P. J., Harbinson, J. & Aarts, M. G. M. Natural genetic variation in plant photosynthesis. Trends Plant Sci. 16, 327–335 (2011).
15. Furbank, R. T., Jimenez-Berni, J. A., George-Jaeggli, B., Potgieter, A. B. & Deery, D. M. Field crop phenomics: Enabling breeding
for radiation use efficiency and biomass in cereal crops. New Phytol. 223, 1714–1727 (2019).
16. Adachi, S., Ohkubo, S., San, N. S. & Yamamoto, T. Genetic determination for source capacity to support breeding of high-yielding
rice (Oryza sativa). Mol. Breed. 40, 20. https://doi.org/10.1007/s11032-020-1101-5 (2020).
17. Kanemura, T., Homma, K., Ohsumi, A., Shiraiwa, T. & Horie, T. Evaluation of genotypic variation in leaf photosynthetic rate and
its associated factors by using rice diversity research set of germplasm. Photosynth. Res. 94, 23–30 (2007).
18. Jahn, C. E. et al. Genetic variation in biomass traits among 20 diverse rice varieties. Plant Physiol. 155, 157–168 (2011).
19. Qu, M. et al. Leaf photosynthetic parameters related to biomass accumulation in a global rice diversity survey. Plant Physiol. 175,
248–258 (2017).
20. Sadras, V., Lawson, C. & Montoro, A. Photosynthetic traits in Australian wheat varieties released between 1958 and 2007. Field
Crops Res. 134, 19–29 (2012).
21. Driever, S. M., Lawson, T., Andralojc, P. J., Raines, C. A. & Parry, M. A. Natural variation in photosynthetic capacity, growth, and
yield in 64 field-grown wheat genotypes. J. Exp. Bot. 65, 4959–4973 (2014).
22. Peng, S. Single-leaf and canopy photosynthesis of rice. In Studies in Plant Science, Volume 7 Redesigning Rice Photosynthesis to
Increase Yield (eds. Sheehy, J. E., Mitchell, P. L. & Hardy, B.) 213–228 (Elsevier, 2000).
23. Murata, Y. Studies on photosynthesis in rice plants and its culture significance. Bull. Natl. Inst. Agric. Sci. Ser. D 9, 1–169 (1961).
24. Cook, M. G. & Evans, L. T. Some physiological aspects of the domestication and improvement of rice (Oryza spp.). Field Crops
Res. 6, 219–238 (1983).
25. Fischer, R. et al. Wheat yield progress associated with higher stomatal conductance and photosynthetic rate, and cooler canopies.
Crop Sci. 38, 1467–1475 (1998).
26. Carmo-Silva, E. et al. Phenotyping of field-grown wheat in the UK highlights contribution of light response of photosynthesis and
flag leaf longevity to grain yield. J. Exp. Bot. 68, 3473–3486 (2017).
27. Buttery, B., Buzzell, R. & Findlay, W. Relationships among photosynthetic rate, bean yield and other characters in field-grown
cultivars of soybean. Can. J. Plant Sci. 61, 190–197 (1981).
28. Gu, J., Yin, X., Stomph, T. J. & Struik, P. C. Can exploiting natural genetic variation in leaf photosynthesis contribute to increasing
rice productivity? A simulation analysis. Plant Cell Environ. 37, 22–34 (2014).
29. Sasaki, H. & Ishii, R. Cultivar differences in leaf photosynthesis of rice bred in Japan. Photosynth. Res. 32, 139–146 (1992).
30. Zhang, W.-H. & Kokubun, M. Historical changes in grain yield and photosynthetic rate of rice cultivars released in the 20th century
in Tohoku region. Plant Prod. Sci. 7, 36–44 (2004).
31. Murchie, E. H., Yang, J., Hubbart, S., Horton, P. & Peng, S. Are there associations between grain-filling rate and photosynthesis in
the flag leaves of field-grown rice?. J. Exp. Bot. 53, 2217–2224 (2002).
32. Crosbie, T. M., Pearce, R. B. & Mock, J. J. Relationships among C O2-exchange rate and plant traits in Iowa Stiff Stalk Synthetic
maize population. Crop Sci. 18, 87–90 (1978).
33. Adachi, S. et al. Fine mapping of Carbon Assimilation Rate 8, a quantitative trait locus for flag leaf nitrogen content, stomatal
conductance and photosynthesis in rice. Front. Plant Sci. 8, 60. https://doi.org/10.3389/fpls.2017.00060 (2017).
34. Evans, L. T. Crop Evolution, Adaptation and Yield. (Cambridge University Press, 1993).
35. Austin, R. Genetic variation in photosynthesis. J. Agric. Sci. 112, 287–294 (1989).
36. Gifford, R. M. & Evans, L. T. Photosynthesis, carbon partitioning, and yield. Ann. Rev. Plant Physiol. 32, 485–509 (1981).
37. Rawson, H., Hindmarsh, J., Fischer, R. & Stockman, Y. Changes in leaf photosynthesis with plant ontogeny and relationships with
yield per ear in wheat cultivars and 120 progeny. Funct. Plant Biol. 10, 503–514 (1983).
38. Ohsumi, A. et al. A model explaining genotypic and ontogenetic variation of leaf photosynthetic rate in rice (Oryza sativa) based
on leaf nitrogen content and stomatal conductance. Ann. Bot. 99, 265–273 (2007).
39. Adachi, S. et al. Fine mapping of carbon assimilation rate 8, a quantitative trait locus for flag leaf nitrogen content, stomatal con-
ductance and photosynthesis in rice. Front. Plant Sci. https://doi.org/10.3389/fpls.2017.00060 (2017).
Scientific Reports | (2021) 11:7579 | https://doi.org/10.1038/s41598-021-86983-9 9
Vol.:(0123456789)www.nature.com/scientificreports/
40. Peterson, R. B. & Zelitch, I. Relationship between net CO2 assimilation and dry weight accumulation in field-grown tobacco. Plant
Physiol. 70, 677–685 (1982).
41. Salter, W. T., Gilbert, M. E. & Buckley, T. N. A multiplexed gas exchange system for increased throughput of photosynthetic capacity
measurements. Plant Methods 14, 80. https://doi.org/10.1186/s13007-018-0347-y (2018).
42. Xu, Y.-F., Ookawa, T. & Ishihara, K. Analysis of the photosynthetic characteristics of the high-yielding rice cultivar Takanari. Jpn.
J. Crop Sci. 66, 616–623 (1997).
43. Taylaran, R. D., Adachi, S., Ookawa, T., Usuda, H. & Hirasawa, T. Hydraulic conductance as well as nitrogen accumulation plays
a role in the higher rate of leaf photosynthesis of the most productive variety of rice in Japan. J. Exp. Bot. 62, 4067–4077 (2011).
44. Takai, T. et al. A natural variant of NAL1, selected in high-yield rice breeding programs, pleiotropically increases photosynthesis
rate. Sci. Rep. 3, 2149. https://doi.org/10.1038/srep02149 (2013).
45. Chen, C. P. et al. Do the rich always become richer? Characterizing the leaf physiological response of the high-yielding rice cultivar
Takanari to free-air CO2 enrichment. Plant Cell Physiol. 55, 381–391 (2014).
46. Muryono, M. et al. Nitrogen distribution in leaf canopies of high-yielding rice cultivar Takanari. Crop Sci. 57, 2080–2088 (2017).
47. Takai, T. et al. Effects of yield-related QTLs SPIKE and GPS in two indica rice genetic backgrounds. Plant Prod. Sci. 20, 467–476.
https://doi.org/10.1080/1343943X.2017.1385404 (2017).
48. Ikawa, H. et al. Increasing canopy photosynthesis in rice can be achieved without a large increase in water use-A model based on
free-air CO2 enrichment. Glob. Change Biol. 24, 1321–1341 (2018).
49. Adachi, S. et al. High-yielding rice Takanari has superior photosynthetic response to a commercial rice Koshihikari under fluctuat-
ing light. J. Exp. Bot. 70, 5287–5297 (2019).
50. Ohkubo, S., Tanaka, Y., Yamori, W. & Adachi, S. Rice cultivar Takanari has higher photosynthetic performance under fluctuating
light than Koshihikari, especially under limited nitrogen supply and elevated C O2. Front. Plant Sci. https://doi.org/10.3389/fpls.
2020.01308 (2020).
51. Katsura, K., Okami, M., Mizunuma, H. & Kato, Y. Radiation use efficiency, N accumulation and biomass production of high-
yielding rice in aerobic culture. Field Crops Res. 117, 81–89 (2010).
52. Takai, T. et al. Genetic mechanisms underlying yield potential in the rice high-yielding cultivar Takanari, based on reciprocal
chromosome segment substitution lines. BMC Plant Biol. 14, 295. https://doi.org/10.1186/s12870-014-0295-2 (2014).
53. Nakano, H. et al. Quantitative trait loci for large sink capacity enhance rice grain yield under free-air C O2 enrichment conditions.
Sci. Rep. 7, 1827. https://doi.org/10.1038/s41598-017-01690-8 (2017).
54. Hasegawa, T. et al. A high-yielding rice cultivar “Takanari” shows no N constraints on C O2 fertilization. Front. Plant Sci. 10, 361.
https://doi.org/10.3389/fpls.2019.00361 (2019).
55. Hirotsu, N. et al. Partial loss-of-function of NAL1 alters canopy photosynthesis by changing the contribution of upper and lower
canopy leaves in rice. Sci. Rep. 7, 15958. https://doi.org/10.1038/s41598-017-15886-5 (2017).
56. Adachi, S. et al. Genetic architecture of leaf photosynthesis in rice revealed by different types of reciprocal mapping populations.
J. Exp. Bot. 70, 5131–5144 (2019).
57. Yamamoto, T., Uga, Y. & Yano, M. Genomics-assisted allele mining and its integration into rice breeding. In Genomics of Plant
Genetic Resources Volume 2 Crop Productivity, Food Security and Nutritional Quality (eds. Tuberosa, R., Graner, A. & Frison, E.)
251–265 (Springer, 2014).
58. Wei, X. et al. A quantitative genomics map of rice provides genetic insights and guides breeding. Nat. Genet. 53, 243–253 (2021).
59. Zelitch, I. The close relationship between net photosynthesis and crop yield. Bioscience 32, 796–802 (1982).
60. Adachi, S. et al. Identification and characterization of genomic regions on chromosomes 4 and 8 that control the rate of photo-
synthesis in rice leaves. J. Exp. Bot. 62, 1927–1938 (2011).
61. Gu, J., Yin, X., Struik, P. C., Stomph, T. J. & Wang, H. Using chromosome introgression lines to map quantitative trait loci for pho-
tosynthesis parameters in rice (Oryza sativa L.) leaves under drought and well-watered field conditions. J. Exp. Bot. 63, 455–469
(2012).
62. Venkatraman, S., Praveen, K. & Long, S. P. Decreasing, not increasing, leaf area will raise crop yields under global atmospheric
change. Glob. Change Biol. 23, 1626–1635 (2017).
63. Takai, T. et al. Effects of quantitative trait locus MP3 on number of panicles and rice productivity in nutrient-poor soils of Mada-
gascar. Crop Sci. 61, 519–528 (2020).
64. Salter, W. T., Merchant, A., Trethowan, R. M., Richards, R. A. & Buckley, T. N. Wide variation in the suboptimal distribution of
photosynthetic capacity in relation to light across genotypes of wheat. AoB Plants. https://doi.org/10.1093/aobpla/plaa039 (2020).
65. Song, Q., Wang, Y., Qu, M., Ort, D. R. & Zhu, X.-G. The impact of modifying photosystem antenna size on canopy photosynthetic
efficiency-Development of a new canopy photosynthesis model scaling from metabolism to canopy level processes. Plant Cell
Environ. 40, 2946–2957 (2017).
66. San, N. S. et al. Differences in lamina joint anatomy cause cultivar differences in leaf inclination angle of rice. Plant Prod. Sci. 21,
302–310. https://doi.org/10.1080/1343943X.2018.1500488 (2018).
67. Yamori, W. Photosynthetic response to fluctuating environments and photoprotective strategies under abiotic stress. J. Plant Res.
129, 379–395 (2016).
68. Taylor, S. H. & Long, S. P. Slow induction of photosynthesis on shade to sun transitions in wheat may cost at least 21% of produc-
tivity. Philos. Trans. R. Soc. B Biol. Sci. 372, 1730 (2017).
69. Tanaka, Y., Adachi, S. & Yamori, W. Natural genetic variation of the photosynthetic induction response to fluctuating light environ-
ment. Curr. Opin. Plant Biol. 49, 52–59 (2019).
70. Hirasawa, T. & Hsiao, T. C. Some characteristics of reduced leaf photosynthesis at midday in maize growing in the field. Field Crops
Res. 62, 53–62 (1999).
71. R Core Team. R: A language and environment for statistical computing. https://www.R-project.org/ (2020).
72. Cleveland, W. S. Robust locally weighted regression and smoothing scatterplots. J. Am. Stat. Assoc. 74, 829–836 (1979).
Acknowledgements
This work was supported in part by the Japan Science and Technology Agency, CREST Grant number JPM-
JCR15O2 (to S.A. and A.N), by JSPS KAKENHI (Grant numbers JP18K05585 and JP19H02939 to S.A., and
JP19H02940 to T.O. and S.A.), and by Ibaraki University Grant for Presidential Support for Acceleration of
Distinctive Research (to S.A.). We are grateful to Dr. T. Yamamoto (National Agriculture and Food Research
Organization) for providing seeds of rice cultivars Koshihikari and Takanari, and the set of CSSLs. We are grateful
to Ms. T. Yamanouchi and Ms. Y. Yamashita for assistance with rice cultivation and data analysis, to Mr. K. Mat-
sukawa for rice field management, and to Dr. T. Takai for helpful suggestions for completion of the manuscript.
Author contributions
A.J.N. and S.A. designed the experiments. S.H., S.O., N.S., A.N., and K.T. performed the experiments. S.H., S.O.,
and S.A. wrote the manuscript. K.K., T.O., and A.J.N. contributed to finalization of the manuscript.
Scientific Reports | (2021) 11:7579 | https://doi.org/10.1038/s41598-021-86983-9 10
Vol:.(1234567890)www.nature.com/scientificreports/
Competing interests
The authors declare no competing interests.
Additional information
Supplementary Information The online version contains supplementary material available at https://doi.org/
10.1038/s41598-021-86983-9.
Correspondence and requests for materials should be addressed to S.A.
Reprints and permissions information is available at www.nature.com/reprints.
Publisher’s note Springer Nature remains neutral with regard to jurisdictional claims in published maps and
institutional affiliations.
Open Access This article is licensed under a Creative Commons Attribution 4.0 International
License, which permits use, sharing, adaptation, distribution and reproduction in any medium or
format, as long as you give appropriate credit to the original author(s) and the source, provide a link to the
Creative Commons licence, and indicate if changes were made. The images or other third party material in this
article are included in the article’s Creative Commons licence, unless indicated otherwise in a credit line to the
material. If material is not included in the article’s Creative Commons licence and your intended use is not
permitted by statutory regulation or exceeds the permitted use, you will need to obtain permission directly from
the copyright holder. To view a copy of this licence, visit http://creativecommons.org/licenses/by/4.0/.
© The Author(s) 2021
Scientific Reports | (2021) 11:7579 | https://doi.org/10.1038/s41598-021-86983-9 11
Vol.:(0123456789)You can also read