Seasonal trends in photosynthesis and leaf traits in scarlet oak - Oxford Academic Journals
←
→
Page content transcription
If your browser does not render page correctly, please read the page content below
Tree Physiology 41, 1413–1424
https://doi.org/10.1093/treephys/tpab015

Research paper

Seasonal trends in photosynthesis and leaf traits in scarlet oak

                                                                                                                                                                       Downloaded from https://academic.oup.com/treephys/article/41/8/1413/6145907 by guest on 28 October 2021
Angela C. Burnett 1,2,3 , Shawn P. Serbin 1 , Julien Lamour 1 , Jeremiah Anderson                                                          1,

Kenneth J. Davidson 1 , Dedi Yang 1 and Alistair Rogers 1

1
 Environmental and Climate Sciences Department, Brookhaven National Laboratory, Upton, NY 11973, USA; 2 Present address: Department of Plant Sciences, University of
Cambridge, Downing Street, Cambridge CB2 3EA, UK; 3 Corresponding author (acb219@cam.ac.uk)

Received September 25, 2020; accepted January 22, 2021; handling Editor Annikki Mäkelä

Understanding seasonal variation in photosynthesis is important for understanding and modeling plant productivity.
Here, we used shotgun sampling to examine physiological, structural and spectral leaf traits of upper canopy,
sun-exposed leaves in Quercus coccinea Münchh (scarlet oak) across the growing season in order to understand
seasonal trends, explore the mechanisms underpinning physiological change and investigate the impact of extrapolating
measurements from a single date to the whole season. We tested the hypothesis that photosynthetic rates and capacities
would peak at the summer solstice, i.e., at the time of peak photoperiod. Contrary to expectations, our results reveal a
late-season peak in both photosynthetic capacity and rate before the expected sharp decrease at the start of senescence.
This late-season maximum occurred after the higher summer temperatures and vapor pressure deficit and was correlated
with the recovery of leaf water content and increased stomatal conductance. We modeled photosynthesis at the top of
the canopy and found that the simulated results closely tracked the maximum carboxylation capacity of Rubisco. For both
photosynthetic capacity and modeled top-of-canopy photosynthesis, the maximum value was therefore not observed at
the summer solstice. Rather, in each case, the measurements at and around the solstice were close to the overall seasonal
mean, with values later in the season leading to deviations from the mean by up to 41 and 52%, respectively. Overall,
we found that the expected Gaussian pattern of photosynthesis was not observed. We conclude that an understanding
of species- and environment-specific changes in photosynthesis across the season is essential for correct estimation of
seasonal photosynthetic capacity.

    Keywords: gas exchange, leaf traits, phenology, physiology, temporal changes, V c,max .

Introduction                                                                         for photosynthesis, yet the relationship between nitrogen and
Photosynthesis underpins primary productivity on Earth. Under-                       photosynthesis has been shown to vary by plant functional
standing photosynthesis is essential for developing accurate                         type (Kattge et al. 2009), making this challenging. In addition,
terrestrial biosphere models (TBMs), which aim to represent                          consideration of seasonal changes is important given that
the responses of plants to future climate and the role plants                        photosynthetic capacity has been shown to display significant
play in determining the rate of global change. Accounting for                        variation during the growing season (Wilson et al. 2001, Wang
temporal and spatial variation in photosynthesis is critical if                      et al. 2008, Bauerle et al. 2012, Ali et al. 2015). Environmental
TBMs are to accurately predict carbon fluxes across space and                        parameters such as photoperiod and growth temperature may
through time. For example, under-representation of photosyn-                         explain this seasonal variation in photosynthetic capacity, since
thetic understanding due to an absence of relevant data in                           climatic conditions have been demonstrated to be a better
certain geographical areas, such as Arctic ecosystems, can lead                      proxy for photosynthesis than leaf nitrogen (Ali et al. 2015,
to significant biases in model predictions (e.g., Rogers et al.                      Smith et al. 2019). For example, a recent study of 23 tree
2017). To address the constraint of limited data availability                        species found that photoperiod was the primary environmental
for parameterization, some TBMs use nitrogen as a proxy                              driver for seasonal changes in photosynthetic capacity—both

Published by Oxford University Press 2021.
This work is written by US Government employees and is in the public domain in the US.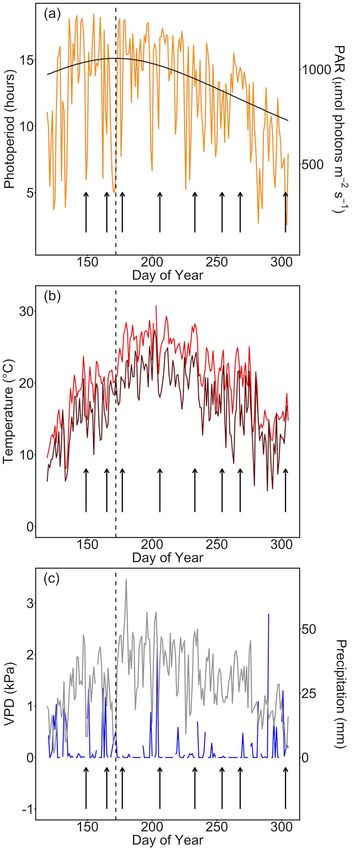
1414 Burnett et al.

the maximum carboxylation capacity of Rubisco (V c,max ) and the     overestimation of mean photosynthesis if used as a model
maximum electron transport rate (Jmax ) (Bauerle et al. 2012).       parameter.
However, the extent to which different environmental condi-
tions underpin photosynthetic rate can vary between species
                                                                     Materials and methods
and ecosystems studied, with temperature, moisture availability
and atmospheric humidity being other important environmental         Tree material
factors to consider (Ali et al. 2015).                               Quercus coccinea Muench (scarlet oak) samples were obtained
   The A–C i response curves measure the response of photo-          from a mixed pine-oak forest at Brookhaven National Laboratory,
synthesis (A) to the internal CO2 concentration inside the leaf      Upton, NY, USA (latitude 40.864466, longitude 72.875158,
(Ci ). With these curves, it is possible to derive the estimates     18-m elevation). Scarlet oak is a native, deciduous, xerophytic
of the apparent maximum carboxylation capacity of Rubisco            tree with an open, rounded crown (USDA 2019). The study
(V c,max ) and apparent maximum electron transport rate (Jmax ),

                                                                                                                                          Downloaded from https://academic.oup.com/treephys/article/41/8/1413/6145907 by guest on 28 October 2021
                                                                     site is part of the Long Island Pine Barrens, characterized by
two key parameters related to photosynthetic capacity (Long          dry sandy soils (Meng et al. 2017). Six trees were selected at
and Bernacchi 2003). However, obtaining accurate measure-            the start of the measurement season and labeled with flagging
ments of photosynthetic capacity in tree species is not without      tape to enable repeated measurements. The trees were located
its challenges. The ideal scenario, performing measurements          in a small geographic area (
Seasonal trends in scarlet oak 1415
Downloaded from https://academic.oup.com/treephys/article/41/8/1413/6145907 by guest on 28 October 2021
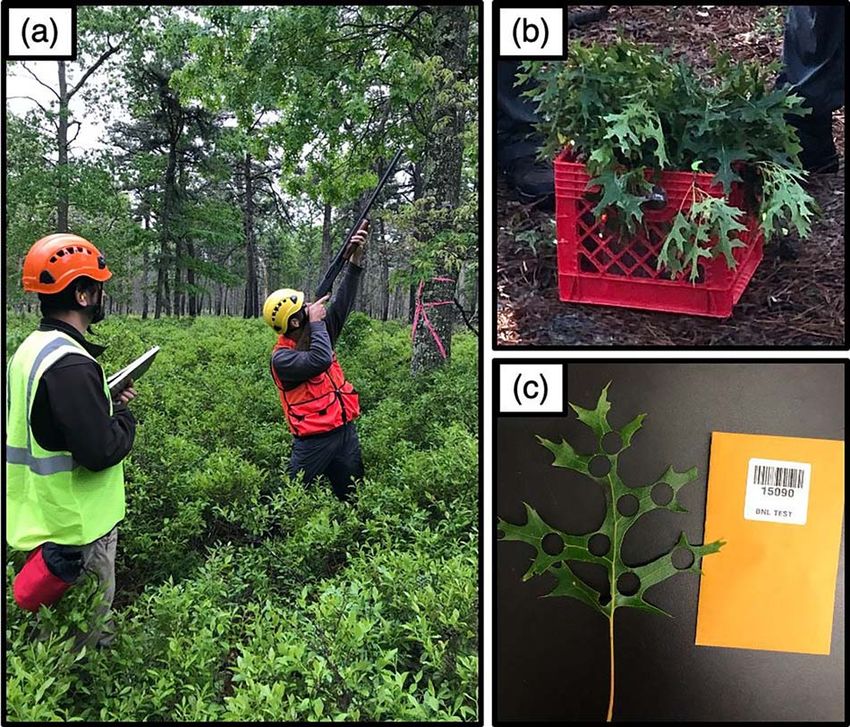
Figure 1. Shotgun sampling technique for retrieving leaf samples of
Q. coccinea. (a) A shotgun was used to obtain a sample from the top
of the canopy. (b) Stems were re-cut underwater and samples stored
on the forest floor until sample collection was complete. (c) Following
physiological data collection, leaf discs were punched out of the leaf;
discs were used in subsequent measurements of structural traits and
leaf nitrogen.
October). Gas exchange measurements were collected on seven
of the eight sampling dates; all leaf trait data were collected on
each sampling date with the exception of one date for which no
relative water content (RWC) values could be calculated.
Chlorophyll and PRI
For each sample, spectral data were collected using a PSR+
full-range spectroradiometer (Spectral Evolution, Lawrence, MA,
USA) connected to a leaf clip with an internal light source (SVC,
Poughkeepsie, NY, USA). Immediately prior to each set of mea-
surements, the spectroradiometer was calibrated using a Lab-
Sphere Spectralon® reflectance standard disc (LabSphere, Inc.,
North Sutton, NH, USA). Two to three spectral measurements
were taken across the adaxial surface of each leaf depending
on leaf size, and then averaged to give a single spectrum per
sample. Chlorophyll was estimated from each spectrum using
the Chlorophyll NDI index. The index was derived from using
the formula (R750 − R705)/(R750 + R705) where R is
optical reflectance at the waveband indicated and chlorophyll
content was estimated using the conversion equation provided
by Richardson et al. (2002). The photochemical reflectance
index (PRI) was estimated from each spectrum using the formula
Figure 2. Meteorological data throughout the sampling period, beginning
(R531 − R570)/(R531 + R570) (Gamon et al. 1997). 30 days before the first measurement. Sampling dates are indicated
with vertical black arrows and the midsummer solstice is indicated with
Gas exchange measurements a vertical black dashed line. (a) Photoperiod (solid black line; primary
Gas exchange measurements were performed using four y-axis) and mean daytime PAR on each measurement date (yellow line;
secondary y-axis). (b) Mean daytime temperature (bright red line) and
LI-6400XT Portable Photosynthesis Systems and one LI-
nighttime temperature (dark red line). (c) Maximum daily VPD (gray line;
6800 Portable Photosynthesis System (LI-COR, Lincoln, NE, primary y-axis) and total daily precipitation (bright blue line; secondary
USA). Instruments were zeroed using a common nitrogen y-axis).
Tree Physiology Online at http://www.treephys.oxfordjournals.org
1416 Burnett et al.

standard. In the preceding season, light response curves had          respectively, An is net CO2 assimilation, Cs is CO2 at the
been performed to determine the saturating irradiance level           surface of the leaf (C a ) and Ds is leaf to air VPD. For the first
of 1500 μmol photons m−2 s−1 for Q. coccinea (Burnett                 measurement date, a good estimate of g1 could not be obtained
et al. 2019). The leaf temperature was controlled during              so the mean g1 from all other dates (except the final date for
measurement and the set point was determined by the ambient           which g1 was much higher than on all preceding dates) was
temperature and humidity inside the laboratory at the time of         used instead.
measurement (the temperature ranged from 22 to 28 ◦ C).
Leaves were inserted into the instrument leaf chamber and             Leaf structural and nitrogen trait measurements
underwent full acclimation to saturating light (up to 90 min)
                                                                      Following the completion of each A–Ci curve, discs of known
until both A and stomatal conductance (gs ) had reached steady-
                                                                      area were punched from across the leaf surface, including the
state. The A–Ci curves were performed as described previously,
                                                                      area used for gas exchange and excluding the prominent lower
using 14 values of Ci (Burnett et al. 2019, Rogers et al. 2017).

                                                                                                                                            Downloaded from https://academic.oup.com/treephys/article/41/8/1413/6145907 by guest on 28 October 2021
                                                                      midrib (Figure 1c). Leaf discs were weighed, then dried at
Values of V c,max and Jmax were first obtained by fitting the A–
                                                                      70 ◦ C for several days to achieve constant mass. Dried leaves
Ci curves using the parameters defined by Bernacchi et al.
                                                                      were re-weighed, and RWC and LMA were calculated. Dried
(Bernacchi et al. 2001, 2013, Rogers et al. 2017). Values
                                                                      leaves were subsequently ground, and elemental nitrogen was
of V c,max and Jmax were then normalized to 25 ◦ C with an
                                                                      quantified using a 2400 Series II CHN analyzer following the
Arrhenius temperature scaling function using activation energies
                                                                      manufacturer’s instructions (PerkinElmer, Waltham, MA, USA).
provided by Bernacchi et al. (2001, 2003), to give V c,max.25
and Jmax.25 . Efforts to increase the representation of V c,max       Data analysis
using survey-style measurements of photosynthesis to increase
                                                                      All data analysis was performed within the R open-source
the availability of data from existing databases or to increase the
                                                                      software environment (R Core Team 2019). For analysis of
throughput of data collection are not always reliable if leaves
                                                                      each leaf trait (Figures 3 and 4), a one-way repeated measures
were not light-acclimated prior to measurement (Burnett et al.
                                                                      ANOVA was performed to examine effects over time, with
2019, De Kauwe et al. 2016). Therefore, while being more
                                                                      the individual tree as the Error term. A post hoc Tukey test
time-consuming to perform than a survey-style measurement,
                                                                      was then performed to examine pairwise comparisons between
A–Ci curves remain the gold-standard approach for measuring
                                                                      each possible pair of measurement dates. When required,
photosynthetic capacity. Our analysis is based on Ci rather than
                                                                      data were log- or square-root-transformed prior to analysis as
Cc and therefore does not account for mesophyll conductance.
                                                                      appropriate.
Thus, reported photosynthetic parameters should be considered
as apparent.
   Gas exchange measurements were used to derive photo-               Modeling photosynthesis
synthetic instantaneous water-use efficiency (WUEi) and pho-          Photosynthesis at the top of the canopy was modeled for each
tosynthetic nitrogen-use efficiency (NUE). The WUEi is light-         measurement date using the f.AT function within the ‘Leaf Gas
acclimated steady-state Asat /gs obtained from the first point        Exchange’ package in R (https://github.com/TESTgroup-BNL/
of each A–Ci curve. The NUE is V c,max.25 /N, both expressed          LeafGasExchange/releases/tag/v1.0). This function simulates
on a mass basis; mass-based V c,max was first obtained from           photosynthesis using the simplified USO model coupled with
area-based V c,max.25 and leaf mass per unit area (LMA).              the FvCB assimilation model and a leaf energy budget (Muir
   Gas exchange measurements were also used to calibrate the          2019). The inputs to the model are the ambient atmospheric
conductance model needed for modeling photosynthesis. To              weather conditions surrounding the leaves (photosynthetically
obtain the stomatal slope parameter g1 , which is the slope of        active radiation, air temperature, CO2 concentration at the leaf
the relationship between A and gs and is required for modeling        surface, wind speed and relative humidity), the photosynthetic
photosynthesis as outlined below, the first point of each A–Ci        parameters Rd , V c,max.25 , Jmax.25 and the conductance param-
curve was recorded after initial stabilization of A and gs and        eters g0 and g1 . The outputs are A, gsw , Ci and T leaf . The
acclimation to ambient conditions inside the leaf cuvette. For        function f.AT was parameterized using V c,max.25 , Jmax.25 , g0
each measurement date, the first points from all A–Ci curves          and g1 calibrated using the data from this study. For the other
were pooled, and the g1 parameter from the simplified linear          parameters necessary to calculate photosynthesis, including
USO model (Eq. (1)) was obtained using a linear regression as         Rd , the default parameters used in the Functionally Assembled
shown previously (Lin et al. 2015, Medlyn et al. 2011, Wu et al.      Terrestrial Ecosystem Simulator (Koven et al. 2020) for C3 plant
2020), using a default g0 of 0                                        species were chosen. The weather input variables were set to
                       gsw = g0 + g1
                                       1.6 An
                                         √ ,                   (1)    the mean weather data measured during the week of each
                                       Cs Ds                          sampling date (measurement date ±3 days) during the 6-h
  where gsw is the stomatal conductance to water vapor, g0            period around solar noon (10:00–16:00h BST), and CO2 at
and g1 are the intercept and the slope of the linear regression,      the leaf surface was set to 400 μmol mol−1 .

Tree Physiology Volume 41, 2021
Seasonal trends in scarlet oak 1417

                                                                                                                                                           Downloaded from https://academic.oup.com/treephys/article/41/8/1413/6145907 by guest on 28 October 2021

Figure 3. Seasonal trends in leaf structural traits, nitrogen, chlorophyll and PRI. The midsummer solstice is indicated with a dashed line. (a) RWC;
(b) LMA; (c) leaf nitrogen concentration per gram; (d) leaf nitrogen content per m2 ; (e) chlorophyll estimated using a leaf reflectance index; (f) PRI.
Plots show mean ± SE, n = 6 trees.

                                                                              Tree Physiology Online at http://www.treephys.oxfordjournals.org
1418 Burnett et al.

                                                                                                                                                            Downloaded from https://academic.oup.com/treephys/article/41/8/1413/6145907 by guest on 28 October 2021

Figure 4. Seasonal trends in photosynthetic traits. The midsummer solstice is indicated with a dashed line. (a) Maximum carboxylation capacity of
Rubisco normalized to 25 ◦ C, V c,max.25 ; (b) maximum electron transport rate normalized to 25 ◦ C, Jmax.25 ; (c) light-saturated photosynthesis, Asat ,
measured immediately prior to the A–Ci curve; (d) light-acclimated stomatal conductance, gs , measured immediately prior to the A–Ci curve; (e)
instantaneous water-use efficiency, WUEi; (f) NUE of photosynthesis. Plots show mean ± SE, n = 6 trees.

Tree Physiology Volume 41, 2021
Seasonal trends in scarlet oak 1419
Results Photosynthetic traits
Leaf structural traits The derived photosynthetic parameters V c,max.25 , Jmax.25 and
light-acclimated net photosynthetic rate Asat showed similar
The RWC and LMA showed inverse relationships to each
trends (Figure 4) with a significant effect of time in each case
other (Figure 3). Relative water content was initially very high,
(V c,max.25 F (6,29) = 5.2; P < 0.001; Jmax.25 F (6,26) = 4.2,
declined in the middle of the season and then increased toward
P < 0.01; Asat F (6,29) = 3.7, P < 0.01). These parameters all
the end of the season; LMA was initially very low, increased
showed a late season peak (at the penultimate measurement
toward the middle of the season and declined again at the end
date), followed by a sharp decline. The decline in Jmax.25
of the season. In each case, trait values differed significantly over
between the penultimate and final time points was less marked
time (RWC F (6,30) = 185.8, P < 0.001; LMA F (7,35) = 11.1,
(41%) than the equivalent decline in V c,max.25 (55%). Stom-
P < 0.001). Pairwise comparisons revealed a significant differ-
atal conductance (gs ) measured following full acclimation to
ence in RWC between all possible measurement date pairs with
Downloaded from https://academic.oup.com/treephys/article/41/8/1413/6145907 by guest on 28 October 2021
saturating irradiance, i.e., immediately prior to measuring the
the exception of the pairs DOY 165–177 (stabilization of RWC
A–Ci response followed the same pattern as V c,max.25 , Jmax.25
around the solstice), 254–303 and 268–303 (stabilization
and Asat for most of the season (gs F (6,29) = 4.7, P < 0.01),
at the end of the season). For LMA, there was a significant
but was decoupled at the final time point which showed a
difference for the following pairs of measurement dates: DOY
very low value of Asat compared with gs (Figure 4). This
149–165, 149–177, 149–206, 149–233, 149–254, 149–
trend is reflected in WUEi, which was at the minimum at the
268, 165–206, 206–233, 206–303 and 254–303, in line
final time point due to a low rate of Asat compared with gs
with the strong and significant increase at the beginning of
(Figure 4). In contrast, photosynthetic NUE remained relatively
the season, a dip between DOY 206 and 233 and the decline
constant throughout the measurement period, with the greatest
toward the end of the season. The reporting format ‘DOY1’–
value at the penultimate measurement date coinciding with the
‘DOY2’ used here indicates a significant difference between the
late-season peak in photosynthesis (Figure 4). Both WUEi and
two named DOYs and does not refer to a date range.
NUE displayed significant time effects (WUEi F (6,29) = 16.0,
P < 0.001; NUE F (6,29) = 4.5, P < 0.01).
Leaf nitrogen and chlorophyll
Pairwise comparisons made between all pairs of measure-
When expressed on a leaf mass basis, nitrogen concentration ment dates revealed significant differences in V c,max.25 between
was initially high, was stable throughout much of the season DOY 165–254, 254–268, 254–303 and 268–303, highlight-
and then gradually declined over the last three measurement ing the late-season peak on DOY 268 and dramatic decline at
dates (Figure 3). When expressed on a leaf area basis, nitrogen the end of the season. Differences in Jmax.25 were significant
showed a steady increase followed by a steady decrease, with a between DOY 254–268 and 254–303; differences in Asat were
sharp decline to the final time point, closely following the trend in significant between DOY 165–254, 254–268 and 254–303;
LMA (Figure 3). Leaf chlorophyll and PRI showed similar trends differences in gs were significant between DOY 165–254, 165–
to nitrogen per unit area (Figure 3). Trends in each trait showed 268 and 165–303; in each case, these significant differences
significant effects of time (mass-based nitrogen F (7,35) = 20.1, relate to the late-season peak and subsequent decline described
P < 0.001; area-based nitrogen F (7,35) = 10.2, P < 0.001; above. Differences in WUEi were significant between DOY 165–
chlorophyll F (7,35) = 15.3, P < 0.001; PRI F (7,35) = 14.0, 233, 165–254 and 165–268, showing the decline from the
P < 0.001). For mass-based nitrogen, significant differences maximum just before the summer solstice, and between the
were observed for the date pairs 149–254, 149–268 and final measurement date (DOY 303) and each preceding date,
between the final measurement date (DOY 303) and each indicating the sharp decrease in WUE at the end of the sea-
preceding date. For area-based nitrogen, significant differences son compared with all other dates. Differences in NUE were
were observed between DOY 149 and 206 and between significant between DOY 165–254 and 254–303.
the final measurement date (DOY 303) and each preceding
date, with the exception of DOY 149 and 303 which did Modeling photosynthesis
not differ significantly. For chlorophyll, there was a significant Using ambient environmental conditions from the week of mea-
difference between the first measurement date (DOY 149) surement (measurement date ±3 days) during the 6-h period
and all subsequent dates with the exception of DOY 303, around solar noon (10:00–16:00h BST), and modeled values
and there was a significant difference between the final mea- of g0 and g1 , modeled values of V c,max.25 and Jmax.25 were used
surement date (DOY 303) and each of the preceding dates to predict the rate of net photosynthesis at the top of the canopy
with the exception of DOY 149. For PRI, there were significant (Figure 5). Modeled photosynthesis closely matched the trend
differences between DOY 303 and each of the preceding in V c,max.25 —including the steeper decline at the final time point
dates. seen for V c,max.25 than for Jmax.25 (Figure 4).
Tree Physiology Online at http://www.treephys.oxfordjournals.org1420 Burnett et al.
pigment content, LMA and area-based nitrogen, while mass-
based nitrogen and RWC generally showed a steady decline
from leaf flush to senescence. Contrary to our expectations,
and in contrast to the findings of several previous studies
demonstrating the seasonal Gaussian trend in photosynthesis
that we had expected, with the peak at the summer solstice
(Bauerle et al. 2012, Grassi et al. 2005, Kosugi and Matsuo
2006, Wilson et al. 2000, 2001), the peak in photosynthetic
rate and capacity occurred late in the season, at the penultimate
measurement point (Figure 4). While the amount of daylight
was greatest at the midsummer solstice (Figure 2), with both
the highest photosynthetically active radiation (PAR and the
Downloaded from https://academic.oup.com/treephys/article/41/8/1413/6145907 by guest on 28 October 2021
longest) daylength combining to give the greatest integrated
daily light levels, this did not coincide with maximal photo-
synthetic rate. Rather, the peak in V c,max.25 , Jmax.25 and Asat
Figure 5. Photosynthesis (A) at the top of the canopy modeled from occurred once the high summer temperatures and VPD began to
environmental data, photosynthetic capacity and stomatal slope param- decline yet before daily PAR decreased (Figures 2 and 4). This
eters. The midsummer solstice is indicated with a dashed line. Plots show
mean ± SE, n = 6 trees. coincided with an increase in RWC (Figure 3) that followed the
peak summer heat (Figure 2). While the year of measurement
was slightly warmer and drier than some previous years, it
Using the model framework, we further explored how season-
was not exceptional in terms of meteorological factors (see
ality in parameters could impact the modeling of growing season
Figure S1 available as Supplementary Data at Tree Physiology
photosynthesis. We did this by examining the deviation from the
Online). A previous study in which Quercus douglasii (blue oak)
mean in both V c,max.25 and modeled A to explore how seasonal
was exposed to heat stress revealed a strong effect of heat on
conditions can change the overall canopy-scale photosynthetic
V c,max.25 ; this study also showed a slight end of season peak in
carbon update. We found that there was substantial seasonality,
V c,max.25 prior to senescence although this was not the seasonal
and variation increased throughout the season with values both
maximum (Xu and Baldocchi 2003).
greater and lower than the mean (Figure 6). In each case, the
The RWC and LMA were generally inversely correlated with
deviation was lowest at and around the midsummer solstice and
one another (Figure 3). At the start of the season, RWC was
greatly increased in magnitude with the late-season peak and
at its highest and LMA at its lowest as the developing leaves
end-season decline in photosynthesis (Figure 6). The maximum
were thin, soft and not fully expanded at the first measurement
deviation from the mean was 41% for V c,max.25 and 52% for
date, which was within a couple of weeks of leaf flushing.
modeled A.
After the solstice, as temperatures increased, RWC declined
and recovered later in the season as temperatures declined
Discussion (Figures 2 and 3). Leaf mass per unit area, conversely, was high
We sought to understand seasonal trends in physiological traits during the middle of the season where leaves were structurally
of Q. coccinea, explore the mechanisms underpinning these mature, and declined at the end, in accordance with studies
trends and consider the modeling implications of using single demonstrating a positive correlation between leaf age and LMA
time point measurements of photosynthesis to parameterize during the growing season prior to senescence (Grassi et al.
carbon models. Our results indicate a surprising late-season 2005, Hikosaka et al. 2007, Wright et al. 2006).
maximum in photosynthesis coincident with a rise in leaf water The seasonal change in photosynthesis seen here appears
content and stomatal conductance, lower air temperatures and to be driven by climatic factors rather than photoperiod. The
an overall reduction in atmospheric VPD. In contrast to our lower temperatures and VPD, accompanied by higher RWC, are
hypothesis, photosynthetic capacity did not peak at the solstice correlated with an increase in gs and increased photosynthetic
and displayed significant deviation from the mean value later in rate and capacity enabling Q. coccinea to maximize carbon gain
the season. in advance of leaf senescence and over-wintering (Figures 2–
4). Relationships between the meteorological data and V c,max.25
Variability in photosynthetic capacity and rate is related presented in this study are shown in Figure S2 (available as
to climate Supplementary Data at Tree Physiology Online). Several previous
Photosynthetic traits displayed great variability across the sea- studies have demonstrated strong effects of environmental fac-
son. Similar to previous studies (e.g., Yang et al. 2016), we tors on photosynthesis, in a range of species (e.g., Choat et al.
observed a typical Gaussian seasonal curve for traits such as 2006, Ellsworth 2000, Grassi et al. 2005, Kosugi and Matsuo
Tree Physiology Volume 41, 2021Seasonal trends in scarlet oak 1421
Downloaded from https://academic.oup.com/treephys/article/41/8/1413/6145907 by guest on 28 October 2021
Figure 6. Both the maximum carboxylation capacity of Rubisco (V c,max.25 ) and modeled photosynthesis (A) at the top of the canopy deviate from
the mean, with deviation increasing as the measurement season progresses. The horizontal black line (y = 0) indicates the mean value of V c,max.25
or A. The midsummer solstice is indicated with a dashed line. (a) Absolute deviation in V c,max.25 ; (b) percentage deviation in V c,max.25 ; (c) absolute
deviation in modeled A; (d) percentage deviation in modeled A.
2006). These responses vary between species; for example, Leaf senescence is accompanied by a strong
a comparison of evergreen and deciduous species in Australia decline in photosynthesis
highlighted the greater sensitivity of photosynthesis in decidu- Leaf age effects, in addition to environmental factors, vary during
ous trees to dryness (Choat et al. 2006). Furthermore, it should the growing season, with nutrient resorption being a key process
be noted that in addition to seasonal trends in environmental affecting photosynthetic activity at the time of leaf senescence
factors throughout the growing season, the environment at the (Crous et al. 2019); ontogenetic effects impact photosynthe-
time of leaf flushing can also impact physiological processes sis throughout leaf development (Ellsworth 2000, Field and
(Wujeska-Klause et al. 2019).
Tree Physiology Online at http://www.treephys.oxfordjournals.org1422 Burnett et al.
Mooney 1983, Grassi et al. 2005, Greenwood et al. 2008, therefore a low amount of nitrogen per unit area (Figure 3), as
Hikosaka et al. 2007, Jach and Ceulemans 2000, Kosugi and has been found previously (Grassi et al. 2005, Hikosaka et al.
Matsuo 2006, Wright et al. 2006). In the present study, between 2007, Wright et al. 2006). However, the nitrogen concentration
the penultimate and final time points, PAR and temperature per unit mass was at its highest at the first measurement
decreased dramatically (Figure 2), accompanied by a sharp (Figure 3), as seen elsewhere (Yang et al. 2016) since leaf
decrease in nitrogen, chlorophyll and PRI (Figure 3). Although growth was concurrent with assembly of the photosynthetic
values of RWC and gs displayed relatively little change between machinery despite full leaf expansion not having been achieved.
the penultimate and the final time point (Figures 3 and 4), Asat Chlorophyll, PRI and nitrogen content mimicked the trend in
decreased sharply between the last two measurement dates LMA to a large extent and this was especially the case for
leading to a decoupling of Asat and gs and a strong decrease nitrogen (Figure 3). However, this relationship was decoupled
in WUEi (Figure 4). The decrease in Asat was accompanied at the final time point. While chlorophyll and nitrogen dropped
by a sharp decline in V c,max.25 and Jmax.25 (Figure 4). The sharply to their lowest levels due to the nutrient remobiliza-
Downloaded from https://academic.oup.com/treephys/article/41/8/1413/6145907 by guest on 28 October 2021
decline in V c,max.25 was relatively greater than the decline in tion processes of leaf senescence, LMA did not decline so
Jmax.25 , which did not drop below its previous lowest value. steeply. The tight link between nitrogen and chlorophyll (when
This might reflect the greater dependency of V c,max.25 than nitrogen is expressed on a leaf area basis) likely reflects the
Jmax.25 on leaf nitrogen content, which decreased greatly at the coupling between chlorophyll for light harvesting and nitrogen
final time point in line with the onset of nutrient resorption and for the enzymes of the Calvin–Benson cycle (in particular,
leaf senescence (Figure 4). Moreover, leaf ontogeny interacts Rubisco).
with the environment. An example of this interaction is that
older leaves may be less susceptible to drought; one study Implications for modeling photosynthesis
demonstrated that year-old leaves of the evergreen loblolly pine Modeled photosynthesis at the top of the canopy closely
were less affected by drought than new leaves and reached peak reflected V c,max.25 indicative of Rubisco limited (or RuBP
photosynthetic capacity earlier in the year (Ellsworth 2000), saturated) photosynthesis throughout the season (Figures 4
while a study of deciduous trees showed that the Gaussian and 5). In order to understand the constraints associated with
trend in photosynthesis associated with changing leaf age and selecting a time point for deriving model parameters, we plotted
environmental conditions throughout the season persisted but the deviation in V c,max.25 and modeled A for each measurement
with a reduced photosynthetic capacity, during conditions of date (Figure 6). In each case, values early in the season, before
summer drought (Grassi et al. 2005). and around the midsummer solstice, led to lower deviation
from the mean than values later in the season (Figure 6). This
Photosynthetic NUE is maintained throughout the season is due to the late season peak in photosynthesis occurring
Photosynthetic NUE remained fairly constant throughout the before the end of season decline, which contributes large
measurement season, with the exception of the penultimate deviations in V c,max.25 and modeled A. In our analysis, these
time point (Figure 4). The lowest NUE coincided with the lowest trends in photosynthetic parameters mean that we did not
photosynthesis, during the hottest and driest part of the season, observe a peak in V c,max.25 and modeled A at the solstice
at which point A decreased while nitrogen remained stable, followed by a decline; these findings therefore contrast with
a trend that has been reported previously in the mid to late our hypothesis that a measurement around the solstice would
summer (Wilson et al. 2001). At the penultimate time point, lead to a large deviation from the seasonal mean. In this
photosynthetic rate and capacity increased significantly while instance, an early-season or midsummer solstice measurement
nitrogen remained very similar compared with the preceding would be most appropriate for deriving a seasonal mean value
measurement (Figures 3 and 4), leading to a peak in NUE. This of V c,max.25 or modeled A for use in carbon cycle models.
may be underpinned by the lower ambient air temperatures and While additional years of measurement are required to confirm
lower VPD facilitating increases in RWC and gs , allowing Asat the trend reported here, alongside continued integration of
to increase (Figures 2–4). At the end of the season, values theory and practice, the surprising variation in photosynthetic
of both photosynthesis and nitrogen were very low due to the capacity and rate uncovered here for Q. coccinea highlights the
remobilization of nitrogen resources during senescence; this necessity of understanding the species-level and ecosystem-
remobilization means that photosynthetic NUE did not decrease level responses of photosynthesis to seasonal change if
despite the low rate and capacity of photosynthesis (Figures 3 accurate estimates of photosynthetic parameters are to be
and 4). obtained.
Trends in nitrogen varied depending on whether nitrogen was Environmental conditions therefore play an important role in
expressed per unit mass or per unit area (Figure 3), due to the modulating seasonal trends in V c,max.25 with a clear need to
changing relationship between leaf mass and area seen in the account for seasonality (Jiang et al. 2020). While climate shapes
LMA data. At the start of the season, leaves had a low LMA and photosynthetic capacity along optimality principles (Smith et al.
Tree Physiology Volume 41, 2021Seasonal trends in scarlet oak 1423
2019), variation gradients also impact physiological processes Funding
at the seasonal scale. Furthermore, environmental factors such
This study was funded by the United States Department
as temperature and water availability interact with leaf ontogeny,
of Energy contract DE-SC0012704 to Brookhaven National
meaning that the biological processes occurring within the plant
Laboratory.
such as leaf expansion impact the extent to which external
parameters affect photosynthesis (Grassi et al. 2005, Kosugi
and Matsuo 2006). We advocate moving away from the need Authors’ contributions
to establish a seasonal mean value of V c,max.25 , toward a A.C.B., S.P.S. and A.R. conceived and designed the study. All
greater understanding of the factors driving seasonality in authors contributed to methodology development, experiment
V c,max.25 . This may then be replicated in models to increase the execution and data collection. A.C.B. analyzed the data and
accuracy of representation of photosynthetic capacity across wrote the manuscript with contributions from S.P.S., J.L. and A.R.
seasons and years under different climatic conditions and across
Downloaded from https://academic.oup.com/treephys/article/41/8/1413/6145907 by guest on 28 October 2021
geographical areas.
References
Ali AA, Xu C, Rogers A et al. (2015) Global-scale environmental control
Conclusions
of plant photosynthetic capacity. Ecol Appl 25:2349–2365.
We hypothesized that photosynthetic rates and capacities would Bauerle WL, Oren R, Way DA, Qian SS, Stoy PC, Thornton PE, Bowden
JD, Hoffman FM, Reynolds RF (2012) Photoperiodic regulation of
be greatest at the midsummer solstice. Our findings run contrary
the seasonal pattern of photosynthetic capacity and the implications
to this hypothesis, with the greatest values of V c,max.25 , Jmax.25 for carbon cycling. Proc Natl Acad Sci USA 109:8612–8617.
and Asat observed at the penultimate measured time point, in Bernacchi CJ, Singsaas EL, Pimentel C, Portis AR Jr, Long SP (2001)
late September. Contrary to our expectations, a measurement of Improved temperature response functions for models of Rubisco-
limited photosynthesis. Plant Cell Environ 24:253–259.
photosynthetic traits in Q. coccinea taken at or around the sum-
Bernacchi CJ, Pimentel C, Long SP (2003) In vivo temperature
mer solstice provides the closest estimate to the mean seasonal response functions required to model RuBP-limited photosynthesis.
value and is therefore the most suitable time point for deriving Plant Cell Environ 26:1419–1430.
model parameters for this species. However, we recommend Bernacchi CJ, Bagley JE, Serbin SP, Ruiz-Vera UM, Rosenthal DM, Van-
incorporating seasonality in models for the most accurate rep- loocke A (2013) Modelling C3 photosynthesis from the chloroplast
to the ecosystem. Plant Cell Environ 36:1641–1657.
resentation. A multi-year, multi-species approach is needed to Burnett AC, Davidson KJ, Serbin SP, Rogers A (2019) The “one-
validate the trends shown here, yet our findings clearly indicate point method” for estimating maximum carboxylation capacity of
the potential for deviation from expected trends. A mid to late- photosynthesis: a cautionary tale. Plant Cell Environ 42:2472–2481.
season measurement of photosynthesis could lead to a dramatic Choat B, Ball MC, Luly JG, Donnelly CF, Holtum JAM (2006) Seasonal
patterns of leaf gas exchange and water relations in dry rain forest
over- or under-estimation of V c,max.25 or modeled A, resulting in trees of contrasting leaf phenology. Tree Physiol 26:657–664.
significant impacts in subsequent ecosystem modeling. Species- Crous KY, Wujeska-Klause A, Jiang MK, Medlyn BE, Ellsworth DS
and environment-specific consideration, alongside consideration (2019) Nitrogen and phosphorus retranslocation of leaves and stem-
of leaf ontogeny, is necessary for accurate modeling of seasonal wood in a mature Eucalyptus forest exposed to 5 years of elevated
CO2 . Front Plant Sci 10:13.
carbon uptake in deciduous forests.
De Kauwe MG, Lin YS, Wright IJ et al. (2016) A test of the
‘one-point method’ for estimating maximum carboxylation capac-
ity from field-measured, light-saturated photosynthesis. New Phytol
Data and materials availability 210:1130–1144.
The raw data presented in this manuscript are available on- Ellsworth DS (2000) Seasonal CO2 assimilation and stomatal limitations
in a Pinus taeda canopy. Tree Physiol 20:435–445.
line [http://ecosis.org] from the Ecological Spectral Information Field C, Mooney HA (1983) Leaf age and seasonal effects on light,
System (EcoSIS) at: https://doi.org/10.21232/ujBYNxhm. water, and nitrogen use efficiency in a California shrub. Oecologia
56:348–355.
Gamon JA, Serrano L, Surfus JS (1997) The photochemical reflectance
Acknowledgments index: an optical indicator of photosynthetic radiation use effi-
ciency across species, functional types, and nutrient levels. Oecologia
We gratefully acknowledge Duncan Anderson, Sophie Drew, 112:492–501.
Casey Hamilton, Benjamin Miller and Ivanellis Rodriguez-Torres Grassi G, Vicinelli E, Ponti F, Cantoni L, Magnani F (2005) Seasonal
for assistance with data collection. and interannual variability of photosynthetic capacity in relation to leaf
nitrogen in a deciduous forest plantation in northern Italy. Tree Physiol
25:349–360.
Conflict of interest Greenwood MS, Ward MH, Day ME, Adams SL, Bond BJ (2008) Age-
related trends in red spruce foliar plasticity in relation to declining
None declared. productivity. Tree Physiol 28:225–232.
Tree Physiology Online at http://www.treephys.oxfordjournals.org1424 Burnett et al.
Hikosaka K, Nabeshima E, Hiura T (2007) Seasonal changes in the Richardson AD, Duigan SP, Berlyn GP (2002) An evaluation of
temperature response of photosynthesis in canopy leaves of Quercus noninvasive methods to estimate foliar chlorophyll content. New Phytol
crispula in a cool-temperate forest. Tree Physiol 27:1035–1041. 153:185–194.
Jach ME, Ceulemans R (2000) Effects of season, needle age and Rogers A, Serbin SP, Ely KS, Sloan VL, Wullschleger SD (2017)
elevated atmospheric CO2 on photosynthesis in scots pine (Pinus Terrestrial biosphere models underestimate photosynthetic capacity
sylvestris). Tree Physiol 20:145–157. and CO2 assimilation in the Arctic. New Phytol 216:1090–1103.
Jiang C, Ryu Y, Wang H, Keenan T (2020) An optimality-based model Serbin SP, Singh A, McNeil BE, Kingdon CC, Townsend PA (2014)
explains seasonal variation in C3 plant photosynthetic capacity. Glob Spectroscopic determination of leaf morphological and biochemical
Chang Biol 26:6493–6510. traits for northern temperate and boreal tree species. Ecol Appl
Kamoske A, Dahlin K, Serbin S, Stark S (2020) Leaf traits and 24:1651–1669.
canopy structure together explain canopy functional diversity: an Smith NG, Keenan TF, Colin Prentice I et al. (2019) Global pho-
airborne remote sensing approach. Ecol Appl. 31:e02230. doi: tosynthetic capacity is optimized to the environment. Ecol Lett
10.1002/eap.2230. 22:506–517.
Kattge J, Knorr W, Raddatz T, Wirth C (2009) Quantifying photosyn- USDA (2019) Fire Effects Information System. (Last accessed date
Downloaded from https://academic.oup.com/treephys/article/41/8/1413/6145907 by guest on 28 October 2021
thetic capacity and its relationship to leaf nitrogen content for global- August 2020). https://www.feis-crs.org/feis/
scale terrestrial biosphere models. Glob Chang Biol 15:976–991. Wang Q, Iio A, Kakubari Y (2008) Broadband simple ratio closely traced
Knauer J, El-Madany T, Zaehle S, Migliavacca M (2018) Bigleaf - an R seasonal trajectory of canopy photosynthetic capacity. Geophys Res
package for the calculation of physical and physiological ecosystem Lett 35:1–5.
properties from eddy covariance data. PLoS One 13:e0201114. doi: Wilson KB, Baldocchi DD, Hanson PJ (2000) Spatial and seasonal
10.1371/journal.pone.0201114. variability of photosynthetic parameters and their relationship to leaf
Kosugi Y, Matsuo N (2006) Seasonal fluctuations and temperature nitrogen in a deciduous forest. Tree Physiol 20:565–578.
dependence of leaf gas exchange parameters of co-occurring ever- Wilson KB, Baldocchi DD, Hanson PJ (2001) Leaf age affects the sea-
green and deciduous trees in a temperate broad-leaved forest. Tree sonal pattern of photosynthetic capacity and net ecosystem exchange
Physiol 26:1173–1184. of carbon in a deciduous forest. Plant Cell Environ 24:571–583.
Koven CD, Knox RG, Fisher RA et al. (2020) Benchmarking and Wright IJ, Leishman MR, Read C, Westoby M (2006) Gradients of light
parameter sensitivity of physiological and vegetation dynamics using availability and leaf traits with leaf age and canopy position in 28
the functionally assembled terrestrial ecosystem simulator (FATES) at Australian shrubs and trees. Funct Plant Biol 33:407–419.
Barro Colorado Island, Panama. Biogeosciences 17:3017–3044. Wu J, Rogers A, Albert LP, Ely K, Prohaska N, Wolfe BT, Oliveira
Lin YS, Medlyn BE, Duursma RA et al. (2015) Optimal stomatal RC, Saleska SR, Serbin SP (2019) Leaf reflectance spectroscopy
behaviour around the world. Nat Clim Chang 5:459–464. captures variation in carboxylation capacity across species, canopy
Long SP, Bernacchi CJ (2003) Gas exchange measurements, what environment and leaf age in lowland moist tropical forests. New Phytol
can they tell us about the underlying limitations to photosynthesis? 224:663–674.
Procedures and sources of error. J Exp Bot 54:2393–2401. Wu J, Serbin SP, Ely KS et al. (2020) The response of stomatal
Medlyn BE, Duursma RA, Eamus D et al. (2011) Reconciling the optimal conductance to seasonal drought in tropical forests. Glob Chang Biol
and empirical approaches to modelling stomatal conductance. Glob 26:823–839.
Chang Biol 17:2134–2144. Wujeska-Klause A, Crous KY, Ghannoum O, Ellsworth DS (2019) Lower
Meng R, Wu J, Schwager KL, Zhao F, Dennison PE, Cook BD, Brewster photorespiration in elevated CO2 reduces leaf N concentrations in
K, Green TM, Serbin SP (2017) Using high spatial resolution satellite mature Eucalyptus trees in the field. Glob Chang Biol 25:1282–1295.
imagery to map forest burn severity across spatial scales in a pine Xu L, Baldocchi DD (2003) Seasonal trends in photosynthetic param-
barrens ecosystem. Remote Sens Environ 191:95–109. eters and stomatal conductance of blue oak (Quercus douglasii)
Muir CD (2019) Tealeaves: an R package for modelling leaf temperature under prolonged summer drought and high temperature. Tree Physiol
using energy budgets. AoB Plants 11:1–10. 23:865–877.
R Development Core Team (2019) R: A language and environment for Yang X, Tang J, Mustard JF, Wu J, Zhao K, Serbin S, Lee JE (2016) Sea-
statistical computing. R Foundation for Statistical Computing, Vienna, sonal variability of multiple leaf traits captured by leaf spectroscopy
Austria. https://www.R-project.org/. at two temperate deciduous forests. Remote Sens Environ 179:1–12.
Tree Physiology Volume 41, 2021You can also read