Pigment Production by the Edible Filamentous Fungus Neurospora Intermedia - MDPI
←
→
Page content transcription
If your browser does not render page correctly, please read the page content below
fermentation

Article
Pigment Production by the Edible Filamentous
Fungus Neurospora Intermedia
Rebecca Gmoser * ID , Jorge A. Ferreira, Magnus Lundin, Mohammad J. Taherzadeh and
Patrik R. Lennartsson
 Swedish Center for Resource Recovery, University of Borås, 50190 Borås, Sweden; jorge.ferreira@hb.se (J.A.F.);
 magnus.lundin@hb.se (M.L.); mohammad.taherzadeh@hb.se (M.J.T.); patrik.lennartsson@hb.se (P.R.L.)
 * Correspondence: rebecca.gmoser@hb.se; Tel.: +46-731-77-84

 Received: 23 January 2018; Accepted: 9 February 2018; Published: 13 February 2018

 Abstract: The production of pigments by edible filamentous fungi is gaining attention as a result
 of the increased interest in natural sources with added functionality in the food, feed, cosmetic,
 pharmaceutical and textile industries. The filamentous fungus Neurospora intermedia, used for
 production of the Indonesian food “oncom”, is one potential source of pigments. The objective
 of the study was to evaluate the fungus’ pigment production. The joint effect from different factors
 (carbon and nitrogen source, ZnCl2 , MgCl2 and MnCl2 ) on pigment production by N. intermedia
 is reported for the first time. The scale-up to 4.5 L bubble column bioreactors was also performed
 to investigate the effect of pH and aeration. Pigment production of the fungus was successfully
 manipulated by varying several factors. The results showed that the formation of pigments was
 strongly influenced by light, carbon, pH, the co-factor Zn2+ and first- to fourth-order interactions
 between factors. The highest pigmentation (1.19 ± 0.08 mg carotenoids/g dry weight biomass) was
 achieved in a bubble column reactor. This study provides important insights into pigmentation of
 this biotechnologically important fungus and lays a foundation for future utilizations of N. intermedia
 for pigment production.

 Keywords: pigments; neurospora intermedia; carotenoids; edible filamentous fungi; ascomycetes

1. Introduction
     Pigments used in the food, feed and cosmetic industries are obtained via synthetic or natural
routes [1]. The first synthetic pigment “mauve” (aniline purple), by William Henry Perkin in 1856,
marked the beginning of the modern color industry. This led to the replacement of natural pigments
by synthetic ones mainly due to their lower cost, higher stability, and ease of large-scale production
possibilities [2]. However, the consumers’ increasing interest in human safety and environmental
conservation has led to the request for natural sources of pigments. Natural-origin pigments are used
extensively in animal feed to improve the nutritional profile and as a colorant to enhance appearance.
For instance, the color of poultry skin, salmon meat and shade of egg yolks is largely determined by
the animal’s diet. The pigments have potential antioxidant [3] and antitumor properties, which can
add functionality to the products [4]. For example, the carotenoid pigment group has antioxidant and
provitamin A activity [5].
     New potential sources of natural pigments are thus highly desired. Plants have so far been
the predominant source of natural pigments, but their use is limited by the irregularity of harvests,
land use regulations and their labor-intensive character [6,7].
     Pigments from plants as well as fruits also compete for the same cropland and are considered to
compete with food production. Pigments can also be produced by some filamentous fungi, which are
gaining interest as a promising fermentation-derived natural pigment alternative [8,9]. In the food

Fermentation 2018, 4, 11; doi:10.3390/fermentation4010011                   www.mdpi.com/journal/fermentation
Fermentation 2018, 4, 11                                                                             2 of 15

and feed industry, there is a special focus on edible filamentous fungi. One such fungi is Neurospora
intermedia, which is able to produce yellow-to-orange carotenoids. N. intermedia is used to produce the
Indonesian traditional dish “oncom merah”, which could make it easier to overcome any regulatory
obstacles of using its pigments since it is already used in food [10,11]. Further advantages include no
detected production of mycotoxins after more than two centuries of research and an ability to grow
rapidly on various types of substrates [12]. The biomass produced by N. intermedia is rich in essential
amino acids, omega-3 and -6 fatty acids and can easily be separated from the fermentation broth [13];
thus, the fungal biomass is a good potential source of high-quality nutrients for animal or fish feed
application. Therefore, the extra pigment produced will increase the value of the feed without adding
any additional work. In all, N. intermedia poses great potential for industrial applications. However,
research using N. intermedia for pigment production is scarce in the literature [14], with only a few
studies on pigment production [1,8]. Understanding the factors that regulate pigment biosynthesis in
N. intermedia is a critical step toward controlling their carotenoid biosynthesis. Several factors, such as
oxidative stress, aeration, light, pH, nitrogen and carbon source, are reported to influence pigment
production in ascomycetes [15]. In this context, this study presents the influence of carbon and nitrogen
sources and trace metals on pigment production by N. intermedia. Insights on the influence of the
supplied air and pH were also investigated in a bench-scale bubble column bioreactor.
     This work aimed to increase the understanding of the multiple-effect factors influencing the pigment
production by N. intermedia to further the utilization of the fungus in biotechnological applications.

2. Materials and Methods

2.1. Fungal Strain
     The edible filamentous ascomycete Neurospora intermedia CBS 131.92 (Centraalbureau voor
Schimmelcultures, Westerdijk Fungal Biodiversity Institute, Utrecht, The Netherlands), was used
in the current study. The fungus was kept on potato dextrose agar (PDA) containing (g/L): D-glucose
20, agar 15 and potato extract 4. The prepared PDA plates were inoculated and incubated aerobically
for 3–5 days at 30 ◦ C followed by storage at 4 ◦ C. Spore solutions for inoculation were prepared by
flooding each plate with 20 mL sterile distilled water and releasing the spores by agitation with a
disposable plastic spreader. All liquid cultures were inoculated with 10 mL/L of spore solution with a
spore concentration of 6.5 (±0.4) × 105 spores/mL.

2.2. Submerged Cultivation in Shake-Flasks
     The synthetic medium contained per liter: 0.95 g MgCl2 (9.98 mM), 3.5 g KH2 PO4 (25.7 mM), 1.0 g
CaCl2 ·2H2 O (6.8 mM), and different carbon (100 mM) and nitrogen sources (4 mM) were used as the
basal screening medium for the pigment production. Furthermore, each flask was supplemented with
20 mL/L trace metal solution [16]. Two carbon sources were investigated for their effect on pigment
production, namely, glucose and mannose. Temperature of 35 ◦ C was used for all the screening
cultures, the nitrogen source was either NaNO3 or NH4 Cl, and the metal ions added beyond the
standard trace metal solution were 10 mM of ZnCl2 , MgCl2 and MnCl2 .
     All fungal cultures were carried out aerobically in cotton plugged 100 mL Erlenmeyer flasks (flask
diameter of 85 mm) containing 50 mL of medium autoclaved at 121 ◦ C for 20 min. The carbon/nitrogen
and salt solutions were autoclaved separately. A water bath (Grant OLS-Aqua pro, Cambridge, UK)
was used to maintain the temperature with orbital shaking at 125 rpm (radius of 9 mm) for 6 days under
blue light with a peak wavelength centered around 450 < λ < 500 nm, emitting 70 lux. The initial pH of
the medium was adjusted to 5.5 with 2 M NaOH. Samples (1.5 mL) were taken from the fermentation
broth at time 0 and at the end of cultivation, and centrifuged at 1207× g for 10 min. The supernatant
was separated and kept at −20 ◦ C until analysis in HPLC.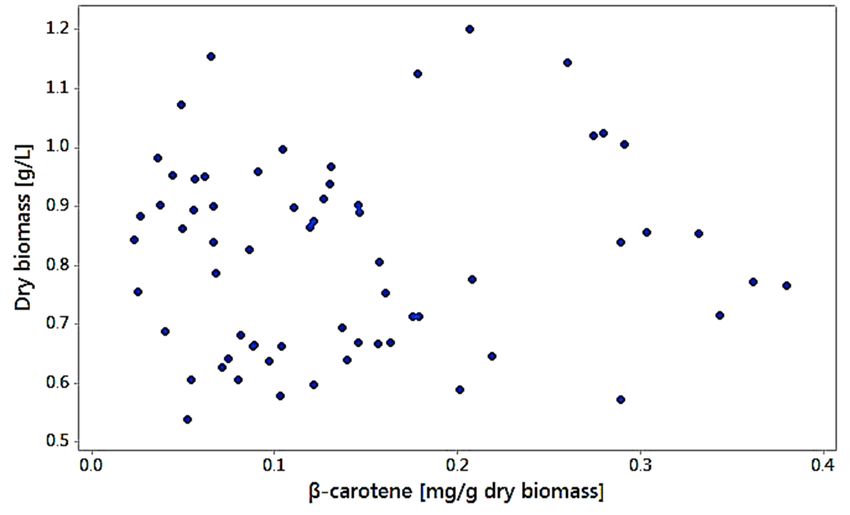
Fermentation 2018, 4, 11                                                                                        3 of 15

     A full 25 factorial experiment with two replicates was designed. The selection of factors and
levels of these factors were based on a preliminary screening experiment performed by a 26−2 reduced
factorial experiment (data not shown). Five factors were selected for further investigation, namely,
carbon and nitrogen sources, MgCl2 , MnCl2 and ZnCl2 (Table 1).

                    Table 1. Factors and level of factors included in the full factorial experiment.

   Carbon Source (100 mM)          Nitrogen Source (4 mM)         ZnCl2 (mM)        MgCl2 (mM)         MnCl2 (mM)
            Glucose                  Ammonium chloride                  10               10                10
            Mannose                    Sodium nitrate                   0                 0                0

     The full factorial design was chosen to investigate combinations of carbon sources, nitrogen
sources and trace metals, using all treatment combinations to obtain main effects and all possible
interaction effects between factors for pigment production. All the data obtained were analyzed
using a General Linear Model ANOVA (analysis of variance). Factors were considered significant
at a p-value less than 0.01 and the effects of treatment combinations were analyzed using Tukey
multiple comparison test. Statistical analysis of the data was performed using the software package
MINITAB® 17 (Minitab Inc., State College, PA, USA). The experimental design resulted in sixteen
different combinations for each carbon source with one replication of samples (Table 2).

      Table 2. Combination of factors and levels of factors used in the full factorial experiment in shake-flasks
      for each carbon source (100 mM).

                       Nitrogen Source (4 mM)       Zn2+ (mM)       Mn2+ (mM)       Mg2+ (mM)
                                NH4 +                    10               0              10
                                NO3 −                    10               0              10
                                NH4 +                    10              10              10
                                NH4 +                    0                0              10
                                NH4 +                    10              10               0
                                NO3 −                    10              10               0
                                NO3 −                    0               10              10
                                NH4 +                    0               10              10
                                NO3 −                    10              10              10
                                NO3 −                    0               10               0
                                NH4 +                    0                0               0
                                NO3 −                    0                0               0
                                NO3 −                    10               0               0
                                NO3 −                    0                0              10
                                NH4 +                    0               10               0
                                NH4 +                    10               0               0

2.3. Bubble Column Bioreactor
     Fungal cultivations were carried out in 4.5 L bench scale airlift bioreactors operated as
bubble column bioreactors (Belach Bioteknik, Stockholm, Sweden) with a working volume of
3.5 L. The bioreactor was made of transparent borosilicate glass. Aeration at the rate 0.5 vvm
(volumeair/volumemedia/min) was maintained throughout the cultivation, unless otherwise
specified, using a sintered stainless-steel air sparger with a pore size of 0.2 µm. Inlet air was filtered
by passing it through a 0.1 µm pore size PTFE membrane filter (Whatman, Florham Park, NJ, USA).
The same synthetic medium composition and conditions as in the shake-flasks were used, with all ions
added to every combination.
Fermentation 2018, 4, 11 4 of 15
To examine the effect of pH on pigment production, the medium was adjusted during the
cultivation to pH 3.5 ± 0.05 and 5.5 ± 0.05 with 2 M HCl, 2 M NaOH or 10 M NaOH. The combinations
were either glucose (100 mM) and sodium nitrate (4 mM) at pH 3.5 and 5.5, or mannose (100 mM) and
ammonium chloride (4 mM) at pH 3.5 and 5.5. The combination of carbon and nitrogen sources chosen
was based on results from the full factorial experiment that gave the highest pigmentation response.
The influence of different aeration rates was also tested, namely, 0.17, 0.5 or 1.3 vvm, while other
parameters remained constant. The cultivation medium was based on glucose (100 mM), sodium
nitrate (4 mM) and the trace metals Zn2+ , Mn2+ and Mg2+ (10 mM). The pH was maintained at
5.5 ± 0.05 by addition of 2 M HCl and 2 M NaOH.
2.4. Extraction and Estimation of Neurospora Intermedia Orange Pigment
At the end of the fermentation, the wet biomass from each shake flask, or from the bioreactor, was
harvested by pouring the cultivation medium through a 1 mm2 pore area fine mesh and washed with
distilled water. Extraction of pigments was carried out according to Singgih, Andriatna, Damayanti and
Priatni [8] with some modifications. The washed biomass (50 mg) was then extracted with 3 mL of 99%
ethanol through sonication for 10 min, followed by centrifugation at 1200× g for 5 min. The supernatant
was separated and the biomass was re-extracted with 99% ethyl acetate, centrifuged once more and then
the supernatant was added to the first extraction solution. The extracted pigments in the ethanol/ethyl
acetate solution were analysed spectrophotometrically (Biochrom Ltd., Cambridge, England) at the
maximum absorption of 466 nm and the concentration was determined using a calibration curve for
β-carotene dissolved in the same solution. After extraction, the biomass was dried at 70 ◦ C for 24 h.
2.5. Analytical Methods
A Bürker’s counting chamber (with a depth of 0.1 mm) was used to determine the spore
concentration used for inoculation. The spore solution was diluted ten times after which the
spores were counted in 144 E-squares (1/125 µL) under a light microscope (Carl Zeiss Axiostar plus,
Oberkochen, Germany), followed by calculation of the final concentration of spores in the solution.
High-performance liquid chromatography (HPLC) (Waters 2695, Waters Corporation, Milford, DE,
USA) was used to identify and quantify different components in the liquid fractions. An analytic
ion-exchange column based on hydrogen ions (Aminex HPX-87H, Bio-Rad Hercules, Berkeley, CA,
USA) operated at 60 ◦ C with a Micro-Guard cation-H guard column (Bio-Rad) and 0.6 mL/min 5 mM
H2 SO4 as eluent, was used for the analyses of mannose, glucose and ethanol. A UV absorbance
detector (Waters 2487), operating at 210 nm wavelength, was used in series with a refractive index (RI)
detector (Waters 2414).
Thin-Layer Chromatography
Crude carotenoid pigment from N. intermedia was loaded onto a silica gel plate (silica gel size:
0.063–0.2 mm. Merck, Damstardt, Germany). The mobile phase was 95:5 n-heptane:ethyl acetate.
After running the mobile phase up, the plate was dried with hot air and irradiated with UV-light at
365 nm. After separation of the different compounds based on its polarity, individual compounds
appeared as vertically separated spots. Each spot had a retention factor (Rf) which is equal to the
distance migrated over the total distance covered by the solvent. The results were compared with
β-carotene standard.
3. Results
Novel, safe sources of natural pigments with added functionality are highly sought after in a
variety of industries, such as feed and food. In this work, the effect of different factors’ ability to
promote pigment production by the filamentous fungi N. intermedia was studied. Factors were carefully
chosen based on preliminary studies and findings. Five factors, namely, carbon source (glucose and
mannose), nitrogen source (NaNO3 or NH4 Cl) and trace metals (Mg2+ , Mn2+ and Zn2+ ) were shownFermentation 2018, 4, 11 5 of 15
Fermentation 2018, 4, x 5 of 15
to be particularly important regarding pigment production (Table 1). A full factorial experiment
was conducted
production. Thetoresults
investigate their effect in
are summarized onTable
pigment production.
3 and The main
Figure 1. Scaling independent
up to a bench-scalevariables
bubble
that showed a significant effect were carbon source and 2+
Zn increased
(negative aeration
effect). In(Figures
addition3 toand
main
column bioreactor revealed that low pH (Figure 2) and 4)
effects, up to four-way interactions
significantly favored pigment production. between factors were shown to influence pigment production.
The results are summarized in Table 3 and Figure 1. Scaling up to a bench-scale bubble column
bioreactor revealed
Table 3. that low of
ANOVA-analysis pH (Figurewith
variances 2) and increased
General Linear aeration (Figures 3 the
Model, summarizing andfactors
4) significantly
with a
favored pigmenteffect
significant production.
and interaction effect between factors on pigmentation, as well as the model
summary. Factors were considered significant at p < 0.01, × refer to multiplication of two factors.
Table 3. ANOVA-analysis of variances with General Linear Model, summarizing the factors with a
Term T-Value p-Value
significant effect and interaction effect between factors on pigmentation, as well as the model summary.
Factors were considered significant Constant 34.61
at p < 0.01, × refer to multiplication of0.000
two factors.
Carbon 8.47 0.000
Nitrogen
Term 2.99
T-Value 0.005
p-Value
Zn
Constant −6.39
34.61 0.000
0.000
Carbon× Mg
Carbon 4.47
8.47 0.000
0.000
Nitrogen× Zn
Nitrogen 2.99
12.75 0.005
0.000
Zn × Mg
Nitrogen −6.39
7.27 0.000
0.000
Carbon × Mg 4.47 0.000
Zn × Mg 4.22 0.000
Nitrogen × Zn 12.75 0.000
Nitrogen××Mg
Mn Mg 3.13
7.27 0.004
0.000
CarbonZn× ×
Nitrogen
Mg × Zn 6.27
4.22 0.000
0.000
Mn × Mg
Carbon × Nitrogen × Zn × Mn 3.13
3.01 0.004
0.005
Carbon × Nitrogen × Zn 6.27 0.000
Carbon××Nitrogen
Carbon Nitrogen
××ZnZn
× ×Mn
Mg 4.37
3.01 0.000
0.005
Carbon × Nitrogen
S × Zn × Mg 4.37
R-sq 0.000
R-sq(adj)
S
0.0322918 R-sq
93.86% R-sq(adj)
87.92%
0.0322918 93.86% 87.92%
Figure 1. Based
Figure 1. Based onon aa Pareto
Pareto chart
chart of
of the
the significant
significant (p(pFermentation 2018, 4, x 6 of 15
Fermentation 2018,2018,
Fermentation 4, x 4, 11 6 of 156 of 15
1.4
1.4
biomass1.2 Glucose pH 5.5 NO3
1.2 Glucose
GlucosepH 5.5 NO3
pH3.5 NO3
β-carotene/gbiomass
Glucose pH3.5 NO3
Mannose pH 5.5 NH4
1.0
1.0 Mannose
MannosepHpH5.5
3.5NH4
NH4
Mannose pH 3.5 NH4
0.8
β-carotene/g
0.8
0.6
0.6
0.4
0.4
mg
mg
0.2
0.2
0.0
0.0 24 36 48 60 72 84 96
24 36 48 60 72 84 96
Time [h]
Time [h]
Figure 2. Effect of pH 3.5 (round dotted line) and 5.5 (solid line) using either mannose and ammonium
Figure
Figure 2. Effect
2. Effect of pH
of pH 3.53.5 (round dottedline)
(round line) and 5.5
5.5 (solid
(solid line) using either mannose andand
ammonium
chloride (marked with squares)dotted
or glucoseand and sodium line) using
nitrate either
(marked mannose
with circles) ammonium
on pigment
chloride
chloride (marked with squares) or glucose and sodium nitrate (marked with circles) on pigment
production over time in a bubble column bioreactor. The results were expressed as thepigment
(marked with squares) or glucose and sodium nitrate (marked with circles) on mean ±
production over time in a bubble column bioreactor. The results were expressed as the mean ±
production
standard over time in a bubble column bioreactor. The results were expressed as the mean ±
deviation.
standard deviation.
standard deviation.
1.4
1.4
biomass
1.2
biomass
1.2
1.0
drydry
1.0
beta-carotene/g
0.8
beta-carotene/g
0.8 0.17vvm
0.17vvm
0.6 0.5vvm
0.6 0.5vvm
1.3vvm
0.4 1.3vvm
0.4
0.2
mgmg
0.2
0.0
0.0 24 36 48 60 72 84 96
24 36 48 60 72 84 96
Time [h]
Time [h]
Figure 3. 3.
Figure Investigating theeffect
Investigating the effect
of of
the the different
different aeration
aeration rates
rates 0.17 0.17 0.5
(square), (square), 0.51.3
(circle) and (circle) and 1.3
(triangle)
Figure
(triangle) vvm on pigmentation over time in bubble column bioreactors. Error bars represent the1.3
vvm3.
onInvestigating
pigmentation the
over effect
time in of the
bubble different
column aeration
bioreactors. rates
Error 0.17
bars (square),
represent the 0.5
SD (circle)
of the and
mean. SD
(triangle) vvm on pigmentation over time in bubble column bioreactors. Error bars represent the SD
of the mean.
of the mean.Fermentation 2018,4,4,11
Fermentation2018, x 7 of 715of 15
(a) 5.0 1.4
4.5
(a) 1.2
[mg β-carotene/g biomass]
4.0
Final biomass [g/L]
Pigment production
3.5 1.0
3.0
0.8
2.5
0.6
2.0
1.5 0.4
1.0
0.2
0.5
0.0 0.0
Glucose NO3 Mannose NH4
Figure 4. Effect of different pH values of 3.5 and 5.5 (a); and three different aeration rates (b) on the
Figure 4. Effect of different pH values of 3.5 and 5.5 (a); and three different aeration rates (b) on the
final biomass (open bars) and pigment production (grey bars) in bubble column bioreactors.
final biomass (open bars) and pigment production (grey bars) in bubble column bioreactors.
A positive correlation between growth as loose aggregated forms (fluffy pellets) of N. intermedia
andAcarotenoid
positive correlation
formation between
appeared,growth as loose
supported aggregated
by previous forms
studies (fluffySince
[17–19]. pellets) N. proven
it isofnot intermedia
and carotenoid
whether formation
morphology appeared,
affects pigment supported
production by previousmorphology
or whether studies [17–19].
changesSince
resultit is notsome
from proven
whether morphology
other factor that alsoaffects
affect pigment production
pigmentation, or whether
more thorough morphology
studies changes result
on the relationship fromthe
between some
other factor that
cultivation also
factors, affect pigmentation,
biosynthesis of pigmentsmore thorough
and mycelial studies onare
morphology theneeded.
relationship between the
cultivation factors, biosynthesis of pigments and mycelial morphology are needed.
3.1. Effect from Factors on Pigmentation from Full Factorial Design
3.1. Effect from Factors on Pigmentation from Full Factorial Design
To increase the production of pigments by the fungus, a variety of factors possibly influencing
pigment production
To increase were combined
the production in a submerged
of pigments fermentation
by the fungus, a varietyofofN.factors
intermedia.
possiblyFactors were
influencing
selectedproduction
pigment based on were the available
combinedliterature for pigment
in a submerged production
fermentation of N.by filamentous
intermedia. Factorsfungiwereand on
selected
preliminary
based screeningliterature
on the available observations. The preliminary
for pigment production screening revealedfungi
by filamentous that blue
and on light had a
preliminary
significant
screening effect underThe
observations. thepreliminary
response pigment production,
screening as further
revealed that explained
blue light by Sandmann
had a significant effect[20].
under
Only intracellular pigments were produced, as shown by the colorless liquid after
the response pigment production, as further explained by Sandmann [20]. Only intracellular pigments removal of the
biomass.
were From as
produced, theshown
different factors
by the studied,
colorless mannose
liquid and sodium
after removal of thenitrate were From
biomass. relatively more
the different
encouraging
factors studied,for pigmentand
mannose production compared
sodium nitrate wereto relatively
glucose and ammonium
more encouragingchloride based onproduction
for pigment the full
factorial analysis. The addition of Zn2+ to the media had a mainly negative effect; however, pigment
compared to glucose and ammonium chloride based on the full factorial analysis. The addition of
production was favored when Zn2+ was combined with glucose. Mannose promoted pigment
Zn2+ to the media had a mainly negative effect; however, pigment production was favored when Zn2+
was combined with glucose. Mannose promoted pigment production in combination with Mg ions.Fermentation 2018, 4, 11 8 of 15
A second-order interaction between the nitrogen source and Mg as well as Zn ions was also found.
Sodium nitrate interacted positively with the ions, while ammonium chloride interacted negatively
on the pigment production. Furthermore, the addition of Mg2+ and Zn2+ together, or not adding
any of them, had a significant positive effect on N. intermedia pigment production. The results also
revealed a fourth-order interaction between the carbon and nitrogen source, Zn2+ and Mg2+ (Figure 1).
For N. intermedia, a complex interaction between factors that promotes higher yields of pigments
appears to take place (Table 3). The outcome of the ANOVA can be visualized in Figure 1 based on a
Pareto chart. Nitrogen and zinc in combination had the highest effect on pigment production, followed
by the carbon source and the combined effect from nitrogen and Mg2+ .
3.2. Effect of Carbon Source
From the experiments in the bioreactor, carotenoid production was observed from the beginning
of hour 33 up to hour 96, with a 15-hour earlier initiation of carotenoid production seen for mannose.
One hypothesis from these results would be that changing the carbon source from glucose to mannose
may repress the central carbon metabolism and increase the acetyl-CoA pool (the most important
precursor for pigment biosynthesis [21]) to pigment biosynthesis rather than cell growth-related
pathways. Genes involved in the potential pathways for acetyl-CoA biosynthesis towards pigment
production are possibly up-regulated in mannose medium.
In general, the presence of glucose leads to the repression of genes encoding for the metabolism
of alternative carbon sources [22,23], but potentially also carotenogenetic enzymes. This phenomenon,
termed catabolic repression, has been widely studied for its regulation of carotenogenesis in the yeast
Xanthophyllomyces dendrorhous [24]. This highly conserved regulatory mechanism is suggested to be
related to the increase in carotenoid production in the presence of mannose rather than glucose. One of
these glucose-repressed genes encodes proteins involved in the responses to various stresses [25].
Catabolic repression may at least partly explain the somewhat longer cultivation time needed in order
to reach the plateau for carotenoid production when cultivating with glucose compared to mannose.
It has been observed that the initiation of carotenogenesis in X. dendrorhous depends on the carbon
source present in the culture medium [26], thus supporting the hypothesis. Nevertheless, it seems that
the effect of different carbon sources on pigment production varies among fungi species, as media
containing glucose have also been widely reported to induce the production of pigments for some
fungi [9]. Moreover, a higher order of interaction between the chosen carbon source and other factors
possibly influence the production of pigments. The complex interplay between factors, as seen in
the full factorial experiment, may result in a positive effect on pigmentation when glucose is used as
the carbon source with one combination of factors, while using mannose gives a positive effect with
another combination. Choosing one carbon source over the other to promote pigment production is,
therefore, not simple.
3.3. Effect of Addition of Trace Metals
In N. intermedia, carotenoid production was predicted to be influenced by the co-factors Mg2+ ,
Mn2+ and Zn2+ ions. Mg2+ was shown to promote pigmentation in combination with mannose and
hinder pigmentation in combination with glucose. The combined effect of Mg2+ and Mn2+ significantly
favored pigment production in N. intermedia. Zn2+ exhibited a negative effect on pigment production
when alone, but the negative effect changed to positive when Zn2+ was combined with sodium nitrate
or was in the presence of Mg2+ .
Related to the effect observed from Mg2+ , a study by Singgih, Andriatna, Damayanti and
Priatni [8] found that the addition of up to 16 mM of Mg2+ resulted in an increase of carotenoids
of N. intermedia. Mg2+ was suggested to act as a co-factor for the enzyme phytoene-synthase (al-2)
converting geranyl-geranyl pyrophosphate to the colorless carotenoid phytoene (Figure 5), which is an
intermediate in the carotenoid biosynthesis. Trace levels of Mg2+ ions, among others, were also reported
to increase the rate of carotenogenesis during the growth of mated Blakeslea trispora [27]. The combinedFermentation 2018, 4, 11 9 of 15
of Mg2+ 2018,
effect Fermentation and4,Mn
x
2+ ions was largely to be expected, since both ions function as cofactors of
9 of 15
carotenogenetic enzymes (Figure 2). For example, the formation of phytoene from precursors requires
some of cofactors, and Mn
carotenogenetic 2+ together
enzymes (Figurewith For2+example,
2). Mg , and ATP the are required
formation for the incorporation
of phytoene from precursors of the
requires
phytoene some cofactors,
precursor and Mn
(MVA) [28]. Sincetogether
2+ 2
Mn + onlywith Mg 2+, and ATP are required for the incorporation of
increased pigment production in combination with
Mg2+ ,the phytoene precursor (MVA) [28]. Since
that Mn
2+ only increased pigment production in combination
manganese-dependent enzymes regulate the flux in carotenoid production possibly also
with Mg2+ 2+, manganese-dependent enzymes that regulate the flux in carotenoid production possibly
require Mg . Furthermore, the effect of manganese on carotenoid production has been reported to be
also require Mg2+. Furthermore, the effect of manganese on carotenoid production has been reported
concentration-dependent, acting as a scavenger [29].
to be concentration-dependent, acting as a scavenger [29].
Figure 5. Cont.Fermentation 2018, 4, 11 10 of 15
Fermentation 2018, 4, x 10 of 15
Overview of
Figure 5. Overview
Figure of the
the carotenoid
carotenoid biosynthesis
biosynthesis covering
covering the
the most
most important
important steps
steps regarding
regarding
regulation, with
regulation, withco-factors
co-factorsneeded
neededmentioned in italics
mentioned [15,30–32]
in italics (the purple
[15,30–32] (the areas
purpleshow the show
areas functional
the
group –thegroup
functional active–the
sites– in thesites–
active molecules).
in the molecules).
Even
Even though
thoughZn
2+ had a negative effect on pigment production, its combinatory effect with other
Zn2+ had a negative effect on pigment production, its combinatory effect with
factors had a significantly more positive
other factors had a significantly effect compared
more positive with the
effect compared negative
with effect of
the negative Zn ions
effect of Znalone.
ions
This is probably related to microorganism metabolism. The combinatory effect of zinc
alone. This is probably related to microorganism metabolism. The combinatory effect of zinc and and the carbon
source has previously
the carbon source hasbeen demonstrated
previously in M. purpureus,
been demonstrated in purpureus,
in M. which zincinwas involved
which in regulatory
zinc was involved
processes integrating carbohydrate metabolism [33]. These data also indicate that
in regulatory processes integrating carbohydrate metabolism [33]. These data also indicate that zinc affects
zinc
carbohydrate
affects carbohydrate utilization by N. intermedia. However, Zn ions have not been reported to play as
utilization by N. intermedia. However, Zn ions have not been reported to play as
important
important aa role
role as
as cofactors
cofactors for
for carotenogenic enzymes.
carotenogenic enzymes.Fermentation 2018, 4, 11 11 of 15
3.4. Effect of Nitrogen Source vs. pH
3.4.1. Nitrogen Source
The effects of using nitrate or ammonium as the sole nitrogen source were compared in the full
factorial experiment. Nitrate had a positive effect on pigment accumulation (p = 0.005). This effect was
enhanced in the presence of Zn2+ (p < 0.001). However, from the scale-up experiments, there was no
obvious pattern in pigment production by varying nitrogen sources.
The addition of nitrate [34] or ammonium [35] has previously been reported to promote pigment
production in Monascus species. The pH was not controlled in these studies, suggesting that the
nitrogen source may have an indirect effect on pigment production by changing the pH of the medium.
Nevertheless, the nitrogen source may still have an effect in other cultivation conditions such as very
limited aeration or nitrogen concentrations. Previous screening trials with N. intermedia revealed that a
high C/N ratio clearly promoted pigment formation, which coincide with previous studies [36,37].
3.4.2. Effect of pH
During the shake-flask cultivations, the final pH values of the different media differed when the
source of nitrogen was ammonium chloride, during which the pH fell to a lower final level compared
to media supplemented with nitrate. Since ammonia causes acidification of the medium [38], it was
proposed that the change of the pH had a higher effect than the presence of different nitrogen itself.
Therefore, a scale-up of the fungal fermentation in a bubble column bioreactor was performed to
enable the constant control the pH as well as to investigate the scaling-up potential of the pigment
production process. The pH values tested for each combination were 3.5 and 5.5 for mannose together
with ammonium chloride and glucose together with sodium nitrate. The results, in Figure 2, show that
the pH has a substantial effect on pigmentation. A clearly positive relationship between a pH of 3.5
and pigment production was observed (Figure 2), irrespective of the nitrogen source chosen.
Low pH levels have previously been reported to positively influence pigmentation in other
fungi [19,39,40]. The above results indicate that a relatively low pH seems to be a crucial factor for
carotenoid production by N. intermedia. It is conceivable that improving carotenoid production by
decreasing the pH induces mechanisms probably related to a defense response such as oxidative stress
in the fungal cells [41].
The effect of pH has been associated with changes in the activities of proteins [19]. The pH of the
medium possibly had a secondary effect on the regulation of enzymatic processes inside the fungal
cell, favoring enzymes involved in carotenogenesis.
The level of hydrogen ions affect the oxidation/reduction process of the molecules in the cell that
in turn regulates the oxidative state and redox fluxes of important energy molecules. The different
environment in the cell leads to changed metabolic flows and diverse mechanisms of osmotic, oxidative
and metabolic regulation and resulting in diverse products such as pigments [19]. Since pigments
can help to regulate damage at the membrane level, the production can therefore be affected by this
change. These activities have been reported for the Monascus species, where hydrolytic enzymes that
induce morphological changes in the cell wall resulted in an overproduction of pigments [42].
3.5. Aeration
The effect of the aeration rate on the production of pigments by N. intermedia was also studied
in bubble column bioreactors. Three different aeration rates were used for the experiment as the sole
variable. The supplied air played a crucial role in pigment production (Figure 3). Higher aeration
resulted in more pigment accumulation in the biomass (1.19 ± 0.08 mg β-carotene and 1.09 ± 0.16 mg
β-carotene/g dry biomass at 1.3 and 0.5 vvm, respectively, compared to 0.17 vvm (0.09 ± 0.02 mg
β-carotene/g dry biomass)). However, the clearest difference between the aeration rates is that an
increased aeration led to an earlier initiation of pigment accumulation in the biomass. At the highest
aeration rate, N. intermedia also consumed the carbon source faster. Pigment production was initiatedFermentation 2018,
Fermentation 2018, 4,
4, x11 12 of
12 of 15
15
when the carbon source concentration had decreased to approximately 9–11 g/L for all experiments
when
in the the carbon source concentration had decreased to approximately 9–11 g/L for all experiments in
bioreactors.
the bioreactors.
Similar results have previously been reported for other fungi. For example, increased pigment
Similar by
production results have previously
M. ruber was obtained beenbyreported for other
cultivating fungi. agitation
at higher For example, increased
speeds pigment
[43]. Similarly,
production by M. ruber
maximum carotene was obtained
production by cultivating
was obtained by B.attrispora
higheratagitation speeds [43].
higher dissolved Similarly,
oxygen maximum
concentrations
carotene
(from 50% production
to 90%) [18]. wasTheobtained by B. trispora
production at higherisdissolved
of carotenoids assumed oxygen concentrations
to be stimulated when(from 50%
oxidative
to 90%)occurs
stress [18]. The production
to lower of carotenoids
the concentration of is assumed
reactive to be species
oxygen stimulated when
(ROS). In oxidative
this study, stress occurs
the largest
to lower
effect was theseen
concentration
in the increase of reactive
from 0.17oxygen
to 0.5species
vvm, (ROS). In this
while the study,
change the0.5
from largest
to 1.3effect
vvmwas hadseen
onlyina
the
minorincrease
impact from 0.17 to 0.5production.
on pigment vvm, whileAthe change explanation
potential from 0.5 to 1.3 vvmthe
is that hadincrease
only a minor impact
in aeration on
from
pigment
0.17 to 0.5production.
resulted inAenough potential explanation
oxygen for the is that to
fungi thestart
increase in aeration
producing from 0.17
pigments. to 0.5
Further resulted
increasing
in
theenough
aeration oxygen
rate tofor 1.3thevvmfungi
onlyto sped
start up
producing pigments.
the reactions Further
to some extentincreasing
since thethe aeration
fungi alreadyrate to
had
1.3 vvm oxygen
enough only sped forupanthe reactions
initial to some extent
stress response since the
and pigment fungi already had enough oxygen for an
biosynthesis.
initial stress response and pigment biosynthesis.
3.6. Biomass Production Related to Carotenoid Production
3.6. Biomass Production Related to Carotenoid Production
Fungi grown under stress are commonly less efficient in the conversion of substrates into
Fungibiomass,
microbial grown under causingstress are commonly
a failure less efficient
of the culture in the
to reach theconversion of substrates
maximal production ofinto microbial
biomass and
biomass, causing a failure of the culture to reach the maximal production
ultimately a lack of an association between microbial growth and pigment production. A negative of biomass and ultimately
arelationship
lack of an association
between growth betweenand microbial
pigmentgrowth and pigment
production production.
was thus expected,A negative relationship
as acetyl-CoA was
between growth and pigment production was thus expected, as acetyl-CoA
hypothesized to be effectively converted to biomass instead of pigment formation under favorable was hypothesized to be
effectively converted to biomass instead of pigment formation under
conditions (Figure 4), consistent with previous studies [18,19,44]. However, a high pigment favorable conditions (Figure 4),
consistent
productionwith wasprevious
shown tostudies [18,19,44].
not necessarily However,
result in lowaamount
high pigment
of biomassproduction was shown
when cultivated in to not
shake
necessarily result in low amount of biomass when cultivated in shake flasks, as
flasks, as seen in the scatterplot (Figure 6). The scatterplot shows a clear relationship between pigment seen in the scatterplot
(Figure 6). Theproduced
and biomass scatterplot asshows a clearare
the values relationship
randomlybetweenspread in pigment and biomass
the figure. produced
Nevertheless, whenas the
the
values are randomly
experiments were scaled spread
up toin bubble
the figure.
columnNevertheless,
bioreactors, when the experiments
a higher were scaled
biomass production up to
coincided
bubble
with morecolumn bioreactors,
pigments per g of a higher biomass
dry biomass atproduction
pH 3.5, andcoincided
the high with morerates
aeration pigments
(0.5 andper1.3g of dry
vvm)
biomass at pH 3.5,
were obtained and 3).
(Figure the high aeration rates (0.5 and 1.3 vvm) were obtained (Figure 3).
Figure 6.
Figure 6. Relation
Relation between
between dry
dry biomass
biomass and
and pigment
pigment production
production showed
showed no
no clear
clear correlation
correlation towards
towards
correlation between
a negative correlation between high
high biomass
biomass production
production and
and pigmentation.
pigmentation.
The results from the shake-flask experiments suggested that the combined effect of factors
The results from the shake-flask experiments suggested that the combined effect of factors
impacting observed pigment and biomass production can vary significantly with a change of nutrient
impacting observed pigment and biomass production can vary significantly with a change of nutrient
level or growth conditions, which might explain the different results obtained from the shake-flasks
level or growth conditions, which might explain the different results obtained from the shake-flasks and
and the bubble column bioreactor. Cellular growth was not inhibited as a result of low pH, and a
the bubble column bioreactor. Cellular growth was not inhibited as a result of low pH, and a positive
positive relationship between biomass concentration and pigment production in bench-scale
relationship between biomass concentration and pigment production in bench-scale bioreactors was
bioreactors was observed. The final harvested biomass from the bubble column bioreactors was
slightly higher for the cultivations grown at pH 3.5 compared to those grown at pH 5.5, irrespectiveFermentation 2018, 4, 11 13 of 15
observed. The final harvested biomass from the bubble column bioreactors was slightly higher for
the cultivations grown at pH 3.5 compared to those grown at pH 5.5, irrespective of carbon source
(Figure 4a). The high biomass production at pH 3.5 can be explained by the higher carbon consumption
abilities (7.58 ± 0.4 g total carbon source consumed/L and 5.39 ± 0.5 g total carbon source/L at the end
of cultivation for pH 3.5 and 5.5, respectively) at these conditions. Consequently, increased pigment
production could be related to the higher carbon consumption as a faster depletion of the carbon source
gives an earlier stress response to the cells. The maximal biomass concentration was also obtained
with high aeration (Figure 4b), which coincided with high pigment production, demonstrating that the
conditions for the production of biomass are suited for obtaining pigments. Production of biomass did
not increase in relation to pigmentation, as the experiments with 0.5 and 1.3 vvm resulted in similar
amounts of biomass regardless of the differences in pigment production.
4. Conclusions
Pigment production by N. intermedia was found to be significantly influenced by the carbon
source mannose and the addition of the cofactors Mg2+ and Mn2+ favored pigment accumulation.
Pigment production remained unaffected by addition of only Zn2+ , but Zn2+ seemed to play a role in
combination with carbon, nitrogen and Mg2+ . When scaling up the process in a bioreactor, the growth
and pigment production differed depending on the cultivation conditions. High aeration and low
pH seemed to favor both biomass and pigment production. The production of pigments seems to
imply a stronger effect caused more by low pH and high aeration than the nitrogen and carbon source
added, and it is likely that other cultural and environmental factors combine to activate mechanisms
related to metabolic controls and defense mechanisms. The results point towards the potential of using
N. intermedia as a novel source of pigment, which may be of interest to the food and feed industry.
Acknowledgments: The authors would like to thank the Lantmännen Research Foundation and the University of
Borås for financial support.
Author Contributions: Rebecca Gmoser, Jorge A. Ferreira, Patrik R. Lennartsson and Mohammad J. Taherzadeh
conceived the idea and the structure of the manuscript, Rebecca Gmoser wrote the majority of the paper and
performed all the experiments with support from Jorge A. Ferreira and Magnus Lundin who helped with statistical
integration. Jorge A. Ferreira, Patrik R. Lennartsson and Mohammad J. Taherzadeh revised the manuscript and
contributed with valuable discussions. All authors read and approved the final manuscript.
Conflicts of Interest: The authors declare no conflict of interest.
References
1. Gusdinar, T.; Singgih, M.; Priatni, S.; Sukmawati, A.; Suciati, T. Enkapsulasi dan stabilitas pigmen karotenoid
dari Neurospora intermedia n-1 (encapsulation and the stability of carotenoids from Neurospora intermedia n-1).
J. Mns. Lingkung. 2014, 18, 206–211.
2. Holme, I. Sir william henry perkin: A review of his life, work and legacy. Coloration Technol. 2006, 122,
235–251. [CrossRef]
3. Yoo, A.Y.; Alnaeeli, M.; Park, J.K. Production control and characterization of antibacterial carotenoids from
the yeast Rhodotorula mucilaginosa ay-01. Process Biochem. 2016, 51, 463–473. [CrossRef]
4. Torres, F.A.E.; Zaccarim, B.R.; de Lencastre Novaes, L.C.; Jozala, A.F.; Dos Santos, C.A.; Teixeira, M.F.S.;
Santos-Ebinuma, V.C. Natural colorants from filamentous fungi. Appl. Microbiol. Biotechnol. 2016, 100,
2511–2521. [CrossRef] [PubMed]
5. Saini, R.K.; Nile, S.H.; Park, S.W. Carotenoids from fruits and vegetables: Chemistry, analysis, occurrence,
bioavailability and biological activities. Food Res. Int. 2015, 76, 735–750. [CrossRef] [PubMed]
6. Hernández-Almanza, A.; Montanez, J.C.; Aguilar-González, M.A.; Martínez-Ávila, C.; Rodríguez-Herrera, R.;
Aguilar, C.N. Rhodotorula glutinis as source of pigments and metabolites for food industry. Food Biosci. 2014,
5, 64–72. [CrossRef]
7. McNeil, B.; Archer, D.; Giavasis, I.; Harvey, L. Microbial Production of Food Ingredients, Enzymes and
Nutraceuticals; Elsevier Science: Burlington, MA, USA, 2013.Fermentation 2018, 4, 11 14 of 15
8. Singgih, M.; Andriatna, W.; Damayanti, S.; Priatni, S. Carotenogenesis study of neurospora intermedia n-1 in
liquid substrate fermentation. J. Chem. Pharm. Res. 2015, 7, 842–847.
9. Da Costa Souza, P.N.; Grigoletto, T.L.B.; de Moraes, L.A.B.; Abreu, L.M.; Guimarães, L.H.S.; Santos, C.;
Galvão, L.R.; Cardoso, P.G. Production and chemical characterization of pigments in filamentous fungi.
Microbiology 2016, 162, 12–22. [CrossRef] [PubMed]
10. Nout, M.J.R.; Aidoo, K.E. Asian fungal fermented food. In Industrial applications; Springer: Berlin, Germany,
2011; pp. 29–58.
11. Perkins, D.D.; Davis, R.H. Evidence for safety of neurospora species for academic and commersial uses.
Appl. Environ. Microbiol. 2000, 66, 5107–5109. [CrossRef] [PubMed]
12. Pandit, A.M. Ramesh Life-history of neurospora intermedia in a sugar cane field. J. Biosci. 1996, 21, 57–79.
[CrossRef]
13. Ferreira, J.A.; Lennartsson, P.R.; Taherzadeh, M.J. Production of ethanol and biomass from thin stillage using
food-grade zygomycetes and ascomycetes filamentous fungi. Energies 2014, 7, 3872–3885. [CrossRef]
14. Mapari, S.A.; Thrane, U.; Meyer, A.S. Fungal polyketide azaphilone pigments as future natural food
colorants? Trends Biotechnol. 2010, 28, 300–307. [CrossRef] [PubMed]
15. Gmoser, R.; Ferreira, J.A.; Lennartsson, P.R.; Taherzadeh, M.J. Filamentous ascomycetes fungi as a source of
natural pigments. Fungal Biol. Biotechnol. 2017, 4, 4. [CrossRef] [PubMed]
16. Sues, A.; Millati, R.; Edebo, L.; Taherzadeh, M.J. Ethanol production from hexoses, pentoses, and dilute-acid
hydrolyzate by mucor indicus. FEMS Yeast Res. 2005, 5, 669–676. [CrossRef] [PubMed]
17. Lv, J.; Zhang, B.-B.; Liu, X.-D.; Zhang, C.; Chen, L.; Xu, G.-R.; Cheung, P.C.K. Enhanced production of natural
yellow pigments from monascus purpureus by liquid culture: The relationship between fermentation
conditions and mycelial morphology. J. Biosci. Bioeng. 2017, 124, 452–458. [CrossRef] [PubMed]
18. Varzakakou, M.; Roukas, T.; Kotzekidou, P.; Giamoustaris, A. Effect of non-ionic surfactants and beta-ionone
on the morphology of blakeslea trispora and carotenoids production from cheese whey in submerged aerobic
growth: A statistical approach. Food Biotechnol. 2010, 24, 197–214. [CrossRef]
19. Méndez, A.; Pérez, C.; Montañéz, J.C.; Martínez, G.; Aguilar, C.N. Red pigment production by penicillium
purpurogenum gh2 is influenced by ph and temperature. J. Zhejiang Univ. Sci. B 2011, 12, 961–968. [CrossRef]
[PubMed]
20. Sandmann, G. Photoregulation of carotenoid biosynthesis in mutants of Neurospora crassa: Activities of
enzymes involved in the synthesis and conversion of phytoene. Zeitschrift für Naturforschung C 1993, 48,
570–574.
21. Yang, Y.; Liu, B.; Du, X.; Li, P.; Liang, B.; Cheng, X.; Du, L.; Huang, D.; Wang, L.; Wang, S. Complete
genome sequence and transcriptomics analyses reveal pigment biosynthesis and regulatory mechanisms in
an industrial strain, Monascus purpureus yy-1. Sci. Rep. 2015, 5, 8331. [CrossRef] [PubMed]
22. Ku, S.; Zheng, H.; Park, M.S.; Ji, G.E. Optimization of β-glucuronidase activity from Lactobacillus delbrueckii
Rh2 and its use for biotransformation of baicalin and wogonoside. J. Korean Soc. Appl. Biol. Chem. 2011, 54,
275–280. [CrossRef]
23. Ku, S. Finding and producing probiotic glycosylases for the biocatalysis of ginsenosides: A mini review.
Molecules 2016, 21, 645. [CrossRef] [PubMed]
24. Marcoleta, A.; Niklitschek, M.; Wozniak, A.; Lozano, C.; Alcaíno, J.; Baeza, M.; Cifuentes, V.
Glucose and ethanol-dependent transcriptional regulation of the astaxanthin biosynthesis pathway in
Xanthophyllomyces dendrorhous. BMC Microbiol. 2011, 11, 190. [CrossRef] [PubMed]
25. Rolland, F.; Winderickx, J.; Thevelein, J.M. Glucose-sensing and-signalling mechanisms in yeast.
FEMS Yeast Res. 2002, 2, 183–201. [CrossRef] [PubMed]
26. Alcaíno, J.; Bravo, N.; Córdova, P.; Marcoleta, A.E.; Contreras, G.; Barahona, S.; Sepúlveda, D.;
Fernández-Lobato, M.; Baeza, M.; Cifuentes, V. The involvement of mig1 from Xanthophyllomyces dendrorhous
in catabolic repression: An active mechanism contributing to the regulation of carotenoid production.
PLoS ONE 2016, 11, e0162838. [CrossRef] [PubMed]
27. Bhosale, P. Environmental and cultural stimulants in the production of carotenoids from microorganisms.
Appl. Microbiol. Biotechnol. 2004, 63, 351–361. [CrossRef] [PubMed]
28. Paoletti, R.; Kritchevsky, D. Advances in Lipid Research; Elsevier: Amsterdam, The Netherlands, 2015;
Volume 21.Fermentation 2018, 4, 11 15 of 15
29. An, G.-H.; Chang, K.-W.; Johnson, E.-A. Effect of oxygen radicals and aeration on carotenogenesis and
growth of phaffia rhodozyma (Xanthophyllomyces dendrorhous). J. Microbiol. Biotechnol. 1996, 6, 103–109.
30. Clastre, M.; Bantignies, B.; Feron, G.; Soler, E.; Ambid, C. Purification and characterization of geranyl
diphosphate synthase from vitis vinifera l. Cv muscat de frontignan cell cultures. Plant Physiol. 1993, 102,
205–211. [CrossRef] [PubMed]
31. The UniProt Consortium. Uniprot: The universal protein knowledgebase. Nucl. Acids Res. 2017, 45,
D158–D169.
32. Mitzka-Schnabel, U. Carotenogenic enzymes from neurospora. Pure Appl. Chem. 1985, 57, 667–669.
[CrossRef]
33. Johnson, G.T.; McHan, F. Some effects of zinc on the utilization of carbon sources by Monascus purpureus.
Mycologia 1975, 67, 806–816. [CrossRef] [PubMed]
34. Said, F.M.; Brooks, J.; Chisti, Y. Optimal c: N ratio for the production of red pigments by Monascus ruber.
World J. Microbiol. Biotechnol. 2014, 30, 2471–2479. [CrossRef] [PubMed]
35. Carels, M.; Shepherd, D. The effect of different nitrogen sources on pigment production and sporulation of
Monascus species in submerged, shaken culture. Can. J. Microbiol. 1977, 23, 1360–1372. [CrossRef] [PubMed]
36. Nuraini, S.; Latif, S.A. Improving the quality of tapioca by product through fermentation by Neurospora crassa
to produce $ carotene rich feed. Pak. J. Nutr. 2009, 8, 487–490.
37. Rodríguez-Ortiz, R.; Limón, M.C.; Avalos, J. Regulation of carotenogenesis and secondary metabolism by
nitrogen in wild-type Fusarium fujikuroi and carotenoid-overproducing mutants. Appl. Environ. Microbiol.
2009, 75, 405–413. [CrossRef] [PubMed]
38. Griffin, D.H. Chemical requirements for growth. In Fungal Physiology, 2nd ed.; John Wiley & Sons: Hoboken,
NJ, USA, 1996; p. 133.
39. Sanchez, S.; Rutz, B.; Rodríguez-Sanoja, R. Microbial production of carotenoids. In Microbial Production of
Food Ingredients, Enzymes and Nutraceuticals; McNeil, B., Archer, D., Giavasis, I., Harvey, L., Eds.; Elsevier
Science: Burlington, MA, USA, 2013; pp. 194–223.
40. Velmurugan, P.; Lee, Y.H.; Nanthakumar, K.; Kamala-Kannan, S.; Dufossé, L.; Mapari, S.A.S.; Oh, B.T.
Water-soluble red pigments from Isaria farinosa and structural characterization of the main colored component.
J. Basic Microbiol. 2010, 50, 581–590. [CrossRef] [PubMed]
41. Luo, H.; Niu, Y.; Duan, C.; Su, H.; Yan, G. A ph control strategy for increased β-carotene production during
batch fermentation by recombinant industrial wine yeast. Process Biochem. 2013, 48, 195–200. [CrossRef]
42. Shin, C.S.; Kim, H.J.; Kim, M.J.; Ju, J.Y. Morphological change and enhanced pigment production of Monascus
when cocultured with Saccharomyces cerevisiae or Aspergillus oryzae. Biotechnol. Bioeng. 1998, 59, 576–581.
[CrossRef]
43. Hajjaj, H.; Blanc, P.; Groussac, E.; Uribelarrea, J.-L.; Goma, G.; Loubiere, P. Kinetic analysis of red pigment
and citrinin production by Monascus ruber as a function of organic acid accumulation. Enzyme Microb. Technol.
2000, 27, 619–625. [CrossRef]
44. Ahn, J.; Jung, J.; Hyung, W.; Haam, S.; Shin, C. Enhancement of monascus pigment production by the culture
of Monascus sp. J101 at low temperature. Biotechnol. Progress 2006, 22, 338–340. [CrossRef] [PubMed]
© 2018 by the authors. Licensee MDPI, Basel, Switzerland. This article is an open access
article distributed under the terms and conditions of the Creative Commons Attribution
(CC BY) license (http://creativecommons.org/licenses/by/4.0/).You can also read