2010 EXPEDITION TO KRENKEL STATION, HAYES ISLAND, FRANZ JOSEF LAND, RUSSIA DATA REPORT
←
→
Page content transcription
If your browser does not render page correctly, please read the page content below
2010 EXPEDITION TO KRENKEL STATION, H AYES ISLAND,
               FRANZ JOSEF LAND, RUSSIA

                                   D ATA REPORT

   D.A. Walker, S. Carlson, J.J. Frost, G.V. Matyshak, M.E. Leibman, P.
 Orekhov, A. Khomutov, O. Khitun, M. Zhurbenko, O. Afonina, E.M. Barbour
Alaska Geobotany Center, Institute of Arctic Biology, University of Alaska Fairbanks,
                                    AK 99775

                                      January 2011
                        Funding: NASA Grant No. NNX09AK56J

Citation: D.A. Walker, S. Carlson, J.J. Frost, G.V. Matyshak, M.E. Leibman, P. Orekhov, A.
Khomutov, O. Khitun, M. Zhurbenko, O. Afonina, E.M. Barbour. 2011. 2010 Expedition to
Krenkel Station, Hayes Island, Franz Josef Land, Russia, Data Report, Alaska Geobotany
Center, Institute of Arctic Biology, University of Alaska Fairbanks, Fairbanks, AK. 63 pp.

                                             1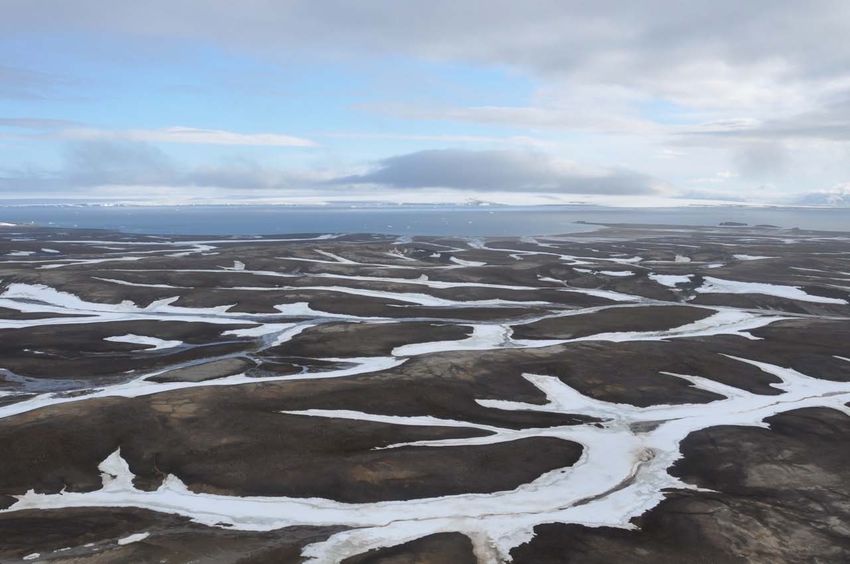
Members of the 2010 Expedition to Hayes Island. From left, Marina Liebman, Artem
   Khomutov, Andrey Abramov, Dmitriy Drozdov, Elena Slagoda, G.V. (JJ) Frost, Pavel
 Orekhov, Ina Timling, Andrey Ermak, D.A. (Skip) Walker, Ivan Gameev, Grigory Matyshak

This research is part of the Greening of the Arctic (GOA) initiative of the
International Polar Year (IPY) and is funded by NASA’s Land-Cover Land-Use
Change (LCLUC) program (Grant Nos. NNG6GE00A and NNX09AK56G). It
contributes to NASA’s global-change observations regarding the
consequences of declining Arctic sea ice and the greening of terrestrial
vegetation that is occurring in northern latitudes. The work is also part of the
Northern Eurasia Earth Science Partnership Initiative (NEESPI). It addresses
the NEESPI science questions regarding the local and hemispheric effects of
anthropogenic changes to land use and climate in northern Eurasia.

Cover photo: View of rolling topography typical of much of Hayes Island, taken during
helicopter reconnaissance of the island, 6 August 2010. Photo by D.A. Walker.

                                             2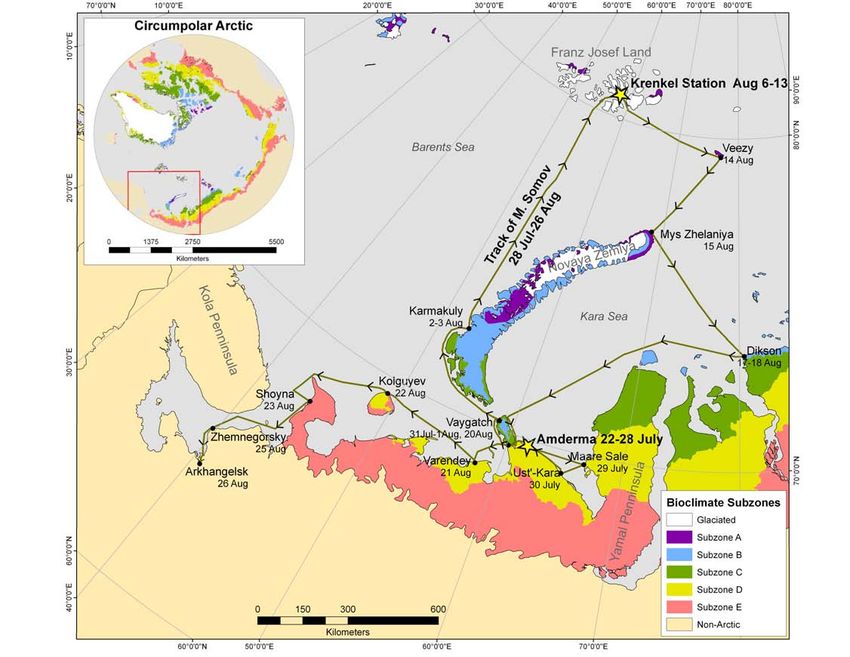
TABLE OF CONTENTS
  LIST OF FIGURES                                                                          4

  LIST OF TABLES                                                                           5

  INTRODUCTION                                                                             6

  HAYES ISLAND: GENERAL BACKGROUND                                                         8
  General description of Hayes Island and Krenkel Station                                  9
  Geology and topography                                                                   9
  Climate                                                                                 11
  Vegetation                                                                              12

  METHODS                                                                                 14
  50-m transects                                                                          15
  Criteria for site selection, size, arrangement and marking methods:                     15
  Species cover along transects using the Buckner point-intercept sampling device:        15
  Normalized Difference Vegetation Index (NDVI) and leaf-area index (LAI) measurements:   20
  Active layer measurements along transects:                                              15
  Relevés                                                                                 15
  Criteria for site selection, size, arrangement and marking methods:                     15
  Relevé site factors and species cover abundance:                                        15
  Soil sampling at relevés:                                                               15
  Soil pits and descriptions at each site                                                 15
  Biomass sampling at relevés                                                             15
  Biomass of mosses, lichens and cryptogamic crusts                                       16
  Ground surface temperature measurement, and n-factors, (ibutton placement):             17

  RESULTS                                                                                 17
  Maps and locations of study site                                                        17
  Factors measured along transects                                                        20
  Species cover along transects using the Buckner point sampler                           20
  Leaf-area index (LAI) and Normalized Difference Vegetation Index (NDVI)                 21
  Thaw depth                                                                              22
  Relevé data                                                                             24
  Sorted species table for Krenkel relevés                                                38
  Plant biomass
  iButtons                                                                                55
  Soil descritiptions of study sites: G. Matyshak                                         20

  REFERENCES                                                                              55

  APPENDICES
  A. LIST OF PARTICIPANTS IN ALL NASA-GOA RUSSIA EXPEDITIONS                              56
  B: PLOT SOIL AND VEGETATION PHOTOS                                                      58
  C. BIRD LIST FROM 2010 FRANZ JOSEF LAND EXPEDITION .                                    63

                                           3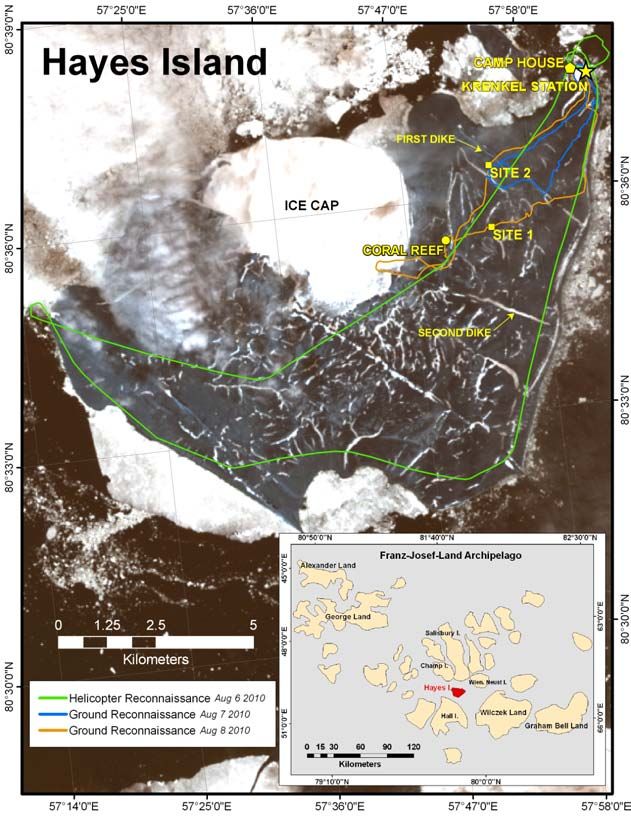
LIST OF FIGURES
Figure 1. Eurasian Arctic Transect... ............................................................................... 6
Figure 2. Route of 2010 Joint Russia-U.S. expedition to Hayes Island, Franz Josef Land.
     ................................................................................................................................ 7
Figure 3. Hayes Island…………………………………………………………………………..8
Figure 4. Krenkel Station………………………………………………………………………..9
Figure 5. Terrain of Hayes Island……………………………………………………….….…10
Figure 6. Site 1 (sandy loam site)………………………………………………………….…13
Figure 7. Site 2 (sandy site)………………………………………………………………..….13
Figure 8. The “Coral Reef”……………………………………………………………….……14
Figure 9. Map of transects and vegetation study plots at Krenkel Site 1……….……..…17
Figure 10. Map of transects and vegetation study plots at Krenkel Site 2 ………………17
Figure 11, Total live and dead biomass excluding cryptogamic crust…………......……..44
Figure 12. Total live biomass excluding trees and cryptogamic crust and litter.…...……45

Figure 13. Total biomass excluding trees and cryptogamic crust.……………………..…46
Figure 14. Total live biomass excluding cryptogamic crust………………………………..47
Figure 15. Total biomass including cryptogamic crust …………………………………….48
Figure 16. Total green biomass including cryptogamic crust………………...……………49
Figure 17. Soil pit № 1-10, Site 1. ……………………………………………………………51
Figure 18. Soil pit № 2-10. Site 1, polygon center.…...………………………………….....51
Figure 19. Horizontal pit, Site 2…………………………………………………………...…..53
Figure 20. Soil pit № 3-10. Site 2………………………………………………………..……53
Figure 21. Soil pit № 4-10, Site 2 polygon crack………………………………………...… 53
Figure B1. Krenkel relevé soil photos…………………………………………………..……58
Figure B2. Krenkel Site 1. Vegetation and biomass plot photos…………………….…….59
Figure B2. Krenkel Site 2. Vegetation and biomass plot photos…………………….…….60
Figure B4 Krenkel Site 1, Transect photos……………………………………………..……61
Figure B5 Krenkel Site 2, Transect photos ………………………………………………… 62

                                                                  4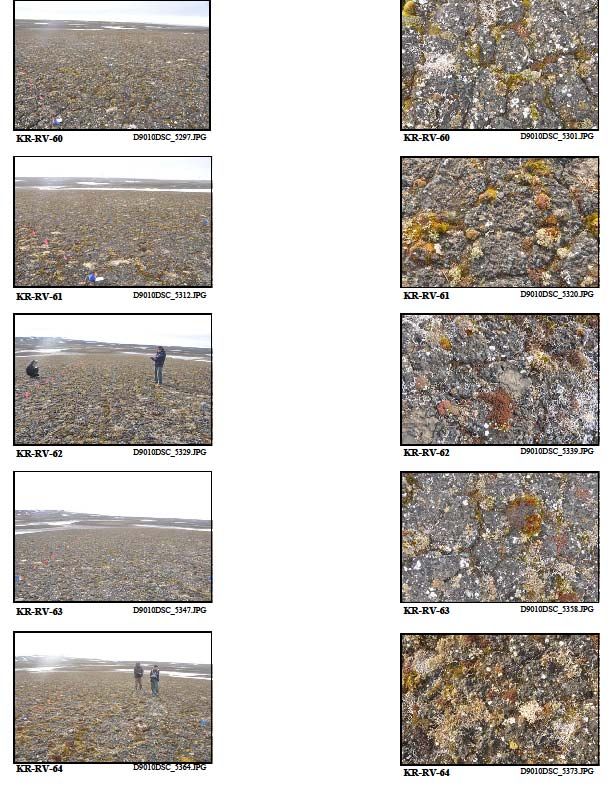
LIST OF TABLES
Table 1. Summary of climate data from the IM. E.T. Krenkel Station. ........................... 11
Table 2. GPS coordinates and elevations of vegetation study plots and transects.. ...... 18
Table 3. Study locations, site numbers, site names, and geological settings and
dominant vegetation at each study site. ........................................................................ 19
Table 4. Krenkel Site 1; species cover along transects. ................................................ 20
Table 5. Krenkel Site 2; species cover along transects. ................................................ 20

Table 6. Mean LAI and NDVI for transect and relevés at Krenkel Sites 1 and 2. ........... 21

Table 7. Active layer at transects and relevés. Depths are in centimeters..................... 22
Table 8. Soils data for all EAT relevés .......................................................................... 24
Table 9. Descriptions of all EAT relevé sites ................................................................. 25
Table 10. Site characteristics for EAT relevés............................................................... 26
Table 11. Species cover-abundance in vegetation study plots (relevés). ...................... 27
Table 12. Sorted table for Krenkel relevés.. .................................................................. 38
Table 13. Summary of above-ground plant biomass for all EAT vegetation relevés. ..... 40
Table 14. iButton logger numbers (on duct tape) and serial numbers and locations...... 40

                                                         5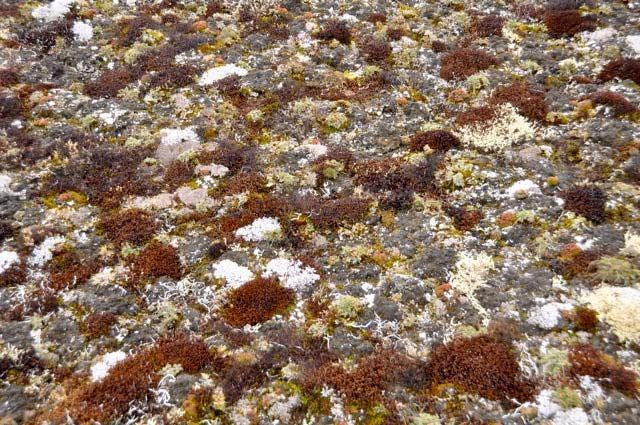
INTRODUCTION
     One of the goals of the Greening of the
Arctic project is to examine the trends in
vegetation, soils, permafrost characteristics,
and surface spectral properties along a
complete Arctic transect in Russia. The
transect stretches from Nadym at 65˚ 19’ N
to Krenkel Station 80˚ 38’ and consists of
seven study locations in all five of the Arctic
bioclimate subzones and the forest-tundra
transition (Figure 1). This work is comparable
to the work recently published for the North
America Arctic Transect (Walker D. A. et al.
2008). The 2010 expedition to Hayes Island
in the Franz Josef Land Archipelago
completed the Eurasia Arctic Transect
(EAT). This expedition was the fourth of the
project. Data reports from the previous three
NASA-GOA Russia expeditions (Walker et
al. 2008, 2009a, 2009b) are available online
at
http://www.geobotany.uaf.edu/yamal/reports.

                                                  Figure 1. Eurasian Arctic Transect. Bioclimate
                                                  subzones are according to CAVM Team (2003). Study
                                                  locations in each subzone are also shown. Map by
                                                  Shalane Carlson.

                                             6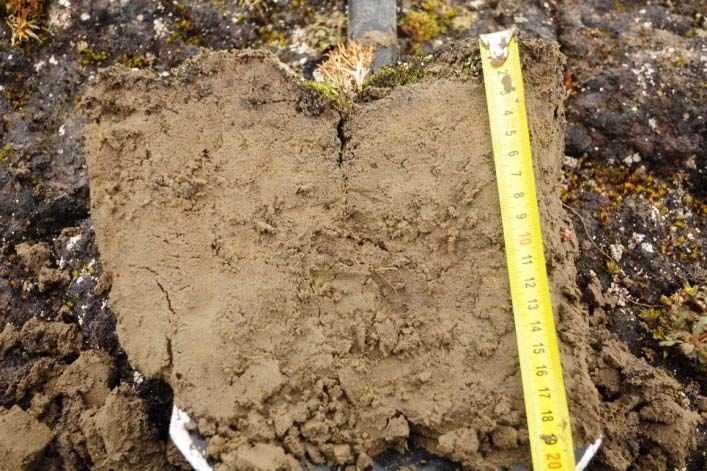
The Joint Russia-U.S. expedition to Hayes Island occurred from 22 Jul to 26 Aug
   2010. Hayes Island was reached during a voyage from Amderma to Arkhangelsk, during
   28 Jul to 27 Aug, aboard the ice-class ship Mikael Somov (Figure 2). The cruise that
   serviced several Russian Arctic stations along the coasts of the Barents and Kara Seas.

Figure 2. Route of 2010 Joint Russia-U.S. expedition to Hayes Island Franz Josef Land. The
background image shows the bioclimate subzones from the Circumpolar Arctic Vegetation Map (CAVM
2003). Map by Shalane Carlson.

                                                    7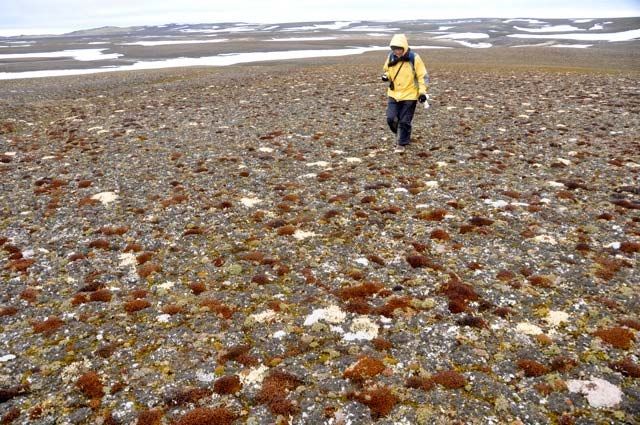
H AYES ISLAND: GENERAL BACKGROUND
     The Hayes
Island studies were
conducted 7-13 Aug
2010 at two sites
near the Krenkel
hydrometeorological
station in the
northeast corner of
the island (Figure 3).
The observations
followed the same
basic procedures
used at other
locations along the
EAT. Study sites
were established on
a zonal sandy loam
site (Site 1) and a
drier sandy site (Site
2). Most of the data
were collected from
5 transects at each
sample site, 5
permanent
vegetation study
plots (relevés), and 1
soil pit at each site.
    A permafrost
borehole was drilled
by the Earth
Cryosphere Institute.
The boreholes will
be described in          Figure 3. Hayes Island. Krenkel Station and the expedition camp are in the
another report.          upper right corner of the map. Colored lines show the routes of the helicopter-
                         and ground-reconnaissance transects. Site 1 and 2 are sites of permafrost
    The data in this     boreholes and measurements of vegetation, soils, spectral properties, and
report include: (1) a    active-layer thickness. The “Coral Reef” is a site of lush lichen-rich vegetation
general description      that was not sampled, but shown in Fig 8. Note the ice cap, stream channels
of the location and      filled with snow and the numerous linear snow beds that form on the leeward
                         side of volcanic dikes. Inset shows location within the Franz Josef Land
the two study sites      archipelago. (Base map: Pan sharpened false-color infrared composite image
with photographs,        (bands, 4, 3, 2), Landsat ETM+ Path 202, Row 101, July 3, 2001. Map by
(2) maps of the          Shalane Carlson).
study sites, study
plots, and transects at each location, (3) tabular summaries of the vegetation, site
factors, and soils at each relevé, (4) summaries of the Normalized Difference Vegetation
Index (NDVI) and leaf area index (LAI) along each transect and relevé, (5) detailed soil
descriptions and photos of the large soil pits described by G. Matyshak at each study

                                                 8
site, and (6) contact information for each of the    a)
participants. Most of the methods and data
forms for the project are contained in earlier
data reports, which are referenced by page
number in earlier data reports. An exception
are the methods used to determine the
biomass of cryptogamic crusts that form the
majority of the biomass on Hayes Island.

General description of Hayes Island and
Krenkel Station
    Hayes Island is a small 132 km2 island in
the central part of the Franz Josef Land
archipelago, which is the northernmost land          b)
mass in Eurasia, situated in the northeast part
of the Barents Sea shelf on the border with the
Arctic Ocean between 80˚ to 82˚ N latitude
(Figure 3). The archipelago is composed of
191 islands that are 85% ice covered. Hayes
Island (also spelled Heiss, Cheysa or Kheysa
through mistranscription into and from the
Russian Cyrillic alphabet) was named after Dr.
Israel Hayes, a U.S. polar researcher
(http://www.franz-josef-
land.info/index.php?id=653&L=5). The island is
approximately 14 km wide at its widest point
and about 10 km at its narrowest dimension.
                                                     Figure 4. Krenkel station. a) The small crater and
The island is mostly unglaciated, but there is a     lake that is the water supply for the station. The
small semi-circular-shaped ice cap                   complex of buildings housed about 200 station
(Hydrogeographers Ice Cap) that is about 5           personnel and seasonal researchers before the
km in diameter and 242 m high centrally              station was abandoned in 2001. The new station
                                                     was built in 2004 and is housed in second building
located along the northern coast of the island.      from the left on the opposite shore of the lake. b)
    The Krenkel Hydrometeorological Station,
was established during the 1957/58
International Geophysical Year and was the first climate station in the archipelago.
Numerous buildings and facilities associated with the station surround a small lake that
is situated in a volcanic crater in the northeast corner of the island at 80˚ 37’ N, 58˚ 3˚06’
E at an elevation of 20 m (Figure 4a). Over 1,950 sounding rockets, carrying scientific
and military payloads, were launched from the station during 1957 to 1990
http://www.astronautix.com/sites/kheysa.htm, and many of these landed in the tundra near
the station and are still present. The base camp for the expedition was located in an
abandoned building on the east side of the lake (Figure 4b).

Geology and topography
   Most of the FJL islands are composed of Mesozoic sedimentary and volcanic
deposits. The Archipelago is a network of horsts (the islands) and grabens (the channels
(Koryakin and Shipilov 2009). Many of the islands display basaltic plateaus with height of                 E
400-490 m. The maximum difference between the heights of the above-water and                               x
subsea portions is about 1000 m. On Hayes Island, basalt cliffs occur along the southern                   p
                                                                                                           e
                                                                                                           d
                                              9                                                            i
                                                                                                           t
                                                                                                           i
                                                                                                           o
                                                                                                           n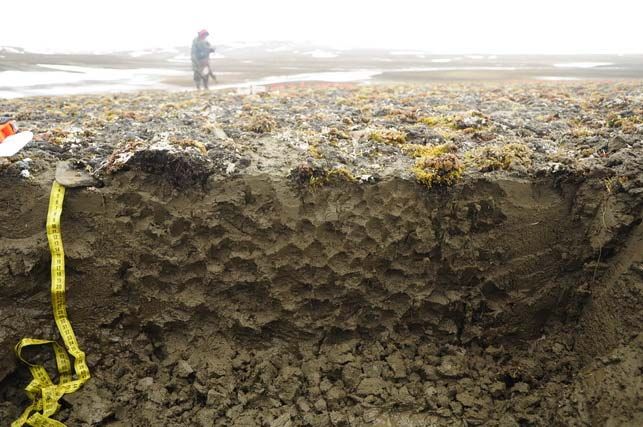
a)                                      b)                                       c)

d)                                      e)                                         f)

Figure 5. Terrain of Hayes Island. a) Basalt cliffs along the southern coast. b) Small ice cap along northern coast with
gentle hilly topography on sandstone bedrock and numerous snow-filled stream valleys. c) Hills in the central part of the
island with barren unconsolidated sandstone deposits in the foreground. d) “First Dike”, one of linear several volcanic
dikes on the island. The areas right and left of the dike are recent Quaternary marine and alluvial deposits. e) Pinnacles
along another dike in the western part of the island. f) Sandstone deposits exposed along stream. Photos: 6 Aug 2010,
D.A. Walker5.

        coast (Figure 5a), but most of the island is covered with sedimentary deposits that are
        highly dissected by snow-melt streams (Figure 5b, c). Unconsolidated sandstones,
        presumably of Mesosoic age outcrop along stream channels, on hill tops, and along the
        front of the small ice cap, forming badland topography in some areas (Figure 5d).
        Numerous volcanic dikes that cross the island provide some spectacular pinnacles and
        varied topography (Figure 5e, f). Unconsolidated Quaternary deposits up to 10 m thick
        occur at lower elevations. V.D. Dibner delineates the following Quaternary deposits of
        FJL: (1) marine terraces of the upper complex occurring, as a rule from 30-35 to 125-250
        m, (2) marine terraces of the lowermost complex where the upper limit of the height is
        30-35 m, (3) the glacial and glaciofluvial deposits of contemporary glaciers, and (4) and
        recent lacustrine-alluvial, deluvial-proluvial, eluvium and aeolian deposits (Dibner 1965).
        The Holocene history of the FJL archipelago has been reviewed by Lubinski et al.
        (Lubinski et al. 1999).

                                                              10
Climate
Krenkel has a maritime Arctic climate. The mean annual temperature is -12 ˚C and
the range of mean monthly air temperatures is from - 27 ˚C in February to 1˚C in July
(Table 1). The absolute recorded extremes are -42 ˚C and 12 ˚C). Only one month (July)
has a mean temperature above freezing and the summer warmth index is 1.1 ˚C mo.
Table 1. Summary of climate data from the IM. E.T. Krenkel Station. Data from
WeatherReports.com, (http://www.weatherreports.com/?location=Krenkel%2C+Russia)
The Barents Sea has a strong moderating effect on the climate. Cloudiness, high
humidity, summer fog and frequent storms are typical. High relative air humidity (80-
92%) occurs all the year. Mean annual precipitation is 282 mm with the maximum
precipitation occurring during November to February. Compared to Isachsen, the
subzone A station on the North America Arctic Transect, Krenkel is much warmer in
winter and on average (at Isachsen the mean annual temperature is -18 ˚C; and the
lowest recorded temperature is -65 ˚C) and the summer temperatures are much colder
11(Isachsen summer warmth index = 4.4 ˚C mo compared to 1.1 ˚C mo at Krenkel). The
annual precipitation at Krenkel is nearly 3 times that at Isachsen (282 mm compared to
97 mm at Isachsen).
The island has consistent strong winds. Easterly winds predominate in the wintertime,
and northwesterlies in the summer time. The strongest mean wind speeds are during
winter (January mean speed is 30.6 km/h). Summer winds are relatively mild; the mean
in August is 17.7 km/h. Very strong winds occur from November to June, and can last for
several days on end. Hurricanes with the wind speeds up to 40 m/s (144 km/ hr) are
possible during this period. In summer and autumn, hurricanes have not been recorded
and very strong winds are comparatively rare.
Vegetation
Hayes Island is in the Polar Desert geobotancial subregion (Alexandrova 1980) and
bioclimate subzone A of the Circumpolar Arctic Vegetation Map (CAVM Team 2003).
The terrain and vegetation of the island were observed along a helicopter flight on
August 7, 2010, and during two ground surveys of August 8 and 9 (Figure 5). From the
air, most of the mesic gently sloping hills between drainages appear black, a
consequence of the abundant cover of black and dark-colored cryptogamic species
(Figure 5b, c). At the ground level the vascular plant cover is sparse, but much more
abundant than is evident from even a low flying helicopter. The vegetation on mesic sites
is composed primarily of lichens, mosses, and cushion-forbs. In areas not exposed to
extreme winds or excessive erosion, black, white, and gray crustose-lichen species
cover about 50-85% of the ground surface and include Protopannaria pezizoides,
Lecidea ramulosa, Baeomyces rufus, Lepraria gelida, Ochrolechia inaequatula,
Ochrolechia frigida, Pertusaria cf. coriacea, unidentified lichen prothalli and algal crusts.
Fruticose lichens cover about 5-15% of the surface and include Cetrariella delisei,
Cetraria islandica, Thamnolia subuliformis, Flavocetraria cucullata, Stereocaulon
alpinum, and S. rivulorum. Mosses cover about 2-25% and include Cirriphyllum
cirrosum, Orthothecium chryseon, Polytrichastrum alpinum, and Ditrichum flexicaule.
The most common vascular plant is the polar poppy, Papaver polare. This and other
cushion and mat forbs (including Stellaria edwardsii, S. crassipes, Cochlearia
groenlandica, Draba subcapitata, D. micropetala, Saxifraga cernua, S. cespitosa, S.
oppositifolia, Cerastium arcticum, C. regelii) cover 3-15% of the ground surface. The
most common graminoids are grasses which generally cover less than 1% of the ground
surface and include Phippsia algida, Alopecurus borealis, and Poa abbreviata. Common
woody tundra genera such as Dryas and Salix are conspicuously absent, as are all
sedges (Carex, Eriophorum, Kobresia).
Although Hayes Island has many similarities to Isachsen, the Subzone A site on the
North America Arctic Transect, there were also some big dissimilarities. Perhaps most
noticeable is the complete dominance of cushion forms of all plant types — forbs,
grasses, lichens, and mosses — apparently a consequence of a more extreme summer
climate. The lack of terrestrial herbivores including caribou, muskoxen and lemmings
also has numerous effects. For example, well-developed lichen communities occur in
favorable sites because of the lack of grazing pressure from caribou and the very moist
summer climate (see Figure 8). On the other hand, there is also a lack of small
nitrophilous plant communites in inland areas that are normally found around animal
dens and dead animal carcasses (although bird perch sites do have similar
communities). Also the greater amount of winter snow causes extensive snowbanks to
linger into August in all the drainages and leeward slopes, causing extensive sheet flow
12Figure 6. Site 1 (sandy loam site). Left: Landscape at site 1. Dominant vascular plant species
are Papaver dahlianum spp. polare, Stellaria edwardsii, S. crassipes, Draba micropetala,
Saxifraga cespitosa, and Phippsia algida. Right: Close up of the vegetation. Photos: D.A. Walker.
of water draining from these snowbeds and extensive muddy, nearly impassable areas
and very late plant phenology. The wetter conditions also cause an abundance of
cryptogamic crusts, which cover nearly all surfaces that are not exposed to either
extremely late snow or extreme winds. Biomass harvests revealed that this cryptogamic
crust forms a surprising large portion of the biomass (33% (95 g m-2) on a sandy loamy
soil at Site 1, and 86% (218 g m-2) on a sandy soil at Site 2).
As at the other locations along the Eurasia transect, our vegetation surveys focused
on mesic vegetation found on moderately drained flat to gently sloping terrain. Two sites
were selected for the vegetation surveys. Site 1 (sandy loam site) (Figure 6) is located
on a gentle west-facing slope at an elevation of 30 m with relatively abundant plant
cover. Vascular plants cover 3-8% of the surface, mosses 9-23%, fruticose lichens 4-
15%, and crustose lichens 50-60%. The soil pH ranges from 6.0 to 6.2; promoting the
growth of some basiphilous cryptogamic species (e.g., Ditrichum flexicaule, Cirrophyllum
cirrosum, Cratoneuron curvicaule). Mean active layer depth was 34 cm on 11 Aug. Small
patterned-ground features (non-sorted polygons (Washburn 1980) 10-15 cm in diameter
are common on most surfaces. These are formed by seasonal frost cracking. The cracks
between polygons are protected habitats for small mosses, lichens and forbs (Figure 6,
Figure 7. Site 2 (sandy site). Left: Landscape at Site 2. Dominant vascular plant species are
Papaver dahlianum spp. polare, Stellaria edwardsii, S. crassipes, and Phippsia algida. The water-
filled depression on the right is an ice-wedge-polygon trough. The ridge in the background is “First
Dike”. Right: Close up of the vegetation. The white lichen is Stereocaulon alpinum. Note the
cryptogamic crust, cushion forms of most of the plants, and the small nonsorted polygons with
plants growing preferentially in the cracks between polygons. Photos: D.A. Walker.
13right).
Site 2 (sandy site) (Figure 7) is located on a flat sandy marine terrace at about 10 m
elevation. The site has scattered glacially derived rocks. Soil pH at this site ranged from
5.1 to 5.6. The depth of thaw averaged 33 cm on Aug 12. The surface geomorphology is
composed of large flat-centered ice-wedge polygons 20-25 m in diameter and small
nonsorted polygons 10-20 cm in diameter. Compared to Site 1, Site 2 has noticeably
less moss cover (1-3%) and more cryptogamic crusts (80-85% cover). The dominant
vascular plants are Papaver dahlianum spp. polare, Stellaria edwardsii, S. crassipes,
Saxifraga cernua, Phippsia algida and Cochlearia groendlandica. Cushion forms of the
lichens Cetrariella delesii, C. islandica, Flavocetraria cucullata, Thamnolia subuliformis,
Stereocaulon alpinum and S. rivulorum are common. Common bryophytes include
Polytrichastrum alpinum, Orthothecium chryseon, Bryum rutilans and Anthelia
juratzkana.
We also visited a site dubbed the “Coral Reef” because of its very well developed
lichen vegetation that reminded us, in our semi-frozen delirium, of tropical marine
habitats (Figure 8). On false-color-infrared Landsat satellite images, this and other
similar sites have relatively bright reddish tones, and have the most lush vegetation on
the island The site we visited occurred on a gentle south facing slope with sandy loam
soils. Unfortunately, we were unable to return to this site to sample it during the short
amount time we were on the island.
Figure 8. The “Coral Reef”. The spectacular lichen cover develops in the cool moist arctic maritime climate
and is able to thrive because of the lack of reindeer on the island. The brown lichens are mainly Cetrariella
delisei and Cetraria islandica. The white lichens are Stereocaulon alpinum and Thamnolia subuliformis. The
yellowish liches are mainly Flavocetraria cucullata. Photos: D.A. Walker.
METHODS
The primary sampling methods used at the Krenkel study sites were the same as
those used in 2007-09 at previously surveyed EAT locations. Readers should refer to the
report for the 2008 and 2009 expeditions (Walker, 2009a, b) for details of the sampling
methods. Below we cite the page numbers in the first report (Walker et al. 2009a) and
note any variations or changes to the methods.
1450-m transects
Criteria for site selection, size, arrangement and marking methods:
See Walker et al. (2009a), p. 12-14. GPS coordinates were recorded at the south
(00m) and north ends (50m) of each transect. Transect numbers on aluminum-tag
markers have a prefix of KR_ (Krenkel) followed by the transect number and the
distance along the transect (e.g. KR_T61_00m to designate the beginning of the
transect T61, and KR_TR61_50m marks the end.)
Species cover along transects using the Buckner point-intercept sampling device:
See Walker et al. (2009a), p. 14.
Normalized Difference Vegetation Index (NDVI) and leaf-area index (LAI) measurements:
See Walker et al. (2009a), p. 14-15. The NDVI of all relevés was measured, but
problems with the PS-2 instrument and snowy conditions prevented measurement at all
points along the transects.
Active layer measurements along transects:
Active layer thickness was measured at 5-m intervals along the five transects at both
sites. Active layer thickness was also measured on each relevé and is noted in the site
characteristics of each study plot.
Relevés
Criteria for site selection, size, arrangement and marking methods:
See Walker et al. (2009a), p. 12-14. Relevé numbers on aluminum-tag markers have
the prefix of KR_ (Krenkel) followed by the relevé number (e.g. KR_RV60). (GPS
coordinates were recorded at the southwest corner of all 5 x 5-m relevé plots.
Relevé site factors and species cover abundance:
See Walker et al. (2009a), p. 15-16.
Soil sampling at relevés:
See Walker et al. (2009a), p. 18.
Soil pits and descriptions at each site by G. Matyshak:
See Walker et al. (2009a), p. 18 and p. 60-76.
Biomass sampling at relevés:
Biomass was sampled from a 20 x 50-cm clip-harvest frame in the center of each
relevé. Relevé numbers on aluminum-tag markers at biomass sample sites have the
prefix of KR_ (Krenkel) followed by the relevé number and then BM to designate
biomass plot (e.g. KR_RV60_BM). See Walker et al. (2009a), p. 17 and Appendix D, p.
88-95 for general clip-harvest and sorting procedures. In previous years we noted sand
contamination in the biomass harvests of mosses and lichens, but did not properly adjust
for this contamination. Also previously we did not determine the biomass of cryptogamic
crusts. At the Hayes Island sites we adjusted our methods to correct for these problems
as described below.
15Biomass of mosses, lichens and cryptogamic crusts
Clip harvest and sorting procedures followed the same protocols as in Walker et al.
(2009a) for all plant functional types except for mosses, lichens and cryptogamic crusts
which had high cover at both sites and considerable mineral mixed in the samples.
Mosses and lichens and one forb sample: 12 samples had high percentages of
mineral and needed to be ashed to determine percentage of mineral (RV_60 dead moss
and dead forb, RV_61 dead moss and lichen, RV_62 dead moss (w sand), dead moss
("clean"), RV_63 live moss, dead moss, RV_ 64 dead moss "clean", RV_65 dead moss,
RV_69 live moss, dead moss). These samples were treated as follows:
a. Heated porcelain 100 ml cups to 750 ˚C to drive water out of clay.
b. Weighed empty cups, recorded number on cup and weight.
c. Ground complete moss, lichen or forb sample in a Waring industrial blender.
d. Added about 5 g of sample to a crucible (less for highly organic samples) and weighed.
e. Heated samples slowly to 750˚C for 4 hours, then ashed for 4 more hours.
f. Reweighed samples, subtracted ashed weight from dry weight to determine percent of dry organic matter
Cryptogamic crusts were treated as follows:
a. The vegetation and top 2 cm of soil were "sliced" intact from each 20 x 50 cm biomass plot using a
serrated bread knife. The sample was divided in half and carefully placed into two gallon-size Ziploc bags. In
some cases the slice came in pieces, primarily because of cracks between small nonsorted polygons or
irregularities in the soil.
b. The vascular plants, mosses and lichens were removed and sorted according to plant functional types
as previously defined in Walker et al. (2009a).
c. "Cookies" of soil containing cryptogamic crusts were cut from the pieces of tundra of each slice with the
2
lid from a 300 ml Edge® gel-shaving-lotion can. Each “cookie” was circular and 5-cm diameter (19.6 cm
area). 5 cookies were cut from each plot if possible. Three plots had only 3 samples. Excess mineral was
removed from each cookie, generally to a thickness of about 0.5 cm.
d. Each entire "cookie" sample was ground in a Waring industrial blender.
e. About 100 ml of water was added to float off the organic matter.
f. The water and organic matter mixture was passed through 0.25 mm sieve (sand stayed in beaker,
organic stayed on the sieve). Note: One sample of mineral remaining in the blender was ashed to see how
much organic did not float off (4%).
g. The -organic remaining on sieve was scraped into a petri dish. These samples still had high amount of
mineral in them and needed to be ashed to determine weight of mineral matter.
h. The dried organic matter and sand on the petri dish was dried at 65 ˚C, and weighed.
i. The samples were then ashed at 750˚C, and reweighed after ashing. These samples contained mineral
plus plant ash.
j. Plant ash was removed by treating with 10% HCl, stirred for 5 min and then heated 15-20 min to
remove plant ash.
k. The solution containing the mineral and dissolved organic was passed through a filter paper to extract
the mineral.
l. We then ashed the filter paper + treated ash at 750˚C, and reweighed the sample, to determine how
much of mineral sample was organic material (average 3.2%).
m. Since the cookies were taken generally from small areas with continuous cover of crusts and not
randomly collected from each biomass harvest plot it was necessary to adjust the crust biomass to reflect
the measured area of crusts. To determine the mass of cryptogamic crust per unit area at each site, the
2 2
average biomass of crust per m values was calculated from the cookies from each site (307 g/m for Site 1
2
and 376 g/m for Site 2) was multiplied by average cover of all crusts (black, white and gray crusts as well
as indentifiable crustose lichens) as determined from the Buckner sampling transects (41.4% for Site 1 and
-2 -2
52.1% for Site 2). This resulted in a mean crust biomass of 127 g m at Site 1 and 197 g m at Site 2.
n. To determine mass of cryptogamic crust per unit area within each 20 x 50 cm biomass harvest plot, the
2 2
average crust biomass for each site (307 g/m for Site 1 and 376 g/m for Site 2) was multiplied by the
number of cookies per square meter (509.55) times the visually estimated area of crust in each biomass
harvest plot (based on photographs of each harvest plot). The visually estimated area of crust within each
biomass plot varied from 20 to 48% at Site 1 and from 40 to 67% at Site 2. Using this method, the average
-2 -2
crust biomass within the harvest plots was 95 g m at Site 1 and 218 g m at Site 2.
16Ground surface temperature measurement, and n-factors, (ibutton placement):
See Walker et al. (2009a), p. 16-17.
RESULTS
Maps and locations of study site
Figure 9. Map of transects and vegetation study plots at Krenkel
Site 1. The x in the center of each plot is the location of the 20 x 50 cm
biomass harvest plot. The dot in the lower left corner is the location of
the iButtons. Distance between transects is 12.5 m.
Figure 10. Map of transects and vegetation study plots at Krenkel
Site 2. The x in the center of each plot is the location of the 20 x 50 cm
biomass harvest plot. The dot in the lower left corner is the location of
the iButtons. Distance between transects is 12.5 m.
17GPS coordinates of all relevés, transects, and other locations along the EAT.
Table 2. GPS coordinates and elevations of vegetation study plots and transects. BO – Belyy Ostrov,
KH – Kharasavey, KR – Krenkel, LA – Laborovaya, ND – Nadym, VD – Vaskiny Dachi. RV = Relevé, T =
Transect. Coordinates are recorded at the southwest corner of each grid, and at both ends of the transects
(00 and 50 m).
18EAT study locations, site numbers, site names, geological settings and dominant vegetation.
Table 3. Study locations, site numbers, site names, and geological settings and dominant vegetation at each study site.
19Factors measured along transects
Species cover along transects using the Buckner point sampler
Table 4. Krenkel Site 1; species cover along transects. “Overstory” species are those recorded at the top
of the plant canopy at each point; “understory” species are those recorded at the base of the plant canopy
sometimes followed by L (live green plant part) or D (dead or senescent plant part).
Table 5. Krenkel Site 2, species cover along transects.
20Leaf-area index (LAI) and Normalized Difference Vegetation Index (NDVI)
Table 6. Mean LAI and NDVI for transect and relevés at Krenkel Sites 1 and 2.
21Thaw depth
Table 7. Active layer at transects and relevés. Depths are in centimeters.
22Table 7 (continued). Active layer at transects and relevés. Depths are in centimeters.
23Factors measured in study plots
Relevé data
Table 8. Soils data for all EAT relevés.
24Table 9. Site descriptions for all EAT relevés. Characteristic species use six letter abbreviations (first three letters of genus name + first
three letters of species name). Observers: PK, Patrick Kuss; NM, Nataliya Moskalenko; EK, Elina Kärlajaarvi; RD, Ronnie Daanen; HE;
Howie Epstein; JG, Josef Geml; IT, Ina Timling; SW, Skip Walker. Photo archives are at UAF.
25Table 10. Site characteristics for all EAT relevés. For key to values, see Walker et al. 2009a.
Table 11. Species cover-abundance in vegetation study plots (relevés). Nomenclature for vascular plants followed Elven et al. 2007: Checklist of the
Panarctic Flora (PAF). Vascular plants. -Draft. University of Oslo. Lichens followed H. Kristinsson & M. Zhurbenko 2006: Panarctic lichen checklist
26(http://archive.arcticportal.org/276/01/Panarctic_lichen_checklist.pdf). Mosses followed M.S. Ignatov, O.M. Afonina & E.A. Ignatova 2006: Check-list of mosses of East Europe and North Asia. Arctoa 15: 1-130 and for liverworts N.A. Konstantinova & A.D. Potemkin 1996: Liverworts of Russian Arctic: an annotated check-list and bibliography. Arctoa 6: 125-150. Cover-abundance scores: r = rare, + =
Table 11 (cont.). Species cover-abundance in vegetation study plots (relevés).

                                                                            28
Table 11 (cont.). Species cover-abundance in vegetation study plots (relevés).
29Table 9. Species cover-abundance in vegetation study plots (relevés) (cont.).
30Table 11 (cont.). Species cover-abundance in vegetation study plots (relevés).
31Table 11 (cont.). Species cover-abundance in vegetation study plots (relevés).
32Table 11 (cont.). Species cover-abundance in vegetation study plots (relevés).
33Table 11 (cont.). Species cover-abundance in vegetation study plots (relevés).
34Table 11 (cont.). Species cover-abundance in vegetation study plots (relevés).
35Table 11 (cont.). Species cover-abundance in vegetation study plots (relevés).
36Table 11 (cont.). Species cover-abundance in vegetation study plots (relevés).
37Sorted species table for Krenkel relevés
Table 12. Sorted table for Krenkel relevés. Values are Braun-Blanquet cover-abundance scores.
38Table 12 (cont.). Sorted table for Krenkel relevés.
39Plant biomass
Table 13. Summary of above-ground plant biomass for all EAT vegetation relevés. Tree biomass was determined from the plot-count method. See Appendix
D in Walker et al. (2009a) for biomass sampling and sorting methods for the non-tree species. For the trees, biomass was determined from the plot-count method
-2
and expressed in g m .
40Table 13 (cont.). Summary of above-ground plant biomass for all EAT vegetation relevés.
41Table 13 (cont.) . Summary of above-ground plant biomass for all EAT vegetation relevés.
42Biomass notes added:
May 22, 2009: The following ash data were obtained by Gosha Matyshak:
samples ash, % (450°C)
RV
KH_RV_49 dead bryophyte 24,25
KH_RV_ 49 live bryophyte 11,01
KH_RV_ 48 dead bryophyte 31,84
KH_RV_ 48 live bryophyte 16,91
KH_RV_ 46 dead bryophyte 33,21
KH_RV_ 46 live bryophyte 20,66
KH-RV-41 Bryophyte live 2,51
KH-RV-44 Lichen 7,65
KH-RV-43 Bryophyte dead 1/2 1,61
KH- RV-48 Litter 25,91
KH- RV-49 Litter 33,98
The high ash weights for live and dead bryophytes and the litter from the sandy plots at Kharasavey (KH_RV_46, 48, 49) indicate that these samples were
likely contaminated by sand that was not burned off during the ashing process. The mass of live and dead bryophytes, lichens and litter should be reduced.
Reasonable estimates based on these limited data are: Live bryophytes biomass, -13%; dead bryophytes -26%; litter, -28%. Lichens probably should also be
reduced about 20%.
43Figure 11. Total live and dead biomass excluding cryptogamic crust.
44Figure 12. Total live biomass excluding trees and cryptogamic crust and litter.
45Figure 13. Total biomass excluding trees and cryptogamic crust
46Figure 14. Total live biomass excluding cryptogamic crust.
47Figure 15. Total biomass including cryptogamic crust
48Figure 16. Total green biomass including cryptogamic crust.
49iButtons:
Table 14. iButton logger number (on duct tape) and serial numbers and locations at
Krenkel.
iButton logger locations at Krenkel.
50Soil descriptions of study sites: G. Matyshak
Site 1
Location: Hayes Island
GPS position: N80°35' 35.3'', E 057°54' 13.8''
Elevation: 50 m.
Parent material: sandstones (carbonate ?)
Figure 17: soil pit № 1-10, Site 1. Right photo shows polygon crack.
Figure 18: soil pit № 2-10. Site 1, Polygon center.
Description:
Interpolygon (crack):
510-2 сm; Oi; fibric material (moss), loose.
2-4 сm; Oi; dark brown (7.5YR3/3) slightly decomposed moss (H3, F8, R3); very friable, many
fine roots; abrupt irregular boundary.
4-13 cm; Bw; grayish brown (10YR5/2) loamy sand, few medium Fe concentrations (masses)
(2.5YR5/8) around boundary; few fine vesicular pores, few fine roots, non-sticky, non-plastic,
weak medium subangular blocky structure; gradual wavy boundary.
13-34 cm; Bwf; grayish brown (10YR4/2) sandy loam, with 3-5 mm of strong decomposed (Н9)
organic streaks (10YR2/2) across the horizon , common fine vesicular pores, slightly sticky,
slightly plastic, few coarse gravel, weak medium platy structure; frozen below 34cm., 40-50%
ice by volume, ice lenses and ice veins of 3-5 mm. thickness.
Polygon (center)
0-0.5cm; Oi; (2,5YR2/1); fibric material (black crust), firm.
0.5-15 cm; Bwjj; grayish brown (10YR5/2) loamy sand, few medium vesicular pores, few fine
roots, non-sticky, non-plastic, slightly effervescence, few coarse gravel, weak medium
subangular blocky structure; gradual wavy boundary.
15-37 cm; Bhf; grayish brown (10YR4/2) sandy loam, common fine vesicular pores, slightly
sticky, slightly plastic; weak medium platy structure; frozen below 37cm., 40-50% ice by volume,
ice lenses and ice veins of 3-5 mm. thickness.
52Site 2
Location: Hayes Island
GPS position: 80º36'24.2''N, 057 º54'36.5''E
Elevation: 15 m.
Parent material: marine sediments
Depth: 0 сm. 2 cm. 5 cm.
Figure 19. Horizontal pit, Site 2.
Figure 20. Soil pit № 3-10. Site 2.
Figures 21. Soil pit № 4-10, Site 2 polygon crack.
53Description:
Interpolygon (crack):
0-1.5cm; Oi; fibric material, loose, slightly decomposed moss
1.5-2.0сm; Е; gray (10YR5/2) sand, discontinuous, friable, non-sticky, non-plastic, structureless,
common medium roots, abrupt irregular boundary.
2-10cm; Bhjj; grayish brown (7.5YR4/2) sand, friable, common medium vesicular pores,
common medium roots, non-sticky, non-plastic, weak medium platy structure; clear irregular
boundary.
10 - 35cm; Bwf; gray (10YR5/3) sandy loam, with 3-5 mm of strong decomposed (Н8) organic
streaks (10YR2/2) across the horizon , many medium vesicular pores, slightly sticky, slightly
plastic; many shell fragments, few coarse gravel, few medium Fe concentrations (masses)
(2.5YR5/8), weak medium platy structure, frozen below 35cm., massive.
Polygon:
0-0.5cm; Oi; (2,5YR2/1); fibric material (black crust) and moss
0.5-15cm; Bh; grayish brown (7.5YR4/2) sand, many fine vesicular pores, friable, few fine roots,
non-sticky, non-plastic, weak medium platy structure; clear irregular boundary.
15 - 36cm; Bwf; gray (10YR5/3) sandy loam, medium vesicular pores, slightly sticky, slightly
plastic; many shell fragments, few coarse gravel, weak medium platy structure, frozen below
36cm., massive.
References
Von Post, L. and Granlund, E. 1926. Södra Sveriges Torvtillgångar I. Sveriges Geologiska
Undersökning, Yearbook, 19.2 Series C, No. 335. pp1–127, Stockholm. English translation
in: Damman AWH and French TW (1987), The Ecology of Peat Bogs of the Glaciated
Northeastern United States: A Community Profile. US Department of Interior, Fish and
Wildlife Service, Research Development, National Wetlands Research Center. Washington,
DC. Biological Report. 85 (7.16) 1-115.
Munsell soil color charts. Determination of soil color quoted in part from U.S. Dept. Agriculture
Handbook 18-Soil Survey Manual .
54REFERENCES
Alexandrova VD. 1980. The Arctic and Antarctic: Their Division into Geobotanical Areas.
Cambridge: Cambridge University Press.
CAVM Team, Walker, D.A., Gould, W.A., Bliss, L.C., Edlund, S.A., Raynolds, M.K., Zoltai, S.C.,
Daniëls, F.J.A., Bay, C., Wilhelm, M., Einarsson, E., Gudjonsson, G., Elvebakk, A.,
Johansen, B.E., Ananjeva, G.V., Drozdov, D.S., Katenin, A.E., Kholod, S.S., Konchenko,
L.A., Korostelev, Y.V., Melnikov, E.S., Moskalenko, N.G., Polezhaev, A.N., Ponomareva,
O.E., Pospelova, E.B., Safronova, I.N., Shelkunova, R.P., Yurtsev, B.A., Fleming, M.D.,
Markon, C.J., Murray, D.F., and Talbot, S.S., 2003, Circumpolar Arctic Vegetation Map:
Anchorage, AK, Conservation of Arctic Flora and Fauna (CAFF) Map No. 1, U.S. Fish and
Wildlife Service.
Dibner VD. 1965. The history of late Pleistocene and Holocene sedimentation in Franz Josef
Land (in Russian). Transactions of the Scientific Research Institute of the Geology of the
Arctic 143: 300-318.
Koryakin YV, Shipilov EV. 2009. Geochemical specifics and 40Ar/39Ar age of the basaltoid
magmatism of the Alexander Land, Northbrook, Hooker and Hayes Islands (Franz josef
Land Archipelago). Doklady Earth Sciences 425: 260-263.
Lubinski DL, Forman SL, Miller GH. 1999. Holocene glacier and climate fluctuations on Franz
Josef Land, Arctic Russia, 80˚N. Quaternary Science Reviews 18: 85-108.
Walker, D.A., Epstein, H.E., Romanovsky, V.E., Ping, C.L., Michaelson, G.J., Daanen, R.P., Shur, Y.,
Peterson, R.A., Krantz, W.B., Raynolds, M.K., Gould, W.A., Gonzalez, G., Nicolsky, D.J.,
Vonlanthen, C.M., Kade, A.N., Kuss, P., Kelley, A.M., Munger, C.A., Tarnocai, C.T., Matveyeva,
N.V., and Daniëls, F.J.A., 2008, Arctic patterned-ground ecosystems: A synthesis of field studies
and models along a North American Arctic Transect: Journal of Geophysical Research -
Biogeosciences, v. 113, p. G03S01.
Walker, D.A., Epstein, H.E., Leibman, M.E., Moskalenko, N.G., Kuss, J.P., Matyshak, G.V.,
Kaärlejarvi, E., and Barbour, E.M., 2009, Data Report of the 2007 and 2008 Yamal
Expeditions: Nadym, Laborovaya, Vaskiny Dachi, and Kharasavey: Fairbanks, AK,
University of Alaska, p. 133.
Walker, D.A., Orekhov, P., Frost, G.V., Matyshak, G., Epstein, H.E., Leibman, M.O., Khitun, O.,
Khomotov, A., Daanen, R., Gobroski, K., and Maier, H.A., 2009, The 2009 Yamal Expedition
to Ostrov Belyy and Kharp, Yamal Region, Russia Fairbanks, AK, University of Alaska
Fairbanks, p. 63.
Walker, D.A., Epstein, H.E., Leibman, M.E., Moskalenko, N.G., Kuss, H.P., Matyshak, G.V.,
Kaarlejaärvi, E., Forbes, B.C., and Barbour, E.M., 2008, Data Report of the 2007 Yamal
Expedition to Nadym, Laborovaya, and Vaskiny Dachi, Yamal Peninsula Region, Russia:
Fairbanks, AK, University of Alaska Fairbanks.
Washburn AL. 1980. Geocryology: A Survey of Periglacial Processes and Environments. New
York: Halsted Press, John Wiley and Sons.
55Jozef Geml: K
APPENDIX A. LIST OF Biology and Wildlife Department University of Alaska
Fairbanks
PARTICIPANTS IN THE FOUR PO Box 757000
Fairbanks, Alaska 99775-7000
NASA-SPONSORED EURASIA jozsef.geml@gmail.com
ARCTIC TRANSECT Ivan Gameev: Kr
Earth Cryosphere Institute, SB RAS
EXPEDITIONS Malygin Street 86
Locations visited: N: Nadym; L: Laborovaya; 625026 Tyumen, Russia
V: Vaskiny Dachi; K: Kharasavey; Kp: Anatoly Gubarkov: L, V, K
Kharp; B: Ostrov Belyy; Kr: Krenkel Tyumen State Oil and Gas University
Volodarsky Street 38
625000 Tyumen, Russia
Andrey Abramov: Kr agubarkov@mail.ru
Earth Cryosphere Institute, SB RAS Elina Kaarlejärvi: N, L, V, K
Malygin Street 86
Arctic Centre
625026 Tyumen, Russia
University of Lapland
Ronnald Daaen: B, Kp
Box 122
Geophysical Institute
96101 Rovaniemi, Finland
University of Alaska Fairbanks
P.O. Box 757320 +358-50-560-86-87
Fairbanks, AK 99775-7320 elina.kaarlejarvi@gmail.com
rdaanen@alaska.edu Olga Khitun: B
Dmitriy S. Drozdov: N, Kr Khomarov Botanical Institute
Earth Cryosphere Institute, SB RAS St. Petersburg, Russia
Vavilov Street 30/6, room 15 Khitun-olga@yandex.ru
119991 Moscow, Russia Artem Khomutov: L, V, K, B, Kr
+7-495-135-98-71 Earth Cryosphere Institute, SB RAS
ds_drozdov@mail.ru
Malygin Street 86
Evgeny Elanchev: N 625026 Tyumen, Russia
Earth Cryosphere Institute, SB RAS
akhomutov@gmail.com
Malygin Street 86
625026 Tyumen, Russia Patrick Kuss: N, L, V
eelanchev@yandex.ru Institute of Plant Sciences
University of Bern
Howard E. Epstein: N, L, V, K, B
Altenbergrain 21
Department of Environmental Sciences
3013 Bern, Switzerland
University of Virginia
Phone: +41 31 631 4992
P.O. Box 400123
Fax: +41 31 631 4942
Clark Hall, 211
patrick.kuss@ips.unibe.ch
Charlottesville, VA 22904-4123
Phone: +1 434-924-4308 Marina Leibman: L, V, K, B, Kr
Fax: +1 434-982-2137 Earth Cryosphere Institute, SB RAS
hee2b@virginia.edu Vavilov Street 30/6
Andrey Ermakov: Kr 119991 Moscow, Russia
Earth Cryosphere Institute, SB RAS +7-916-607-83-93
Malygin Street 86 moleibman@gmail.com
625026 Tyumen, Russia Grigory V. Matyshak: N, L, V, K, B, Kp, Kr
Gerald V. (JJ) Frost: B, Kh, Kp Department of Soil Science
Department of Environmental Sciences Lomonosov Moscow State University
University of Virginia Leninskie Gory
P.O. Box 400123 119992 Moscow, Russia
Clark Hall, 211 +7-495-939-39-80
Charlottesville, VA 22904-4123 matyshak@ps.msu.ru
Gvf5y@virginia.edu
56Nataliya G. Moskalenko: N, L, V, K Donald A. (Skip) Walker: N, L, V, K, B,
Earth Cryosphere Institute, SB RAS Kp, Kr
Vavilov Street 30/6, room 67 Institute of Arctic Biology
119991 Moscow, Russia Alaska Geobotany Center
University of Alaska Fairbanks
+7-499-135-98-71 PO Box 757000
nat-moskalenko@hotmail.com Fairbanks, Alaska 99775-7000
Aleksander Nikitin: N Phone: +1 907-474-2460
Earth Cryosphere Institute, SB RAS Fax: +1 907-474-7666
Vavilov Street 30/6 dawalker@alaska.edu
119991 Moscow, Russia
Aleksandernikol@gmail.com
Olga Opokina: N
Earth Cryosphere Institute, SB RAS
Malygin Street 86
625026 Tyumen, Russia
+7-3452-688-787
opokina@ikz.ru
Pavel T. Orekhov: N, K, B, Kr
Earth Cryosphere Institute, SB RAS
Vavilov Street 30/6, room 67
119991 Moscow, Russia
+7-499-135-98-71
744001@gmail.com
Olga E. Ponomareva: N
Earth Cryosphere Institute, SB RAS
Vavilov Street 30/6, room 67
119991 Moscow, Russia
+7-499-135-98-71
o-ponomareva@yandex.ru
Vladimir Romanovsky: N
Department of Geology and Geophysics
University of Alaska Fairbanks
P.O. Box 757320
Fairbanks, Alaska 99775-7320
+1-907-474-7459
veromanovsky@alaska.edu
Stanislaus Sizonenko: B
Salekhard, Russia
Elena Slagoda: Kr
Earth Cryosphere Institute, SB RAS
Malygin Street 86
625026 Tyumen, Russia
akhomutov@gmail.com
Andrei Tarosov: B
Earth Cryosphere Institute, SB RAS
Vavilov Street 30/6
119991 Moscow, Russia
Ina Timling: Kr
Institute of Arctic Biology
Alaska Geobotany Center
University of Alaska Fairbanks
PO Box 757000
Fairbanks, Alaska 99775-7000
Phone: +1 907-474-7957
itimling@alaska.edu
57APPENDIX B: PLOT SOIL AND VEGETATION PHOTOS
Figure B1 – Krenkel relveé, soil photo.
58Figure B1. Krenkel Site 1. Vegetation and biomass plotos
59Figure B2. Krenkel Site 2. Vegetation and biomass plots.
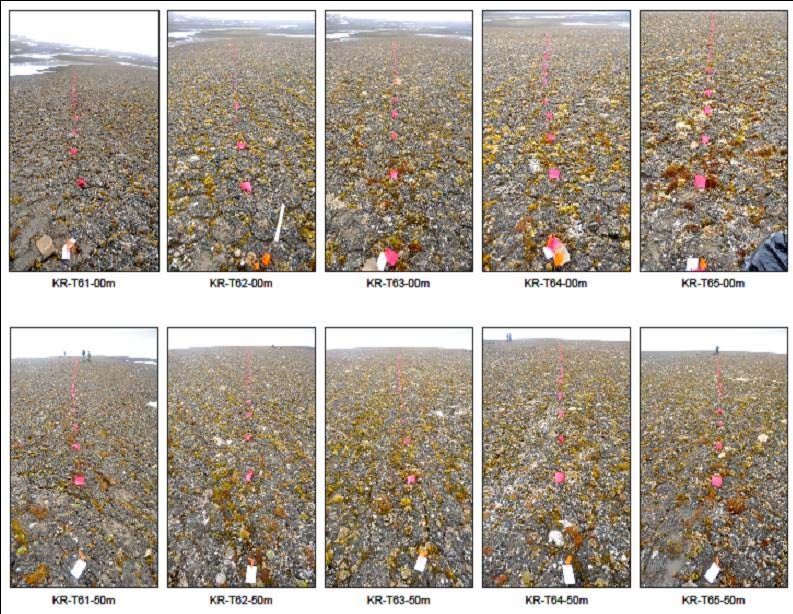
60Figure B3. Krenkel Sites1, Transect photos.
61KR-T66-00m KR-T67-00m KR-T68-00m KR-T69-00m KR-T70-00m
KR-T66-50m KR-T67-50m KR-T68-50m KR-T69-50m KR-T70-50m
Figure B4. Krenkel Sites 2, Transect photos.
62APPENDIX C. BIRD LIST FROM 2010 FRANZ JOSEF LAND EXPEDITION .
LIST OF BIRDS OBSERVED DURING HAYES ISLAND EXPEDITION, 2010. OBSERVATIONS FROM
MIKHAIL SOMOV INCLUDE BIRDS SEEN AT SEA AND WHILE ANCHORED AT PORTS-OF-CALL.
BREEDING SPECIES ARE INDICATED WITH AN ASTERISK. COMPILED BY G.V. FROST.
63You can also read