PRE-APPROVED DRAFT: STATUS OF PACIFIC HERRING CLUPEA - Pacific Wild
←
→
Page content transcription
If your browser does not render page correctly, please read the page content below
Canadian Science Advisory Secretariat
Pacific Region                                                             Science Response 2018/nnn

  PRE-APPROVED DRAFT: STATUS OF PACIFIC HERRING (CLUPEA
         PALLASII) IN 2018 AND FORECAST FOR 2019

                                                   Context

Fisheries and Oceans Canada (DFO) Pacific Fisheries Management Branch requested that DFO
Pacific Science Branch assess the status of British Columbia (BC) Pacific Herring] stocks in 2018
and recommend harvest advice for 2019 to inform the development of the 2018/2019 Integrated
Fisheries Management Plan.

Pacific Herring abundance is assessed using a statistical catch-age (SCA) model. The 2017
assessment included updates to SCA (Integrated Statistical Catch-Age Model, (Martell et al.,
2012)) and a bridging analysis to support these changes (Cleary et al., 2018). Also new to the
2017 assessment was the estimation of stock productivity and current stock status relative to the
new limit reference point (LRP) of 0.3SB 0 (Kronlund et al., 2017). The 2017 model formulation
was not changed for 2018 stock assessment.

In 2016 DFO committed to renewing the current management framework to address a range of
challenges facing Pacific Herring stocks and fisheries in BC. Renewal of the management
framework includes conducting a Management Strategy Evaluation (MSE) process to evaluate
the performance of candidate management procedures against a range of hypotheses about
uncertain stock and fishery dynamics. As part of the MSE process, a CSAS regional peer review
occurred July 25-26, 2018, where performance of Pacific Herring management procedures were
assessed against conservation objectives for Strait of Georgia and West Coast Vancouver Island
stock assessment regions (DFO, 2018).1

Estimated stock trajectories, current status of stocks for 2018, and harvest advice
recommendations for 2019 reflect methods of Cleary et al. (2018) and, where applicable,
recommendations from the aforementioned July 2018 regional peer review. These
recommendations are described in the section “Harvest recommendations for 2019”.

This Science Response Report results from the Science Response Process of September 2018
on the PRE-APPROVED DRAFT: Status of Pacific Herring (Clupea pallasii) in 2018 and forecast
for 2019.
   1
    DFO. 2018. Evaluation of management procedures for Pacific Herring (Clupea pallasii) in the Strait of Georgia and
the West Coast of Vancouver Island management areas of British Columbia. DFO Can. Sci. Advis. Sec. Sci. Advis.
Rep. (In press.)

October 2018
Pacific Region                      PRE-APPROVED Draft Science Response: Pacific Herring

                                         Background

Pacific Herring in BC are managed as five major and two minor stock assessment regions (SARs;
Figure 1). The major SARs are Haida Gwaii (HG), Prince Rupert District (PRD), Central Coast
(CC), Strait of Georgia (SoG), and West Coast of Vancouver Island (WCVI). The minor SARs are
Area 27 (A27) and Area 2 West (A2W). We conduct formal analyses of stock trend information for
the Pacific Herring major SARs. For the minor SARs, we present catch data, biological data, and
spawn survey data (Appendix).

Description of the fishery

At present, the Pacific Herring fisheries in BC consist of commercial fishing opportunities for food
and bait (FB), spawn-on-kelp (SOK) products, and roe herring. There are also opportunities for
First Nations food, social, and ceremonial fisheries (FSC), and recreational fishing.

In 2017/2018, the primary Pacific Herring fisheries were seine roe and gillnet roe fisheries, with a
combined coast wide catch in 2017/2018 of 13,577 tonnes (t), and the FB seine fishery with a
coast wide catch of 5,907 t. The roe and FB fisheries were operational in SoG only. The
spawn-on-kelp (SOK) fishery was operational in PRD and CC, and special use (SU) minor
fisheries were operational in PRD, CC and SoG, respectively.

A complete dockside monitoring program exists for all Pacific Herring commercial fisheries and
the resulting validated catch data are included in the annual stock assessment process for all
fisheries, except SOK. The SOK fishery is licenced based on validated pounds of SOK product
(eggs on kelp) however these landings are not easily combined with catches of whole herring and
are not currently incorporated in the stock assessment process.

The exclusion of SOK fishery data from the annual stock assessment process was identified as a
key uncertainty in the most recent CSAS review of the stock assessment framework (Cleary
et al., 2018). Recommendations for addressing this uncertainty will require quantifying ponding
mortality and removals (eggs) associated with the SOK fishery. Consideration of these
uncertainties will occur at a future stage in the MSE process.

Description of the stock assessment process

The SCA model is fitted to commercial catch data, fishery and survey proportions-at-age data
and a fishery-independent spawning biomass index to estimate total and spawning biomass,
natural mortality, and recruitment. Observed annual weight at age estimates are estimated
external to the model and maturity at age is a fixed input parameter. In 2017, an updated version
of the SCA was applied to assess each of the five major Pacific Herring stocks (Cleary et al.,
2018). The main change from the SCA used from 2011-2016 was the partitioning of variance
between observation and process error to improve the estimation of the variance structure
(Cleary et al., 2018). A bridging analysis was used to validate the updated model: this showed
parameter estimates and biomass trajectories associated with the structural adjustments to be

                                                 2
Pacific Region                     PRE-APPROVED Draft Science Response: Pacific Herring

nearly identical to results from previous version of the model, supporting the adoption of the
revised structure (Cleary et al., 2018). Other adjustments were made to improve computational
efficiency and update input data.

A Bayesian framework was used to estimate time series of spawning biomass, instantaneous
natural mortality, and age-2 recruitment from 1951 to 2018. Advice to managers for the major
stock areas includes posterior estimates of current stock status (SB 2018 ), spawning biomass in
2019 assuming no catch (SB 2019 ), and stock status relative to the LRP of of 0.3SB 0 . The Markov
chain Monte Carlo (MCMC) sampling procedure follows the same method implemented by
Cleary et al. (2018) with chain length 5 million, sampling frequency of 1,000, and burn-in of
1,000. The resulting 5,000 samples are used to calculate median posterior estimates of
spawning biomass (for example) and associated 90% credible intervals.

Cleary et al. (2018) reported results from two SCA fits that differed in assumptions about dive
survey (1988 to 2018) catchability (i.e., AM1 where q2 is estimated with a prior distribution
assumed, and AM2 where q2 = 1). The assumptions that the dive survey spawn index represents
all the spawn deposited and that no eggs are lost to predication are strong. However, there is
little information in the stock assessment data to inform an estimate of q2 ; examination of the
Bayes posterior shows the prior is not updated for HG, CC, SoG, and WCVI SARs and the
estimated value reflects the prior mean (Cleary et al., 2018, Appendix D). Assuming q2 = 1 at
least produces a “minimum” biomass estimate so that any other assessment errors and
management implementation errors are buffered (see Martell et al. (2012) and DFO (2012)).
Application of the AM1 model would remove such safeguards despite recent simulation
evaluation showing that large (positive) assessment errors are produced by the current
assessment model even with q2 = 1 (DFO, 2018).1 Simulations to quantify the risks associated
with continued application of a management procedure where q2 = 1 were conducted because
fisheries management quota decisions since 2015 have been based on the AM2 model. Scaling
the assessment with values of q2 < 1 is likely to result in larger absolute assessment errors than
those illustrated when q2 = 1. For these reasons, advice presented here is based on the AM2
stock assessment model parameterization, supported also by comparisons presented in DFO
(2016, Table A1) and Cleary et al. (2018, Appendix D).

                                 Analysis and response

Input data

Input data to the stock assessment are summarized in Table 1. Relative to last year’s
assessment, the only change we made to input data was updating the time series to include data
from the 2017/2018 herring season (July 1 to June 30).

Catch data

For the purposes of stock assessment, catch data are summarized by gear type and fishing
category as described in Table 1 and presented in Figure 2.

                                                3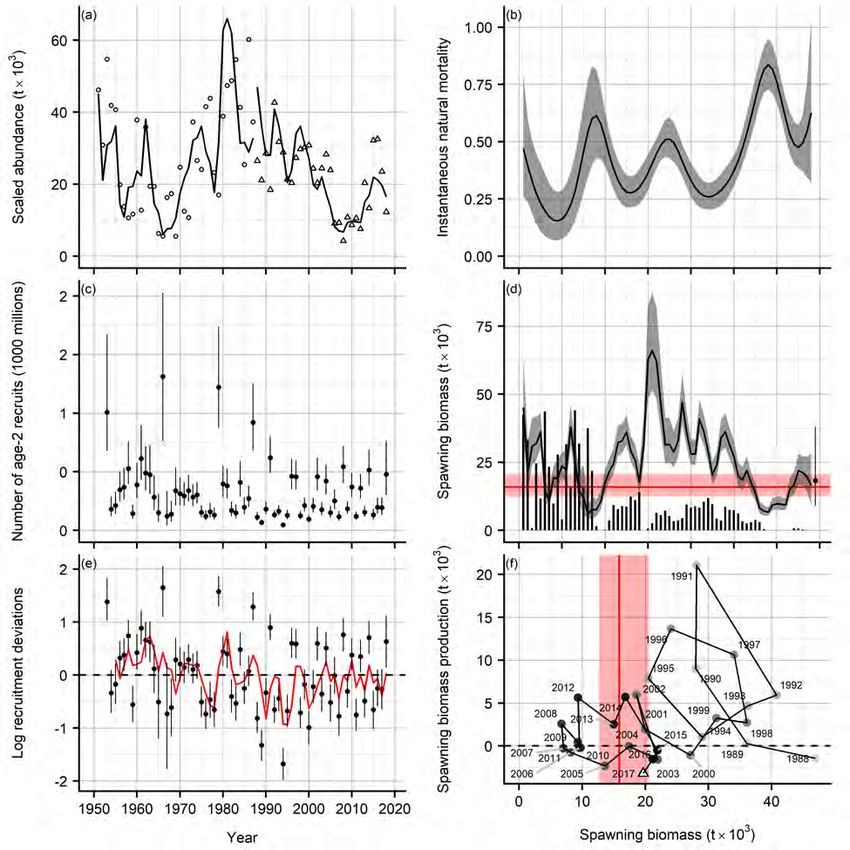
Pacific Region                      PRE-APPROVED Draft Science Response: Pacific Herring

As per previous years, catch input to the stock assessment model does not include mortality from
the commercial SOK fishery, nor any recreational or food, social, and ceremonial (FSC) fisheries.
The FSC and recreational catches are considered minor relative to commercial harvest. The
commercial SOK fishery is licensed based on pounds of validated SOK product (i.e., eggs
adhered to kelp), not tonnes of fish used or spawned. Currently there is no basis for validating
mortality imposed on the population by this fishery, however methods for estimating SOK
mortality are being developed.

Combined commercial removals from 2010 to 2018 from the roe, food and bait, and special use
fisheries are presented for the major stocks in Table 2. The proportion of coast-wide catch that
comes from the SoG was 22% in 1990, and has increased to greater than 95% in 2018. Total
SOK harvest is presented for the major SARs in Table 3.

Biological data

Biological samples are collected from the major commercial herring fisheries and through the test
fishery program as described in Table 1. The seine charter vessels collect sounding information,
reporting locations and approximate size of pre-spawning aggregations of Pacific Herring on a
daily basis, and biological samples are collected from pre-spawning aggregations via purse
seine. The present-day objective of test fishery biological sampling program is to collect samples
in a variety of areas both open and closed to commercial fishing (providing the sole source of
biological data for closed areas). Each “herring sample” (one bucket) is roughly 100 individual
herring, from which the following data are collected: fish length, weight, sex, gonad length, gonad
weight, and maturity.

The biological data inputs to the stock assessment are annual weight-at-age (Figure 3) and
annual numbers-at-age, shown as proportions-at-age (Figure 4). The time series of Pacific
Herring weights-at-age allows the assessment model to capture the effects of time-varying
changes in weight-at-age, which are significant for Pacific Herring. Since biomass is calculated
using the product of model estimated numbers-at-age and (time-varying) weight-at-age, changes
in biomass can be attributed to both change in the numbers of fish or the weight-at-age of fish
over time. Changes in mean weight-at-age also affect the estimate of the equilibrium unfished
biomass, a key leading parameter for Pacific Herring assessment and reference points.

Significant declines in weight-at-age are evident for all major herring stocks, from the mid-1980s
to 2010. Declining weight-at-age may be attributed to any number of factors, including fishing
effects (i.e., gear selectivity) and environmental effects (changes in ocean productivity), or it may
be attributed to by changes in sampling protocols (shorter time frame over which samples are
collected). An increasing trend in weight-at-age is now apparent for all major stocks from
2012-2018, although to a lesser degree for PRD.

Abundance data

The surface (1951-1987) and dive (1988-2018) spawn survey methods involve collecting
information on spawn length (parallel to shore), spawn width (perpendicular to shore), and
number of egg layers by vegetation type. These data are used to calculate egg densities per

                                                  4
Pacific Region                      PRE-APPROVED Draft Science Response: Pacific Herring

spawn. Ultimately, the estimated weight of mature spawners required to produce the egg
deposition is calculated and referred to as the spawn index. Execution of the 2018 spawn survey
followed all standard protocols as described in the 2013 version of the herring spawn survey
manual. Detailed background, methods, and equations for calculating the spawn index are
summarized in the draft spawn index technical report. Time series of spawn index by major stock
area, from 1951 to 2018 are summarized in Figure 5. In 2018, there was an increase in survey
biomass in WCVI and SoG (Figure 5 and Tables 8 and 7) and a decrease in survey biomass in
PRD and CC (Figure 5 and Tables 5 and 6). HG survey biomass has remained at historical low
levels since 2016.

Spatial spawn distribution

Tables 4 to 8 summarize the spatial distribution of survey spawn biomass (i.e., the spawn index)
and proportions over years for the major SARs. We summarise HG, PRD, CC, and WCVI by
Statistical Area, and SoG by Group, where choice of spatial grouping reflects spawning behaviour
and biology for each SAR based on the survey data and working group discussions with local
First Nations. Sections and Groups are not intended to represent sub-stock structure or ’known’
stocklets.

Tables 4 to 8 also present annual proportions of survey spawn index expressed as biomass by
Statistical Area or Group for the last five years, and average proportions by Statistical Area or
Group for 1 to 5 years. To facilitate comparisons, these tables also include spawn index by
year.

First Nations observations

First Nations observations are provided by First Nations representatives to describe their
perspective in their respective local areas.

Haida Gwaii

The 2018 herring spawn survey on Haida Gwaii was conducted from April 7–21 within Area 2
East. Haida traditional harvest of spawn on kelp observed in the major stock area was low.

Prince Rupert District

This year in the Prince Rupert District, Lax Kw’alaams had several fishermen out on the water.
One of the members was on the water for a full 8 days. He and his crew observed lots of herring,
at least 10,000 fish, swimming in the region for several days. After 4-5 days of observation, they
disappeared. It should be noted that there were whales feeding on these fish over the
observation period. It is possible that these fish felt there was too much predation and they

                                                 5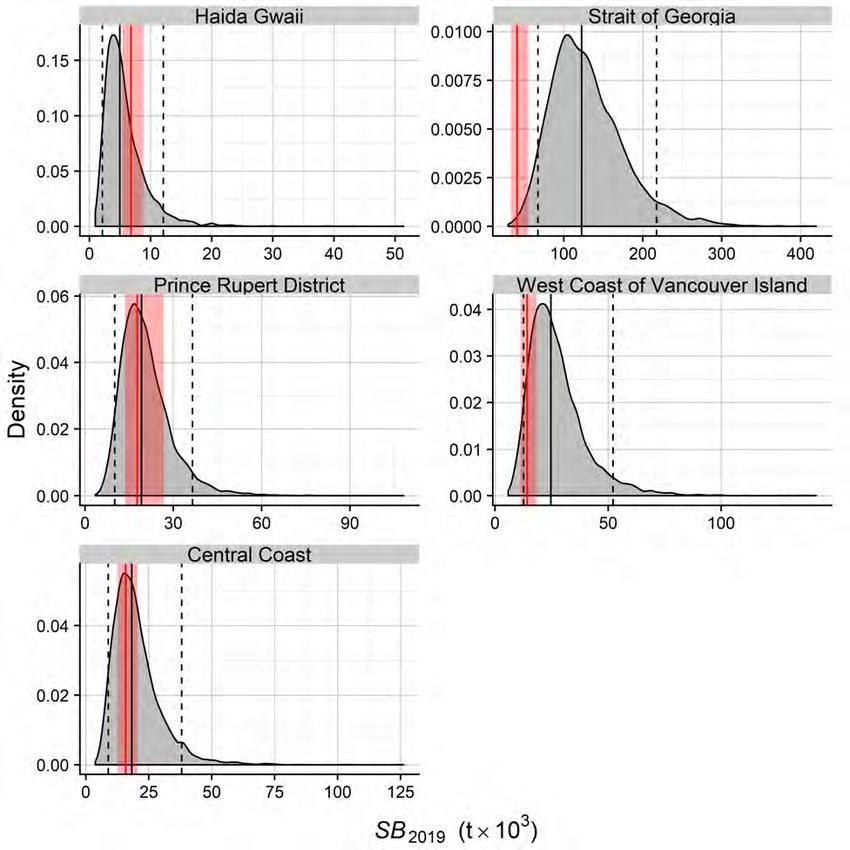
Pacific Region                      PRE-APPROVED Draft Science Response: Pacific Herring

moved to deeper water to spawn or they were eaten by the whales. Some spawning was
observed, but it was not as much as expected based on the herring observed.

Lax Kw’alaams gill net fishermen reported that the use of nets with a smaller mesh size yielded
better catches. The fish obtained were smaller than normal. Most of the gill net fishermen did not
gather enough fish to satisfy FSC needs. For the SOK fishery in the Prince Rupert District, there
was very little spawn obtained and with insufficient amounts needed to satisfy the FSC needs of
the community. Many of the ponds that were established (4) were destroyed by sea lions preying
on captive fish.

Lax Kw’alaams Fisheries Technicians spent 4 days during the harvest to monitor and record
herring. They found no schools of fish on any of the days they were out. Their correspondence
with harvesters on the water confirmed the absence of herring.

Similar observations were reported by members of the Metlakatla First Nation. Metlakatla
members were very unsuccessful again in 2018 in achieving their Section 35(1) needs for herring
spawn-on-kelp or -on-branches. The last catch reports were submitted from community members
during the early 2000s, and this information will be reflected in the catch reporting to the AFS
Manager at that time. Although effort was made in 2018, with assistance from DFO staff, to to
obtain SOK from the fishery, it was not successful due to many circumstances, including very low
biomass of herring. Metlakatla technician participated in field work with Lax Kw’alaams during
one of their patrols, and the lack of fish, spawn, and wildlife indicated to our technician that the
stocks are seriously depressed.

Central Coast

FSC fishermen and SOK fishermen from both the Heiltsuk and Kitasoo/Xai’xais Nations reported
very challenging fishing seasons in 2018, resulting in less and overall lower-grade product than in
previous years, due to a combination of low tonnage of spawners, high predator pressure, and
unusual spawner behaviour.

Heiltsuk harvesters reported generally low spawner volume and a high incidence of spot
spawning, exacerbated by seals and sea lions, which frequently disturbed spawning
aggregations. The main spawn lasted only two days, which is shorter than usual. Although what
appeared to be a strong spawning event occurred in Spiller Channel, spawning was too brief
and/or deep to obtain any product. In general, harvesters found it more difficult than usual to
predict the erratic spawner behaviour. Some would get only one or two layers on their kelp, not
enough for merchantable product, while others reported that it took much longer than usual to
cover the kelp with a sufficient number of layers (a week instead of a few days).

Kitasoo harvesters also observed that the tonnage of fish available had noticeably dropped from
previous years. Sea lions continue to be a major problem for fishing, especially in the SOK
fishery. Higgins Pass had very small tonnage in the area prior to spawning. Overall these
observations signal a reduction in biomass in 2018. Spawn timing was similar to previous years,
though it has been trending earlier over the past 8-10 years (18 days earlier than the 2010/2011
season). The fish held deeper than normal, and spawned very intensely over a shorter period
than normal.

                                                 6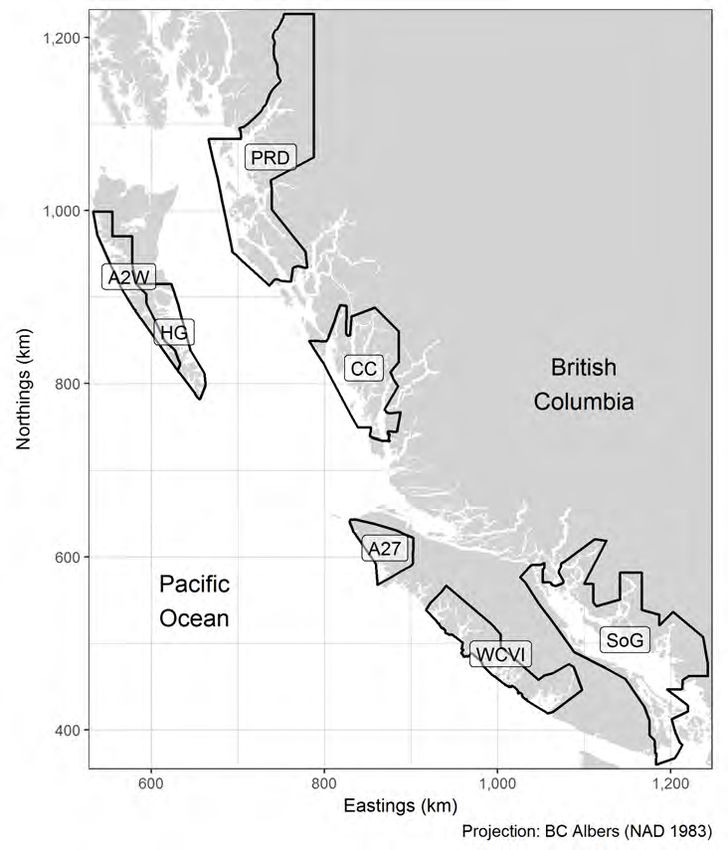
Pacific Region                      PRE-APPROVED Draft Science Response: Pacific Herring

Strait of Georgia

Hul’q’umi’num Nations report that little to no spawn activity occurred south of Dodd Narrows in
2018. Additionally, there was limited predator activity observed, and a number of
species/predators seemed to have moved from the area (predators were less numerous than
previous years). FSC roe catch was gathered within the traditional fishing territory but outside of
the immediate core territory. There was also an issue with cholera that required an extensive
community outreach collaboration with the health department of Hul’q’umi’num, taking time that
would have otherwise been spent continuing to look for spawn in the area.

West Coast of Vancouver Island

There were several observations from Nuu-chah-nulth harvesters and Fisheries Technicians
regarding WCVI herring in 2018. Very early spawn was observed in Hesquiaht Harbour, and on
the west side of Barkley Sound (January). A January spawn in Hesquiaht Harbour is a common
event, but not in Barkley. There were small spawning events in February, primarily in Area 24.
The main spawning events in Areas 23–25 were in mid to late March. Due to the distinct timing
and relatively small spawn, the early Hesquiaht and Barkley spawns were not assessed by divers
or included in the WCVI assessment. Marine vegetation from the early spawn collected by
Hesquiaht residents reported 1–2 layers of eggs.

For the main WCVI herring spawning, Nuu-chah-nulth harvesters set whole trees and lines of
tree branches to harvest herring spawn-on-bough (SOB). Trees and boughs were set in both
usual herring spawning locations and in active spawning locations in Barkley Sound (Area 23),
Clayoquot Sound (Area 24), Nootka Sound, Esperanza Inlet, Nuchatlitz (Area 25), and Kyuquot
Sound (Area 26, which is outside of DFO assessment area for WCVI herring). Herring SOB
harvests were mixed. In both Area 23 and 24 some harvesters did OK with one or two trees with
4-6 layers, whereas some trees had only 1–2 layers (a minimum of 4 to 6 layers of eggs are
necessary to provide enough eggs to peel off branches for harvesting). Harvests in Areas 23 and
24 were well below community food needs. In Area 25 both SOB and SOK harvest occurred in
the northern and southern areas. Although significantly less than observed in the mid to late
1990’s, the SOK and SOB harvests in 2018 were the largest in over 10 years with many trees
having over 8 layers.

Stock status update

Analyses of stock trend information for AM2 are presented following methods of Cleary et al.
(2018) for the Pacific Herring major stocks. Perceptions of stock status based on outputs from the
SCA model (AM2) are summarized for each stock in a six-panel figure (e.g., Figure 6). The six
panels (a–f) include:

(a) Time series of MPD fits to spawn survey data in thousands of metric tonnes (t × 103 ). The
    spawn survey data (i.e., spawn index) is scaled to abundance via the spawn survey scaling
    parameter q. The spawn index has two distinct periods defined by the dominant survey

                                                 7
Pacific Region PRE-APPROVED Draft Science Response: Pacific Herring
method: surface surveys (1951 to 1987), and dive surveys (1988 to 2018). Two q parameters
are implemented in the estimation procedure: q1 with an uninformative prior and q2 with an
informative prior approximating 1.0.
(b) Time series of natural mortality (M ) estimates;
(c) Time series reconstruction of number of age-2 recruits;
(d) Time series of total catch and estimated spawning biomass with reference line at model
estimates of 0.3SB 0 ;
(e) Time series of (log) deviations from the estimated Beverton-Holt recruitment function
overlaid with a 3-year trailing moving average smoother; and
(f) Phase plot of spawning biomass production for the dive survey period (MPD estimates), with
reference line at model estimates of 0.3SB 0 .
Reference points
A biological limit reference point (LRP) is defined for the major Pacific Herring SARs at 0.3SB 0
(Kronlund et al., 2017). Candidate upper stock references (USR) were introduced in Cleary et al.
(2018) and implemented as biomass objectives in the simulation analyses for WCVI and SoG
(DFO, 2018).1 These are:
1. 0.4SB 0
2. 0.6SB 0
3. SB ave
4. SB ave−prod
Simulation results showed similar properties between USRs 0.6SB 0 and SB ave both within and
among SARs and the USR based on the average biomass in a productive period, SB ave−prod ,
was found to be most variable among SARs. The simulation-evaluations did not select a single
USR, however a USR of 0.6SB 0 is included in this stock status update because this candidate is
sufficiently above the LRP (2*LRP) and it is a repeatable calculation across all SARs. Stock
status relative to the assessment model estimates 0.3SB 0 (LRP) and 0.6SB 0 (USR) are
presented for each stock in Table 9 to Table 13.
The LRP and the USR relate stock status to the DFO PA Framework (DFO, 2009) and in this
assessment the same calculations are applied for each SAR. These reference points differ from
operational control points (OCPs) which are the biomass levels where management action is
taken (i.e., the inflection points of the harvest control rule (HCR). OCPs and HCRs differ among
SARs and are described below.
Haida Gwaii
Estimated spawning biomass declined to near historic lows in the mid-1990s and briefly
increased through the late 1990s before falling to persistent historic lows from 2000 to 2010
(Figure 6, panel d). A modest increase in estimated spawning biomass occurred during the early
2010s before falling once again to near historic lows over the most recent few years. The increase
can be attributed to increases in the survey biomass index in 2012 and 2014 (panel a) that were
supported by above average recruitment of age-2 fish in 2012 (panel c, d). An increasing trend in
8Pacific Region PRE-APPROVED Draft Science Response: Pacific Herring
the estimated natural mortality rate since 1980 (panel b) largely absorbed surplus production
attributable to any above average recruitment events (e.g., 1997 and 2012, panels c and d). In
particular, estimated natural mortality has increased sharply since the early 2010s following a
decline from a peak rate in the early 2000s. In most years since 2000, including the most recent
year between 2017 and 2018 spawning periods, the HG stock has persistently existed in a low
productivity, low biomass state which has precluded stock growth (panel f). Although an
increasing trend in weight-at-age has been observed since 2012 (Figure 3), this increase in
biomass per individual has not been sufficient to offset the lack of increased numbers of herring
(i.e., which implies there are larger but fewer herring individuals per tonne of spawners).
Estimated spawning biomass in 2018 is 4,032 t (SB 2018 , median posterior value) or 17.6% of SB 0
(Table 9). The 2018 spawning biomass is estimated to be at a historic low level, exceeded only by
more severe depletion levels following the stock collapse of the 1960s (Figure 6, panel d). Since
2000, the effective harvest rate, Ut , has been at or near zero (Figure 11), with the last commercial
roe fishery in 2002 and the last commercial SOK fishery in 2004. Spawning biomass in 2018 is
estimated to be less than the LRP of 0.3SB 0 with a 89.8% probability (Table 9).
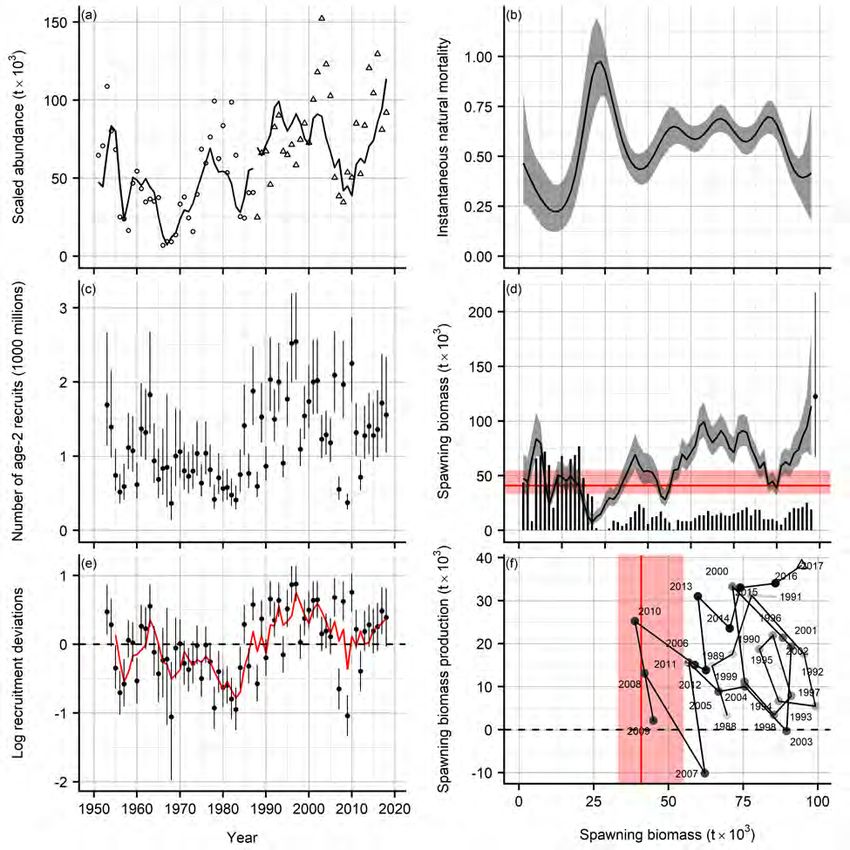
Prince Rupert District
Estimated spawning biomass recovered by the mid-1980s from historic low depletion levels
following the collapse of the 1960s, to about 50% of the historic high biomass estimated in the
early 1960s (Figure 7d). However, after the mid-1980s estimated spawning biomass steadily
declined before stabilizing at a relatively low level (but above historic lows) by the mid-2000s. The
estimated stock biomass has shown little trend from 2005 to 2018. Fluctuations in the trend in
spawning biomass appear to be less than those indicated for the other SARs, possibly because
some spawn index points are being under- or over-fit (e.g., 2001-2004, 2010, 2013) as shown in
Figure 7a. Estimated natural mortality reached historic highs in the late 1960s, before declining
through the late 1970s. Beginning in about 1980, estimated natural mortality increased through
to 2018, roughly doubling from 0.25 to 0.5 (Figure 7b). This trend in natural mortality coincides
with the decline in spawning biomass (Figure 7d); recruitment deviations have fluctuated around
0 without any strong positive or negative trending (Figure 7e). An above average age-2+
recruitment in 2014 and modest recruitment in 2016 have been unable to extract the stock from a
low biomass state (Figure 7f). Despite relatively low and stable levels of catch it appears the
estimated increase in natural mortality has absorbed the potential for positive higher surplus
production. An increasing trend in weight-at-age has been observed since about 2010, although
the change does not appear to be as large as in the CC, HG, SoG and WCVI SARs.
The model estimates spawning biomass in 2018, SB 2018 , at 16,635 t (posterior median), equal to
27.3% of SB 0 (Table 10). Commercial fisheries have occurred annually in PRD since the
mid-1980s during which the effective harvest rate, Ut , is estimated to be at or below 20%
(Figure 11), with the exception of 1989. Spawning biomass in 2018 is estimated to be less than
the LRP of 0.3SB 0 with a 60.4% probability (Table 10).
9Pacific Region PRE-APPROVED Draft Science Response: Pacific Herring
Central Coast
Estimated spawning biomass fluctuated around a strongly declining trend from a historic high
around 1980 before reaching a historic low level in the late 2000s (Figure 8d). An increase in
spawning stock biomass was estimated through the mid-2010s but remained below levels
estimated prior to 2000, and then declining modestly through to 2018. The estimated biomass
trend largely reflects the trend in the spawn index (Figure 8a), where fluctuations correspond in
opposite phase to the fluctuations in estimated natural mortality (Figure 8b). For example, the
decline in spawn index (and estimated spawning biomass) to the historic lows of the late 2000s
followed a strongly increasing trend in estimated natural mortality through the same period.
Estimated natural mortality moderated by the late 2000s, which was followed by the increase in
spawn index (and estimated spawning biomass) until 2015 whereupon natural mortality again
increased. Recruitment deviations have been slightly negative (lower than predicted by the
stock-recruit function) on average since about 1990 (Figure 8e). Production has tended to be
near zero or negative over recent years, although the stock does not appear to have lapsed back
to the low production, low biomass state observed during the late 2000s/early 2010s (Figure 8f).
However there is no evidence of strong production as observed, for example, during the
1990-1999 period.
Since implementing the current HCR in 1986, the effective harvest rate, Ut , is estimated to
fluctuate above and below the 20% target rate, with median estimates exceeding 20% frequently
Figure 11). Occurrences of Ut exceeding the 20% target rate are due in part to positive
assessment model errors.
Following a commercial fishery closure from 2007-2013, the CC stock reopened to commercial
fisheries in 2014 and small commercial roe fisheries occurred in 2014, 2015, and 2016. A
commercial SOK fishery has operated yearly since 2014, however these removals are not
included in the estimation of Ut .
The model estimates spawning biomass in 2018, SB 2018 , at 16,454 t (posterior median), equal to
30.9% of SB 0 (Table 11). Spawning biomass in 2018 is estimated to be less than the LRP of
0.3SB 0 with a 46.6% probability (Table 11).
Strait of Georgia
The SCA fit to the SoG stock and fishery monitoring data indicates the spawning biomass is at a
historic high although uncertainty associated with the terminal spawning biomass estimate is
large, as is the uncertainty associated with the forecast of SB 2019 (Figure 9d). The increasing
trend in estimated spawning biomass since about 2010 coincides with a decline in estimated
natural mortality that began in the late 2000s (Figure 9b). Estimated natural mortality has now
reached a level last estimated in the late 1970s as the stock recovered from the collapse of the
late 1960s. The large uncertainty of both spawning biomass and natural mortality estimates in
2018 may be in part a function of the decline in the spawn index from 2016 to 2018 following the
increase of the preceding few years (Figure 9a). The model fits an averaged trajectory through
the spawn index values of the 2010s and has, to date, insufficient information to determine if the
decline from 2016 to 2018 represents a decline in spawning biomass. It may require a few more
10Pacific Region PRE-APPROVED Draft Science Response: Pacific Herring
spawn index observations to resolve whether a change in spawning biomass trajectory has
recently occurred. The model estimates above average recruitment in most years from
2010-2018 (Figure 9c) with the recruitment deviations showing larger recruitment of age-2 fish
than expected from the stock-recruitment function (Figure 9e). The SoG is estimated to be in a
high production, high biomass state (Figure 9f).
Commercial fisheries have occurred annually in SoG since the early-1970s (following the stock
collapse of the late 1960s). Since implementing the current HCR in 1986, the effective harvest
rate, Ut , is estimated to fluctuate above and below the 20% target rate, with median estimates
exceeding 20% in 2005, 2006, 2013–2015, and 2017 (Figure 11). The model estimates spawning
biomass in 2018, SB 2018 , at 113,425 t (posterior median), equal to 82.3% of SB 0 (Table 12).
Spawning biomass in 2018 is estimated to be greater than the LRP of 0.3SB 0 with a 99.6%
probability.
West coast of Vancouver Island
The time series of estimated spawning biomass shows a decline from the late 1980s through to a
historic low in the 2000s (Figure 10d). The low estimated spawning biomass persisted through
the 2006-2013 period and has since slowly increased to a level similar to that estimated for 2000.
The model reconstruction of spawning biomass closely follows the trajectory of the spawn index
values (Figure 10a). The increase in spawning biomass from 2013 coincides with a decline in
estimated natural mortality from a historic high in the late 2000s (Figure 10b). Recruitment
deviations have been negative (lower than predicted by the stock-recruit function) on average
since about 2003 (Figure 10e), however the reduction in estimated natural mortality and absence
of removals from a commercial fishery appears to be sufficient to offset this below average
recruitment of age-2 fish. The absence of a commercial fishery since 2005 means the realized
harvest rate has been near zero for the last 13 years (Figure 11). Recent production estimates
are at a higher spawning biomass level than those estimated during the low production, low
biomass period of the last half of the 2000s and early 2010s (Figure 10f).
The model estimates spawning biomass in 2018, SB 2018 , at 23,335 t (posterior median), equal to
48.7% of SB 0 , (Table 13). Spawning biomass in 2018 is estimated to be greater than the LRP of
0.3SB 0 with a 91.2% probability (Table 13).
Management performance: effective harvest rate
Management procedure performance can be investigated using time series of effective harvest
rate. Ut represents the estimated effective harvest rate in each year t, calculated as Ut = SBCt +C
t
t
where Ct is catch in year t, and SB t is the estimated spawning biomass in year t. Times series of
Ut relative to target harvest rate of 20% are presented in Figure 11.
11Pacific Region PRE-APPROVED Draft Science Response: Pacific Herring
Harvest recommendations for 2019
Harvest advice for the major stocks of Pacific Herring has been based on a 1-year forecast of
pre-fishery spawning biomass and application of a harvest control rule that is a hybrid of fixed
escapement and a target harvest rate (e.g., Hall et al. (1988)). Although the target harvest rate
has varied among areas in recent years (e.g., CC and PRD SARs, IFMP ref here), the “historical”
practice was to apply a target harvest rate of 0.2 when the forecast is estimated to be above a
fixed commercial fishery cutoff of 0.25SB 0 defined in the 1996 stock assessment (DFO,
2016).
Provision of harvest advice was changed to a decision table format in 2012, providing
probabilistic advice to managers for consultation and decision-making. Decision tables report the
probability of being above (or below) management parameters of interest for a range of catch
levels using one-year-ahead projections. In Cleary et al. (2018) projected spawning biomass in
2018 relative to the LRP (0.3SB 0 ) was added to decision tables for the five major Pacific Herring
stocks. The 2018 decision tables report the probability spawning biomass is below the LRP
(P(SB 2018 < 0.3SB 0 )), the probability of 2018 biomass is below the 1996 fixed commercial fishery
cutoff, and the probabilities of the harvest rate exceeding 10% or 20% in 2018 for a range of
commercial catch levels including 0 catch.
Renewal of the Pacific Herring management framework included a commitment to
simulation-evaluation of the performance of the historical and alternative management
procedures using MSE and the first cycle of the MSE process was completed for the WCVI and
SoG SARs in July 2018 (DFO, 2018).1 These two areas were selected for evaluation because
they exhibit contrasting stock and fishery states that encompass the range of stock conditions
observed elsewhere in BC.
Several lessons were learned from the analysis:
1. The catch-at-age stock assessment model can produce large (positive) assessment errors.
Such assessment errors cause over-estimation of spawning biomass and result in
recommended catch limits such that the realized harvest rate exceeds the intended target
specified by a harvest control rule (e.g., over-harvest).
2. Reduction in harvest rate from 20% to 10% was the most effective means of mitigating stock
assessment errors by reducing the absolute size of the catch. The use of a catch cap,
implemented as a maximum annual catch level, was an effective model-free way to further
mitigate assessment errors. Simulation analyses additionally showed that outcomes are
insensitive to the choice of operational control points (OCPs) in the HCR when low HR and
catch cap are applied. This is because low biomass levels (associated with the lower OCP)
are avoided for these MPs.
3. Differences in specification of Pacific Herring management procedures, including the HCR
components, are expected a priori among SARs. The reasons relate to differences in
objectives deemed important by resource users, differences in historical and current stock
and fishery dynamics, and differences in the magnitude and direction of assessment model
errors in each area. Conservation objectives such as those based on avoiding a threshold to
serious harm (i.e., a limit reference point) in alignment with the DFO PA Framework (DFO,
2009) are held constant among SARs based on the analyses of Kronlund et al. (2017).
12Pacific Region PRE-APPROVED Draft Science Response: Pacific Herring
Harvest advice in 2019 for the SoG and WCVI SARs is guided by the results of the
simulation-evaluation completed in the first MSE cycle. In the absence of area-specific
simulation-evaluation analyses for the CC, HG and PRD SARs, harvest advice for these areas is
provided in the form of decision tables following Cleary et al. (2018). Details of harvest advice are
provided below for each of the major SARs.
HG
The HG stock has persisted in a low biomass, low productivity state in since 2000, remaining
below the LRP for much of that period and shows little evidence of sustained stock growth
despite the absence of commercial fisheries since 2002 (2004 for the SOK fishery). In the
absence of fishing, spawning biomass in 2019 is forecast at 4,966 t. The projected spawning
biomass in 2019 is forecast to be below 0.3SB 0 with 72.7% probability in the absence of fishing
(Table 9 and Figure 12).
The DFO has committed to develop and implement a rebuilding plan for Haida Gwaii Pacific
Herring by the end of fiscal year 2020/21.2 Guidance for the Development of Rebuilding Plans
under the Precautionary Approach Framework: Growing Stocks out of the Critical Zone (DFO,
2013) states the primary objective of any rebuilding plan is to promote stock growth out of the
Critical Zone (i.e., to grow the stock above the status-based LRP) by ensuring removals from all
fishing sources are kept to the lowest possible level until the stock has cleared this zone with high
probability. Stock rebuilding does not end having met this goal, however, and one of the goals of
the rebuilding plan will be to identify candidate threshold biomass levels greater than the LRP that
are consistent with a rebuilt state.
As such, the commercial harvest recommendation for HG stock in 2019 is 0 t.
PRD
In the absence of PRD-specific simulation testing of HCRs, harvest options for 2019 are
presented as probabilistic decision tables, based on Cleary et al. (2018), and include total
allowable catch (TAC) options relative to 10% and 20% target harvest rates, as well as projected
spawning biomass relative to the assessment model estimate of the LRP (for each TAC level)
(Table 14). Effective harvest rates for the past 10-years average ∼ 12% (Figure 11), during which
the stock shows no sign of growth and is estimated to fluctuate at or near 0.3SB 0 (Figure 7d).
Furthermore, adjacent SARs (HG and CC) show evidence of recent prolonged periods of low
biomass and low productivity: states that were entered rapidly and were preceeded by high
biomass levels Kronlund et al. (2017).
In the absence of fishing, spawning biomass in 2019 is forecast to increase from 16,635 t in 2018
to an estimated 19,347 t (posterior medians). The forecast spawning biomass in 2019 is
2
In response to recommendations in the Commissioner of the Environment and Sustainable Development (CESD)
October 2016 Report 2 - Sustaining Canada’s Major Fish Stocks - Fisheries and Oceans Canada, the Department will
develop rebuilding plans for major fish stocks that are in the precautionary approach critical zone, including Haida Gwaii
Pacific Herring by the end of fiscal year 2020/21.
13Pacific Region PRE-APPROVED Draft Science Response: Pacific Herring
estimated to be below the LRP of 0.3SB 0 with 43.3% probability in the absence of fishing
(Table 10).
For PRD, the 2019 decision table includes the following columns, with TAC ranging from 0 to
3,000 t (Table 14):
1. 2019 TAC (t),
2. P(SB 2019 < 0.3SB 0 ),
3. Med(SB 2019 /0.3SB 0 ),
4. P(U2019 > 20%),
5. P(U2019 > 10%), and
6. Med(U2019 ).
The following modification from Cleary et al. (2018) is made:
1. Removal of SB 2019 relative to fixed 1996 cutoffs.
The fixed cutoff values are removed from the 2018 decision table because they were calculated
outside of the current assessment model, last updated in 1996, and therefore ignore 22 years of
stock and fishery monitoring data and substantial changes to the structural form of the
assessment model.
CC
Due to the absence of CC-specific simulation testing of HCRs, options for CC SAR follow the
same step as PRD. Harvest recommendations for CC stock are presented as a probabilistic
decision table (Table 15) following the description and caveats presented above for PRD. The
decision table for CC includes a catch stream from 0 t to 3,000 t, showing the probability of
SB 2019 falling below the LRP to increase with increasing catches.
In the absence of fishing, spawning biomass in 2019 is forecast at 18,267 t (posterior median),
increasing from 16,454 t in 2018 (Table 11). The 2019 spawning biomass is forecast to be below
the LRP of 0.3SB 0 with 37.1% probability in the absence of fishing.
SoG
Closed-loop feedback simulations for the SoG evaluated alternative management procedures
(MPs) that differed only in the configuration of the harvest control rule (HCR) and application of a
fixed catch cap (DFO, 2018).1 Results showed that all tested management procedures could
maintain the spawning biomass above the LRP with 91% probability or higher, including the
historical HCR which applied a constant escapement of 21,200 t based on the 1996 stock
assessment and 20% harvest rate. A 30,000 t catch cap was evaluated for the SoG; this cap was
not often triggered, and thus did not limit the commercial fishery very often in simulations.
Management procedures that included a 30,000 t catch cap were able to maintain spawning
biomass above a biomass level of 0.6SB 0 with 60% probability or higher. The purpose of the
catch cap is to provide a model-free means of mitigating against the effects of large positive
14Pacific Region PRE-APPROVED Draft Science Response: Pacific Herring
assessment errors that lead to a higher realized harvest rate than intended, i.e., harvest rates
that exceed 20%. Simulations showed that such assessment errors can occur when fitting the
SCA model to SoG stock assessment data. Meeting the conservation objective of maintaining a
high probability of exceeding the LRP does not mean the SoG is immune to stock decline. Future
simulation-evaluation may suggest adjustment of the catch cap is necessary to acceptably meet
additional stock and fishery objectives.
Management procedures evaluated included segmented HCRs of the form indicated in the DFO
PA Framework with a lower operational control point (OCP) at the assessment model estimate of
0.3SB 0 and an upper control point at the assessment model estimate of 0.6SB 0 . Discontinuing the
use of fixed cutoffs and adopting a HCR with two OCPs is recommended for these reasons:
1. The fixed cutoff values were calculated outside of the current assessment model, last
updated in 1996, and therefore ignore 22 years of stock and fishery monitoring data and
substantial changes to the structural form of the assessment model; and
2. Use of separate lower and upper OCPs allows for altering the slope of the ramp portion of
the HCR to better meet stock and fishery objectives by avoiding fishery closures and
encouraging stock growth as more is learned about stock dynamics and the effects of fishing.
Harvest recommendations for SoG stock are provided by application of a management procedure
that utilizes stock assessment estimates of forecast spawning biomass and operational control
points at (0.3, 0.6) of SB 0 with a 20% target harvest rate, and a maximum catch cap of 30,000 t
(DFO, 2018, Figure 4).1 The 2019 recommended catch calculated by applying the MP is
25,791 t.
WCVI
Closed-loop feedback simulations for WCVI evaluated alternative management procedures (MPs)
that differed only in the configuration of the harvest control rule (HCR) and application of a fixed
catch cap (DFO, 2018).1 Results showed that no tested management procedure could meet the
conservation objective of maintaining spawning biomass above the LRP with high probability (at
least 75%)3 across the three future natural mortality (M ) scenarios. In addition, for the scenario
where M is most similar to the last 10-years (density-independent-M ) the historical HCR can
only meet the conservation objective 56% of the time.
Of the MPs that were simulation-tested across the three M scenarios, the “best-performing” HCR
maintained spawning biomass above the LRP with a 74% probability. This HCR implements a
lower OCP at the assessment model estimate of 0.5SB 0 , a 10% target harvest rate, and a
maximum catch cap of 2,000 t.
Using a HCR with OCPs at (0.5, 0.6) of SB 0 , a 10% target harvest rate, and a maximum catch
cap of 2,000 t, the 2019 catch calculation is 671 t.
Given the best performing MP for the WCVI did not meet the minimum “high” probability of 75%,
further simulation-testing of HCRs that include additional measures to ensure persistent stock
growth away from the critical zone and towards identified biomass targets may be required. For
3
“High” probability is defined as 75-95% by the DFO Decision-making framework (DFO, 2009)
15Pacific Region PRE-APPROVED Draft Science Response: Pacific Herring
example, for a rebuilding stock a "slow-up" MP would be designed to delay fishery openings for
an additional predefined number of years (e.g., 3-5) when the spawning biomass is estimated to
be above the lower OCP in order to provide higher confidence of stock growth. The WCVI survey
data and model estimates of spawning biomass (Figure 10a,d) show the increasing trajectory for
WCVI herring as both gradual and erratic. The 2018 assessment estimates WCVI spawning
biomass to be above the LRP in 2015-2018 (based on posterior medians), however this
perspective based on stock assessment model estimates does not take into consideration
positive assessment model errors. Thus simulation-evaluation of a "slow-up" MP is needed to
identify the number of closure years needed to support continual stock growth.
MPs designed to delay reopening of commercial fisheries following prolonged low biomass states
will allow evidence of persistent stock growth to accrue, reducing the potential for assessment
errors or underlying population dynamics (i.e., increasing natural mortality) to cause the
spawning biomass to lapse back to a low production, low biomass state.
Such MPs could also be evaluated for the HG stock during development of the rebuilding
plan.
Conclusions
The 2018 Science Response includes a formal analyses of stock trend information for the Pacific
Herring major SARs using the stock assessment framework reviewed in 2017 (Cleary et al.,
2018). Harvest recommendations for 2019 for PRD and CC include updated probabilistic
decision tables relating forecast spawning biomass to the LRP of 0.3SB 0 , and a candidate USR
of 0.6SB 0 . Harvest recommendations for SoG and WCVI adopt recommendations from
simulation analyses conducted as part of the Management Strategy Evaluation (DFO, 2018).1
The DFO has committed to develop and implement a rebuilding plan for Pacific Herring in HG by
the end of fiscal year 2020/21, thus a commercial closure is recommended for this SAR.
Science advice for the minor SARs is limited to presentation of catch data, biological data, and
spawn survey data.
Contributors
Contributor Affiliation
Jaclyn Cleary DFO Science, Pacific Region
Matthew Grinnell DFO Science, Pacific Region
Allen Kronlund DFO Science, Ottawa
Chris Grandin DFO Science, Pacific Region
Roger Kanno (reviewer) DFO Fisheries Management, Pacific Region
16Pacific Region PRE-APPROVED Draft Science Response: Pacific Herring
Approved by
Carmel Lowe
Regional Director
Science Branch, Pacific Region
Fisheries and Oceans Canada
October XX, 2018
Sources of information
Cleary, J.S., Hawkshaw, S., Grinnell, M.H. and Grandin, C. 2018. Status of B.C. Pacific Herring
(Clupea pallasii) in 2017 and forecasts for 2018. Research Document 2018/028, Canadian
Science Advisory Secretariat, Fisheries and Oceans Canada. In press.
DFO. 2009. A fishery decision-making framework incorporating the Precautionary Approach (last
reportedly modified 23 May 2009, though figures have since changed).
DFO. 2012. A review of the Pacific herring assessment framework and stock assessment and
management advice for Pacific herring 2011 status and 2012 forecasts. DFO Can. Sci. Advis.
Sec. Proceed 2011/062. vi + 38p.
DFO. 2013. Guidance for the development of rebuilding plans under the precautionary approach
framework: Growing stocks out of the critical zone. Sustainable fisheries framework (SFF): A
fishery decision-making framework incorporating the precautionary approach .
DFO. 2016. Stock assessment and management advice for B.C. Pacific Herring: 2016 status and
2017 forecast. Science Response 2016/052, Canadian Science Advisory Secretariat,
Fisheries and Oceans Canada.
Hall, D.L., Hilborn, R., Stocker, M. and Walters, C.J. 1988. Alternative harvest strategies for
Pacific herring (Clupea harengus pallasi). Can. J. Fish. Aquat. Sci 45. 88S897.
Kronlund, A.R., Forrest, R.E., Cleary, J.S. and Grinnell, M.H. 2017. The selection and role of limit
reference points for Pacific Herring (Clupea pallasii) in British Columbia, Canada. Can. Sci.
Advis. Sec. Res. Doc. 2017/xxx. viii + xxp.
Martell, S.J., Cleary, J. and Haist, V. 2012. Moving towards the sustainable fisheries framework
for Pacific Herring: data, models, and alternative assumptions; stock assessment and
management advice for the British Columbia Pacific Herring stocks: 2011 assessment and
2012 forecasts. DFO Can. Sci. Advis. Sec. Res. Doc. 2011/nnn. v + 136–151.
Appendix
We do not conduct formal analyses of stock trend information for the two Pacific Herring minor
SARs (Area 27 and Area 2 West). However, we do provide time series of landed commercial
17Pacific Region PRE-APPROVED Draft Science Response: Pacific Herring
catch (Figure 13), biological data including weight-at-age (Figure 14) and proportion-at-age
(Figure 15), as well as the spawn index (Figure 16) from 1978 to 2018.
18Pacific Region PRE-APPROVED Draft Science Response: Pacific Herring
This report is available from the
Centre for Science Advice
Pacific Region
Fisheries and Oceans Canada
3190 Hammond Bay Road
Nanaimo, BC V9T 6N7
Telephone: (250) 756-7208
E-Mail: csap@dfo-mpo.gc.ca
Internet address: www.dfo-mpo.gc.ca/csas-sccs/
ISSN 1919-3769
© Her Majesty the Queen in Right of Canada, 2018
Correct citation for this publication:
DFO. 2018. PRE-APPROVED DRAFT: Status of Pacific Herring (Clupea pallasii) in 2018 and
forecast for 2019. DFO Can. Sci. Advis. Sec. Sci. Resp. 2018/nnn.
Aussi disponible en français:
MPO. 2018. Évaluation des stocks de hareng du Pacifique ( Clupea pallasii) en 2018 et prévision
pour 2019. Secr. can. de consult. sci. du MPO, Rép. des Sci. 2018/nnn.
19Pacific Region PRE-APPROVED Draft Science Response: Pacific Herring
Tables
Table 1. Input data for the 2018 Pacific Herring stock assessment. The spawn index has two distinct
periods defined by the dominant survey method: surface surveys (1951 to 1987), and dive surveys (1988
to 2018). The ‘spawn index’ represents the raw survey data only, and is not scaled by the spawn survey
scaling parameter, q.
Source Data Years
Roe gillnet fishery Catch 1972 to 2018
Roe seine fishery Catch 1972 to 2018
Other fisheries Catch 1951 to 2018
Test fishery (seine) Biological: number-at-age 1975 to 2018
Test fishery (seine) Biological: weight-at-age 1975 to 2018
Roe seine fishery Biological: number-at-age 1972 to 2018
Roe seine fishery Biological: weight-at-age 1972 to 2018
Roe gillnet fishery Biological: number-at-age 1972 to 2018
Other fisheries Biological: number-at-age 1951 to 2018
Other fisheries Biological: weight-at-age 1951 to 2018
Surface survey Abundance: spawn index 1951 to 1987
Dive survey Abundance: spawn index 1988 to 2018
Table 2. Total landed catch in tonnes of Pacific Herring in the major stock assessment areas. Legend:
Haida Gwaii (HG), Prince Rupert District (PRD), Central Coast (CC), Strait of Georgia (SoG), and West
Coast of Vancouver Island (WCVI). Note: ‘WP’ indicates that data are withheld due to privacy concerns.
Year HG PRD CC SoG WCVI
2009 0 1,999 0 10,169 0
2010 0 1,485 0 8,323 0
2011 0 2,147 0 5,128 0
2012 0 1,383 0 11,339 0
2013 0 2,027 0 16,547 0
2014 0 2,003 687 20,310 0
2015 0 2,163 626 19,968 0
2016 0 2,425 213 21,310 0
2017 0 2,849 0 25,279 0
2018 0 417 0 19,067 0
20Pacific Region PRE-APPROVED Draft Science Response: Pacific Herring
Table 3. Total spawn-on-kelp harvest in pounds of Pacific Herring in the major stock assessment areas.
Legend: Haida Gwaii (HG), Prince Rupert District (PRD), Central Coast (CC), Strait of Georgia (SoG), and
West Coast of Vancouver Island (WCVI). Note: ‘WP’ indicates that data are withheld due to privacy
concerns.
Year HG PRD CC SoG WCVI
2009 0 158,198 0 0 0
2010 0 108,834 0 0 0
2011 0 123,626 0 0 0
2012 0 87,494 0 0 0
2013 0 72,895 0 0 0
2014 0 113,269 239,861 0 0
2015 0 84,066 169,470 0 0
2016 0 WP 351,952 0 0
2017 0 82,597 392,746 0 0
2018 0 20,832 286,108 0 0
Table 4. Spawn index in tonnes (t), and proportion of the spawn index by Statistical Area for Pacific Herring
in the Haida Gwaii major stock assessment region. The spawn index is the annual total for the earliest
year indicated in the ‘Year(s)’ column. Proportions indicate the proportion by year, or mean proportion over
years, where year(s) are specified in the ‘Year(s)’ column. The ‘spawn index’ represents the raw survey
data only, and is not scaled by the spawn survey scaling parameter, q.
Year(s) Spawn index (t) 06 21&25 23 24
2018 4,588 0.000 0.766 0.000 0.234
2017 3,016 0.000 0.982 0.000 0.018
2016 6,888 0.000 0.947 0.000 0.053
2015 13,102 0.000 0.940 0.000 0.060
2014 10,566 0.000 0.932 0.000 0.068
2013 to 2018 16,025 0.013 0.905 0.001 0.080
2012 to 2018 9,720 0.014 0.893 0.001 0.091
2011 to 2018 7,554 0.016 0.875 0.001 0.108
2010 to 2018 6,845 0.016 0.851 0.001 0.132
2009 to 2018 9,794 0.015 0.855 0.001 0.130
21Pacific Region PRE-APPROVED Draft Science Response: Pacific Herring
Table 5. Spawn index in tonnes (t), and proportion of the spawn index by Statistical Area for Pacific Herring
in the Prince Rupert District major stock assessment region. Caption as per 4.
Year(s) Spawn index (t) 03 04 05
2018 14,155 0.057 0.667 0.277
2017 19,235 0.052 0.632 0.317
2016 18,985 0.007 0.808 0.185
2015 17,407 0.056 0.756 0.188
2014 17,125 0.148 0.595 0.257
2013 to 2018 25,755 0.058 0.701 0.241
2012 to 2018 22,716 0.055 0.712 0.234
2011 to 2018 21,097 0.051 0.717 0.232
2010 to 2018 28,607 0.049 0.720 0.231
2009 to 2018 11,961 0.045 0.740 0.215
Table 6. Spawn index in tonnes (t), and proportion of the spawn index by Statistical Area for Pacific Herring
in the Central Coast major stock assessment region. The spawn index is the annual total for the earliest
year indicated in the ‘Year(s)’ column. Proportions indicate the proportion by year, or mean proportion over
years, where year(s) are specified in the ‘Year(s)’ column. The ‘spawn index’ represents the raw survey
data only, and is not scaled by the spawn survey scaling parameter, q.
Year(s) Spawn index (t) 06 07 08
2018 12,264 0.322 0.626 0.052
2017 23,517 0.359 0.584 0.057
2016 32,508 0.245 0.726 0.028
2015 32,146 0.223 0.706 0.072
2014 13,309 0.287 0.673 0.040
2013 to 2018 20,369 0.276 0.682 0.042
2012 to 2018 7,592 0.267 0.667 0.066
2011 to 2018 10,534 0.264 0.664 0.072
2010 to 2018 8,671 0.268 0.657 0.074
2009 to 2018 10,771 0.293 0.638 0.068
22Pacific Region PRE-APPROVED Draft Science Response: Pacific Herring
Table 7. Spawn index in tonnes (t), and proportion of the spawn index by Group for Pacific Herring in the
Strait of Georgia major stock assessment region. The spawn index is the annual total for the earliest year
indicated in the ‘Year(s)’ column. Proportions indicate the proportion by year, or mean proportion over
years, where year(s) are specified in the ‘Year(s)’ column. Legend: ‘14&17’ is Statistical Areas 14 and 17
(excluding Section 173); ‘ESoG’ is eastern Strait of Georgia; ‘Lazo’ is above Cape Lazo; and ‘SDodd’ is
South of Dodd Narrows The ‘spawn index’ represents the raw survey data only, and is not scaled by the
spawn survey scaling parameter, q.
Year(s) Spawn index (t) 14&17 ESoG Lazo SDodd
2018 91,939 0.984 0.001 0.014 0.000
2017 81,064 0.806 0.000 0.194 0.000
2016 129,502 0.902 0.000 0.090 0.009
2015 104,481 0.525 0.014 0.354 0.106
2014 120,468 0.758 0.020 0.212 0.010
2013 to 2018 83,693 0.817 0.006 0.153 0.023
2012 to 2018 52,636 0.823 0.006 0.143 0.028
2011 to 2018 85,001 0.843 0.006 0.126 0.026
2010 to 2018 50,454 0.848 0.005 0.112 0.036
2009 to 2018 53,652 0.855 0.004 0.101 0.040
Table 8. Spawn index in tonnes (t), and proportion of the spawn index by Statistical Area for Pacific Herring
in the West Coast of Vancouver Island major stock assessment region. The spawn index is the annual total
for the earliest year indicated in the ‘Year(s)’ column. Proportions indicate the proportion by year, or mean
proportion over years, where year(s) are specified in the ‘Year(s)’ column. The ‘spawn index’ represents
the raw survey data only, and is not scaled by the spawn survey scaling parameter, q.
Year(s) Spawn index (t) 23 24 25
2018 28,107 0.331 0.194 0.475
2017 15,734 0.335 0.097 0.568
2016 20,528 0.577 0.266 0.157
2015 11,323 0.372 0.185 0.442
2014 13,937 0.631 0.093 0.276
2013 to 2018 12,258 0.431 0.150 0.420
2012 to 2018 5,407 0.379 0.181 0.440
2011 to 2018 9,663 0.365 0.195 0.440
2010 to 2018 2,464 0.374 0.183 0.443
2009 to 2018 10,607 0.391 0.177 0.432
23You can also read