WIFI, LTE, OR BOTH? MEASURING MULTI-HOMED WIRELESS INTERNET PERFORMANCE
←
→
Page content transcription
If your browser does not render page correctly, please read the page content below
WiFi, LTE, or Both? Measuring Multi-Homed Wireless
                        Internet Performance

                         Shuo Deng, Ravi Netravali, Anirudh Sivaraman, Hari Balakrishnan
                                            MIT Computer Science and Artificial Intelligence Lab
                                                   Cambridge, Massachusetts, U.S.A.
                                         {shuodeng, ravinet, anirudh, hari}@csail.mit.edu

ABSTRACT                                                                          K EYWORDS
Over the past two or three years, wireless cellular networks have be-             Multi-Network, Mobile Device, LTE, Multi-Path TCP
come faster than before, most notably due to the deployment of LTE,
HSPA+, and other similar networks. LTE throughputs can reach                      1.     I NTRODUCTION
many megabits per second and can even rival WiFi throughputs in                      Access to WiFi and cellular wireless networks are de rigueur
some locations. This paper addresses a fundamental question con-                  on mobile devices today. With the emergence of LTE, cellular
fronting transport and application-layer protocol designers: which                performance is starting to rival the performance of WiFi. Moreover,
network should an application use? WiFi, LTE, or Multi-Path TCP                   when WiFi signal quality is low or in crowded settings, the anecdotal
(MPTCP) running over both?                                                        experience of many users is that cellular performance may in fact be
   We compare LTE and WiFi for transfers of different sizes along                 considerably better than WiFi performance.
both directions (i.e. the uplink and the downlink) using a crowd-                    But just how good are LTE and WiFi networks in practice and
sourced mobile application run by 750 users over 180 days in 16                   how do they compare with each other? Should applications and
different countries. We find that LTE outperforms WiFi 40% of the                 transport protocols strive to select the best network, or should they
time, which is a higher fraction than one might expect at first sight.            simply always use Multi-Path TCP (MPTCP) [21]? This paper seeks
   We measure flow-level MPTCP performance and compare it with                    to answer these questions empirically.
the performance of TCP running over exclusively WiFi or LTE                          To answer these questions, we implemented a crowd-sourced
in 20 different locations across 7 cities in the United States. For               network measurement tool (Section 2) to understand the flow-level
short flows, we find that MPTCP performs worse than regular TCP                   performance of TCP over WiFi and LTE in the wild from 16 different
running over the faster link; further, selecting the correct network              countries over a 6-month period, encompassing 3624 distinct 1-
for the primary subflow in MPTCP is critical in achieving good                    MegaByte TCP flows. We used this data to measure transfer times
performance. For long flows, however, selecting the proper MPTCP                  for different amounts of data transferred.
congestion control algorithm is equally important.                                   MPTCP isn’t widely deployed yet on most phones1 . As a result,
   To complement our flow-level analysis, we analyze the traffic                  we manually measured flow-level MPTCP performance and com-
patterns of several mobile apps, finding that apps can be categorized             pared it with the performance of TCP running over exclusively WiFi
as “short-flow dominated” or “long-flow dominated”. We then record                or LTE in 20 different locations, in 7 cities in the United States (Sec-
and replay these patterns over emulated WiFi and LTE links. We find               tion 3). Finally, to complement our empirical flow-level analysis, we
that application performance has a similar dependence on the choice               used an existing record-and-replay tool to analyze (Section 4) and
of networks as flow-level performance: an application dominated                   run (Section 5) mobile apps on emulated cellular and WiFi links,
by short flows sees little gain from MPTCP, while an application                  using it to study the impact of network selection on application
with longer flows can benefit much more from MPTCP — if the                       performance.
application can pick the right network for the primary subflow and                   Our key findings are as follows:
the right choice of MPTCP congestion control.                                         1. Cellular networks outperform WiFi around 40% of the time in
                                                                                         our data set (Figure 3), a proportion considerably higher than
C ATEGORIES AND S UBJECT D ESCRIPTORS                                                    we had hypothesized.
C.2.3 [Computer-Communication Networks]: Network Opera-                               2. For short flows (100 KB or lower), MPTCP performs worse
tions—Network Management; C.2.1 [Computer-Communication                                  than TCP (Figure 7b). Further, it is crucial to select the proper
Networks]: Network Architecture and Design—Wireless Commu-                               network for the primary MPTCP subflow2 . For instance, on
nication; C.4 [Performance of System]: Measurement techniques,                           a 10 KB flow, we found that the choice of the network for
Performance attributes                                                                   the primary subflow can affect MPTCP throughput by upto
Permission to make digital or hard copies of all or part of this work for                60% (Figure 8). For long flows, selecting the proper conges-
personal or classroom use is granted without fee provided that copies are not            tion control algorithm is also important: for a 1 MB flow, for
made or distributed for profit or commercial advantage and that copies bear              instance, modifying only the congestion control algorithm,
this notice and the full citation on the first page. Copyrights for components           while keeping the network used by the primary subflow fixed
of this work owned by others than ACM must be honored. Abstracting with                  changes MPTCP throughput by 34% (Figures 13 and 14). On
credit is permitted. To copy otherwise, or republish, to post on servers or to
                                                                                         the other hand, modifying only the network used by the pri-
redistribute to lists, requires prior specific permission and/or a fee. Request
permissions from permissions@acm.org.                                             1 The
IMC’14, November 5–7, 2014, Vancouver, BC, Canada.                                       Apple iOS is an exception [13].
                                                                                  2 For a description of subflow and other MPTCP-related terms, we
Copyright 2014 ACM 978-1-4503-3213-2/14/11$15.00.
http://dx.doi.org/10.1145/2663716.2663727.                                        refer the reader to Section 3.1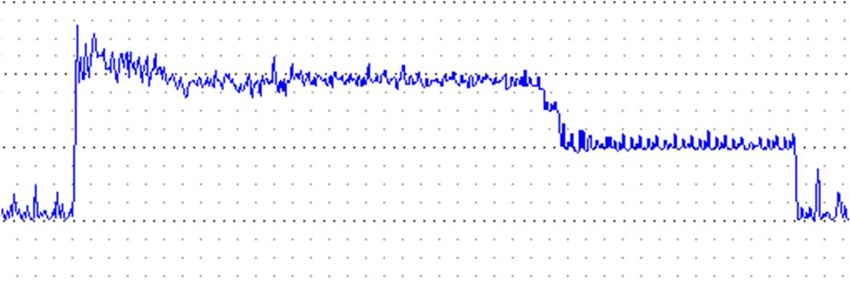
① Start Measurement

                                                                                                              No
                                                                                             WiFi on?                    Turn WiFi on

                                                                                                  Yes

                                                                                              WiFi                 No     Scan and
                                                                                           Associated?                    Associate

                                                                                                  Yes
                                                                                                             Yes
                                                                                                                          Success?

                                                                                         ② Measure WiFi
                                                                                                                                No
               Figure 1: Cell vs WiFi User Interface.
                                                                                           Turn WiFi off

      mary subflow, while keeping the congestion-control algorithm                           Cellular               No

      fixed, changes throughput by 25%. (Figure 14)                                         Available?

   3. Mobile app traffic patterns largely fall into two groups (Fig-                              Yes
      ure 17). We refer to apps that tend to open several connections,
      each transferring small amounts of data, as short-flow dom-                       ③ Measure Cellular
                                                                                           Networks
      inated apps, and we refer to apps that have fewer number
      of connections but transfer large amounts of data on each as
      long-flow dominated apps.                                                                                     No
   4. For short-flow dominated apps, MPTCP does not outperform                                WiFi
                                                                                            Available?
      the best conventional “single-path” TCP (over either Wi-Fi
      or LTE) (Figures 18 and 19). However, it is important to                                    Yes
      choose the correct network for standard TCP. Our emulation
      shows that selecting the proper network for single-path TCP                          Turn WiFi on
      can reduce response time by 50% compared to the minimum
      of the single-path TCP throughputs on LTE and WiFi. On the
      other hand, using MPTCP reduces application response time                           ④ Upload Data
      by only 35%.
   5. For long-flow dominated apps, MPTCP does help markedly,
      provided the appropriate congestion-control algorithm is used          Figure 2: Cell vs WiFi: single measurement collection run.
      and the two links have roughly comparable speeds: our emula-
      tion shows that using single path TCP with the correct choice
      of network reduces application response time by 42%, while
      using MPTCP with the proper congestion control can also
      reduce response time by about 50% (Figures 20 and 21).             data that the app can consume; especially for devices on a limited
  Our crowd-sourced network measurement tool, Cell vs WiFi, is           cellular data plan.
available for Android in the Google Play Store. All our measurement         The flow chart in Figure 2 shows a single measurement-collection
data and analysis tools are available at http://web.mit.edu/             run. When the user clicks the Start button or the pre-set periodic
cell-vs-wifi/.                                                           measurement timer expires, one run of measurement collection starts,
                                                                         shown as Step 1 in the figure. If WiFi is available and the phone
2.    C ELL VS W I F I M EASUREMENT                                      successfully associates with an Access Point (AP), Cell vs WiFi
   In September 2013, we published an Android app on Google Play,        collects packet-level tcpdump traces for a 1 Mbyte TCP upload and
called Cell vs WiFi (http://web.mit.edu/cell-vs-wifi).                   a 1 Mbyte TCP download between the mobile device and our server
Cell vs WiFi measures end-to-end WiFi and cellular network per-          at MIT.
formance and uses these measurements to tell smartphone users if            After measuring WiFi, Cell vs WiFi turns off the WiFi interface
they should be using the cellular network or WiFi at the current time    on the phone and attempts to automatically connect to the cellular
and location. The app also serves as a crowd-sourced measurement         network. If the user has turned off the cellular data network, Cell vs
tool by uploading detailed measurement data to our server including      WiFi aborts the cellular measurement. If Cell vs WiFi successfully
packet-level traces. Over a nine-month period since the app was          connects to the cellular network, then in Step 3 , it collects a similar
published, it attracted over 750 downloads. We collected over 10         set of packet-level tcpdump traces for both an upload and a download.
GB of measurement data from 3632 distinct TCP connections over           Once both WiFi and cellular network measurements are finished,
this duration from these users.                                          in Step 4 , Cell vs WiFi uploads the data collected during this
                                                                         measurement run, together with the user ID (randomly generated
2.1   Cell vs WiFi App                                                   when a smartphone user uses the app for the first time), and the
   Figure 1 shows the user interface of Cell vs WiFi. Users can          phone’s geographic location, to our server at MIT.
choose to measure network performance periodically, or once per             More information about Cell vs WiFi can be found at http:
click. Users can also set an upper bound on the amount of cellular       //web.mit.edu/cell-vs-wifi.
2.2   Results
                                                                                  1.0
     Location Name            (Lat, Long)    # of Runs    LTE %                   0.8
    US (Boston, MA)          (42.4, -71.1)         884      10%
          Israel              (31.8, 35.0)         276      55%                   0.6

                                                                            CDF
      US (Portland)         (45.6, -122.7)         164      45%
         Estonia              (59.4, 27.4)         124      71%                   0.4
       South Korea           (37.5, 126.9)         108      66%
      US (Orlando)           (28.4, -81.4)          92      35%                   0.2
       US (Miami)            (26.0, -80.2)          84      52%
        Malaysia             (4.24, 103.4)          76      68%                      0
          Brazil            (-23.6, -46.8)          56       4%                       -15 -10 -5 0 5 10 15 20 25
        Germany               (52.5, 13.3)          40      20%
                                                                                         Tput(WiFi) - Tput(LTE) (mbps)
          Spain              (28.0, -16.7)          40      80%
    Thailand (Phichit)       (16.1, 100.2)          40      80%                                      (a) Uplink
     US (New York)           (40.9, -73.8)          24      33%
          Japan              (36.4, 139.3)          16      25%                   1.0
         Sweden               (59.6, 18.6)          16       0%
  Thailand (Chiang Mai)       (18.8, 99.0)          16      75%                   0.8
      US (Chicago)           (42.0, -88.2)          16      25%
                                                                                  0.6

                                                                            CDF
         Hungary              (47.4, 16.8)           8       0%
           Italy               (44.2, 8.3)           8       0%
                                                                                  0.4
   US (Salt Lake City)      (40.8, -111.9)           8       0%
        Colombia              (7.1, -70.7)           4       0%
                                                                                  0.2
      US (Santa Fe)         (35.9, -106.3)           4       0%
                                                                                     0
Table 1: Geographical coverage and diversity of the crowd-sourced                     -15 -10 -5 0 5 10 15 20 25
data collected from 16 countries using Cell vs WiFi, ordered by
number of runs collected. The last column shows the percentage of                        Tput(WiFi) - Tput(LTE) (mbps)
runs where LTE throughput is higher than WiFi                                                       (b) Downlink

                                                                       Figure 3: CDF of difference between WiFi and LTE throughput. The
   Cell vs WiFi collected network-performance data from locations      grey region shows 42% (uplink) and 35% (downlink) of the data
in five continents: North America, South America, Europe, Africa,      samples whose LTE throughput is higher than WiFi throughput.
and Asia. We observed that some users use this app to measure only
WiFi or LTE performance, but not both. We do not consider these
measurement runs in this section because our goal is to compare
LTE and WiFi performance at nearly the same place and time. To            The simple network selection policy used by mobile devices today
ensure that we only measure performance of LTE or an equivalent        forces applications to use WiFi whenever available. However, our
high-speed cellular network, such as HSPA+, we use the Android         measurement results indicate that a more flexible network selection
network-type API [2] and pick only those measurement runs that         policy will improve the network performance of mobile applica-
used LTE or HSPA+. When using the term LTE in this section, we         tions.
mean LTE/HSPA+. After these filtering steps, our dataset contains
over 1606 complete runs of measurement, i.e., both LTE and WiFi        3.     MPTCP M EASUREMENTS
transfers in both directions.                                             When WiFi and cellular networks offer comparable performance,
   In Table 1, we group nearby runs together using a k-means clus-     or when each varies significantly with time, it is natural to use
tering algorithm, with a cluster radius of r = 100 kilometers; i.e.,   both simultaneously. Several schemes transmitting data on multiple
all runs in each group are within 200 kilometers of each other. For    network interfaces have been proposed in the past [22, 17, 15, 21].
each location group, we also list the percentage of measurement runs   Among these, the most widespread is MPTCP [21]. MPTCP can be
where LTE has higher throughput than WiFi.                             used in two modes [16]: Full-MPTCP mode, which transmits data
   Figure 3 shows the CDF of difference in throughput between          on all available network interfaces at any time and Backup mode,
WiFi and LTE on the uplink and the downlink. We can see that           which transmits data on only one network interface at a time, falling
the throughput difference can be larger than 10 Mbits/s in either      back to the other interface only if the first interface is down. Unless
direction. The grey region shows 42% (uplink) and 35% (downlink)       stated otherwise, all experiments in this section use MPTCP in Full-
of the data samples whose LTE throughput is higher than WiFi           MPTCP mode. For completeness, we compare the two modes in
throughput. If we combine uplink and downlink together, 40% of         Section 3.6. We use a modified version of Cell vs WiFi to carry out
the time LTE outperforms WiFi. Figure 4 shows the CDF of ping          MPTCP measurements. We observe the following:
RTT difference between LTE and WiFi. During our measurement,               1. We find that MPTCP throughput for short flows depends sig-
we send 10 pings and take the average RTT value. The shaded area              nificantly on the network selected for the primary subflow3 in
shows that in 20% of our measurement runs, LTE has a lower ping               MPTCP: for example, changing the network (LTE or WiFi)
RTT than WiFi, although the cellular network is commonly assumed
to have higher delays.                                                 3 We   define subflows in Section 3.1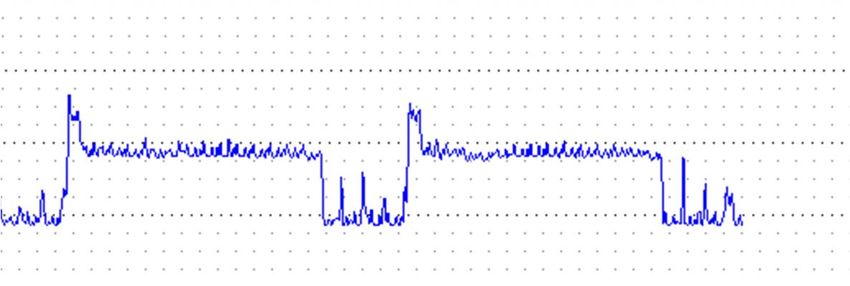
1
0.8
0.6
CDF
0.4
0.2
0
-400 -200 0 200 400
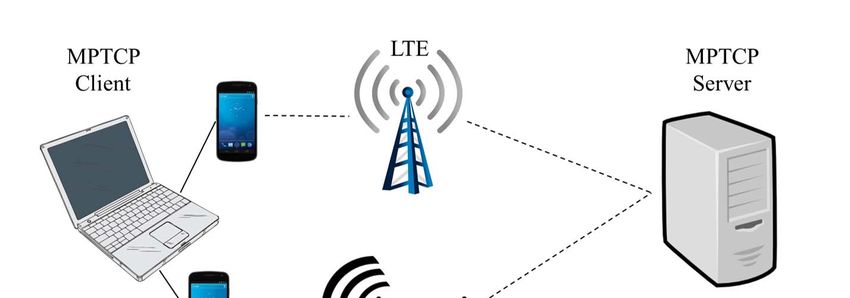
Figure 5: Setup of MPTCP measurement.
RTT(WiFi) - RTT(LTE) (ms)
Figure 4: CDF of the difference between average Ping RTT with
its congestion window based on ACKs both from itself and from
WiFi and LTE. The grey region shows 20% of the data samples
other subflows [21, 10] in the same MPTCP connection. In Sec-
whose LTE RTT is lower than WiFi RTT.
tion 3.5, we compare the coupled and decoupled algorithms and find
that using different congestion-control algorithms has less impact
on throughput compared with selecting the correct interface for pri-
mary subflows for short flows. However, for long flows, changing
for the primary subflow changes the average throughput of a
congestion-control algorithms results in a substantial throughput
10 KByte flow by 60% in the median (Figure 8 in Section 3.4).
difference.
2. For long flows, selecting the proper congestion control algo-
rithm is also important. For example, using different congestion-
control algorithms (coupled or decoupled) changes the aver-
3.2 Measurement Setup
Figure 5 shows the MPTCP measurement setup. The MPTCP
age throughput of a 1 MByte flow by 34% in the median
Client is a laptop running Ubuntu 13.10 with MPTCP installed. We
(Figure 13 in Section 3.5).
tethered two smartphones to the laptop, one in “airplane” mode with
3. MPTCP’s backup mode is typically used for energy efficiency:
WiFi enabled, and the other with WiFi disabled but connected to LTE
keeping fewer interfaces active reduces energy consumption
(either the Verizon or the Sprint LTE network). The MPTCP server
overall. However, we find that for MPTCP in Backup Mode,
is located at MIT, with a single Ethernet interface, also running
if LTE is set to the backup interface, very little energy can be
Ubuntu 13.10 with MPTCP installed.
saved for flows that last shorter than 15 seconds (Section 3.6).
We installed a modified version of Cell vs WiFi on both phones.
3.1 MPTCP Overview The phone with WiFi enabled only measures WiFi performance, i.e.,
MPTCP initiates a connection in a manner similar to regular Step 2 in Figure 2. The phone connected to LTE only measures
TCP: it picks one of the available interfaces and establishes a TCP cellular network performance, i.e., Step 3 in Figure 2.
connection using a SYN-ACK exchange with the server over that in- The experimental setup also allows us to measure the energy
terface. Every TCP connection that belongs to a MPTCP connection consumption separately for each interface, which we present in
is called an MPTCP subflow. The first established subflow is called Section 3.6.
the primary subflow. Each measurement run comprises the following:
We used the Linux MPTCP implementation for our measure- 1. Single path TCP upload and download using modified Cell vs
ments [14] (Ubuntu Linux 13.10 with Kernel version 3.11.0, with WiFi through LTE.
the MPTCP Kernel implementation version v0.88). In this imple- 2. Single path TCP upload and download using modified Cell vs
mentation, MPTCP initiates the primary subflow on the interface WiFi through WiFi.
used as the default route on the machine. Once the primary subflow 3. MPTCP upload and download in Full-MPTCP mode with
is established, if there are other interfaces available, MPTCP creates LTE as the primary subflow.
an additional subflow using each new interface, and combines the 4. MPTCP upload and download in Full-MPTCP mode with
new subflow with the existing subflows on the same MPTCP con- WiFi as the primary subflow.
nection.4 For example, a mobile device can establish an MPTCP We conducted the measurements at 20 different locations on the
primary subflow through WiFi to the server, and then add an LTE east and west coasts of the United States, shown in Table 2. At
subflow to the server. To terminate the connection, each subflow each city, we conduct our measurement at places where people
is terminated using four-way FIN-ACKs, similar to TCP. In Sec- would often use mobile devices: cafes, shopping malls, university
tion 3.4, we study the effect of choosing different interfaces for the campuses, hotel lobbies, airports, and apartments. At 7 of the 20
primary subflow on MPTCP performance. locations, we measured both Verizon and Sprint LTE networks, using
There are two kinds of congestion-control algorithms used by both MPTCP congestion-control algorithms: decoupled and coupled.
MPTCP: decoupled and coupled. In decoupled congestion control, At the other 13 locations, we were able to measure only the Verizon
each subflow increases and decreases its congestion window inde- LTE network with coupled congestion control.
pendently, as if they were independent TCP flows [5]. In coupled In Figure 6, we compare the WiFi and LTE throughput distribu-
congestion control, each subflow in an MPTCP connection increases tions for the data we collected at these 20 locations and the data
collected from Cell vs WiFi in Section 2. We can see that for both
4 For simplicity, here we only explain how MPTCP works when the upload and download, the “20-Location” CDF curves are close to
server is single-homed (like the server in our experiments), and the the CDF curve from Section 2, implying that the 20 locations that
client alone is multi-homed. were selected have similar variability in network conditions as the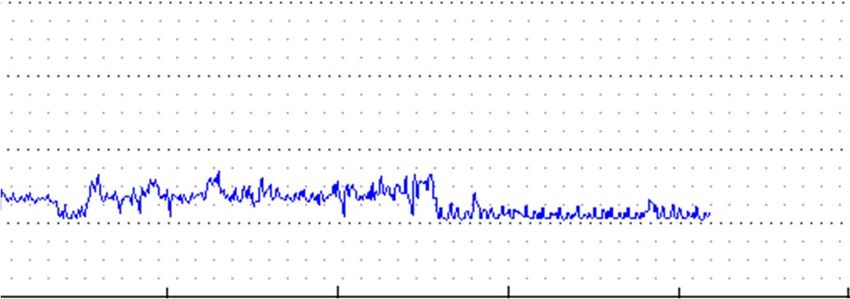
1.0                                                                   1.0

            0.8                                                                   0.8

            0.6                                                                   0.6
      CDF

                                                                          CDF
            0.4                                                                   0.4

            0.2                      App Data                                     0.2                      App Data
                                   20-Location                                                           20-Location
             0                                                                     0
              -15 -10 -5            0     5    10 15 20 25                          -15 -10 -5            0     5    10 15 20 25
                    Tput(WiFi) - Tput(LTE) (mbps)                                            Tput(WiFi) - Tput(LTE) (mbps)
                                 (a) Uplink                                                         (b) Downlink

Figure 6: CDF for WiFi and LTE throughput measured using regular TCP at 20 locations (shown as “20-Location”) comparing with the CDF
in Figure 3(shown as “App Data”).

       ID   City                  Description
                                                                                    1
        1   Amherst, MA           University Campus, Indoor
                                                                                   0.9
        2   Amherst, MA           University Campus, Outdoor
        3   Amherst, MA           Cafe, Indoor                                     0.8
        4   Amherst, MA           Downtown, Outdoor                                0.7
        5   Amherst, MA           Apartment, Indoor                                0.6
        6   Boston, MA            Cafe, Indoor
                                                                            CDF

                                                                                   0.5
        7   Boston, MA            Shopping Mall, Indoor
        8   Boston, MA            Subway, Outdoor                                  0.4
        9   Boston, MA            Airport, Indoor                                  0.3
       10   Boston, MA            Apartment, Indoor                                0.2
                                                                                                                            10 KB
       11   Boston, MA            Cafe, Indoor                                     0.1                                     100 KB
       12   Boston, MA            Downtown, Outdoor                                                                          1 MB
                                                                                    0
       13   Boston, MA            Store, Indoor                                          0         50             100          150         200
       14   Santa Babara, CA      Hotel Lobby, Indoor                                                   Relative Difference(%)
       15   Santa Babara, CA      Hotel Room, Indoor
       16   Santa Babara, CA      Conference Room, Indoor                  Figure 8: CDF of relative difference between MPTCPLT E and
       17   Los Angeles, CA       Airport, Indoor                          MPTCPWiFi , for different flow sizes. The median relative differ-
       18   Washington, D.C.      Hotel Room, Indoor                       ence for each flow size: 60% for 10 KBytes, 49% for 100 KBytes
       19   Princeton, NJ         Hotel Room, Indoor                       and 28% for 1MByte. Thus, throughput for smaller flow sizes is
       20   Philadelphia, PA      Hotel Room, Indoor                       more affected by the choice of the network for the primary subflow.

Table 2: Locations where MPTCP measurements were conducted
                                                                           This occurs in a particularly extreme scenario where a large disparity
                                                                           in link speeds between the two networks (LTE and WiFi) leads to
                                                                           degraded MPTCP performance irrespective of flow size. On the
Cell vs WiFi dataset. For simplicity, in the rest of Section 3, we only    other hand, Figure 7b shows an alternative scenario where MPTCP
show results of downlink flows from the server to the client.              is better than the best single-path TCP at larger flow sizes. In both
                                                                           cases, however, picking the right network for single-path TCP is
3.3    TCP vs. MPTCP                                                       preferable to using MPTCP for smaller flows. These results suggest
   A natural question pertaining to MPTCP is how the performance           that it may not always be advisable to use both networks, and an
of MPTCP compares with the best “single-path” TCP performance              adaptive policy that automatically picks the networks to transmit
achievable by an appropriate choice of networks alone. To answer           on and the transport protocol to use would improve performance
this, we look at all four MPTCP variants (two congestion-control           relative to any static policy.
algorithms times two choices for the network used by the primary
subflow) and both single-path TCP variants (WiFi and LTE) as a             3.4     Primary Flow Measurement
function of flow size. Figure 7 illustrates two qualitatively different       We then study how the choice of the network for the primary sub-
behaviors.                                                                 flow can affect MPTCP throughput for different flow sizes. To show
   Figure 7a shows a case where the performance of MPTCP is                this quantitatively, we calculate the relative throughput difference
always worse than the best single-path TCP regardless of flow size.        as: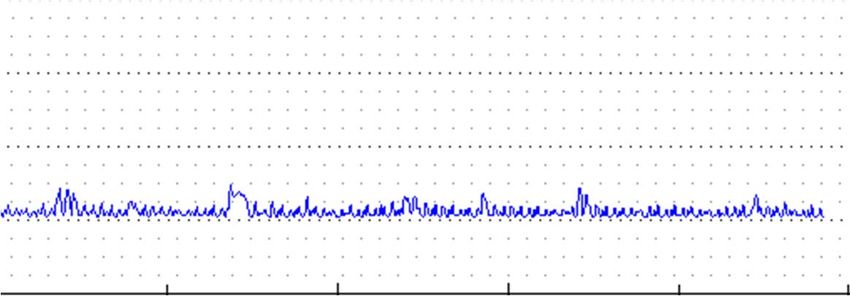
10                                                                               10
                                                   LTE                                                                               LTE
                         9                        WiFi                                                     9                        WiFi
                                 MPTCP(LTE, Decoupled)                                                             MPTCP(LTE, Decoupled)
                         8       MPTCP(WiFi, Decoupled)                                                    8       MPTCP(WiFi, Decoupled)
    Throughput (mbps)

                                                                                     Throughput (mbps)
                         7         MPTCP(LTE, Coupled)                                                     7         MPTCP(LTE, Coupled)
                                  MPTCP(WiFi, Coupled)                                                              MPTCP(WiFi, Coupled)
                         6                                                                                 6
                         5                                                                                 5
                         4                                                                                 4
                         3                                                                                 3
                         2                                                                                 2
                         1                                                                                 1
                         0                                                                                 0
                             1                 10              100            1000                             1                 10              100             1000
                                                 Flow Size (KB)                                                                    Flow Size (KB)
                                  (a) MPTCP performs worse than single TCP.                                         (b) MPTCP performs better than single TCP.

Figure 7: MPTCP throughput vs single path TCP throughput at 2 representative locations. Figure 7a shows a case where MPTCP throughput is
lower than the best throughput of single path TCP. Figure 7b shows a case where MPTCP throughput (in this case, MPTCP(WiFi, decoupled))
is higher than that of single-path TCP for large flow sizes.

                                     |MPTCPLT E −MPTCPWiFi |                                         3.4.2         MPTCP Throughput as a Function of Flow Size
                                          MPTCPWiFi          .
                                                                                                        Figures 11a and 12a show how MPTCP throughput changes as the
                                                                                                     flow size increases. The flow size is measured using the cumulative
   Here, MPTCPLT E is the throughput achieved by MPTCP using                                         number of bytes acknowledged in each ACK packet received at the
LTE for the primary subflow, and MPTCPWiFi is the throughput                                         MPTCP client. Figures 11b and 12b show the relative throughput
achieved by MPTCP using WiFi for the primary subflow (in this                                        ratio change as flow size increases. The relative throughput ratio is
subsection, we only run MPTCP using decoupled congestion con-                                        defined as:
trol). Figure 8 shows the CDF of the relative throughput difference
for three flow sizes: 10 KBytes, 100 KBytes, and 1 MBytes. We                                                                        MPTCPLT E
see that using different networks for the primary subflow has the                                                                    MPTCPWiFi .
greatest effect on smaller flow sizes.                                                                 Although the absolute value of the difference in throughputs is
                                                                                                    smaller for small flow sizes (Figures 11a and 12a), the relative
3.4.1                   MPTCP Throughput Evolution Over Time                                        throughput ratio, is larger (Figure 11b and 12b). Thus, for a connec-
    To understand how using different networks for the primary sub-                                 tion with a given flow size, using the correct interface for MPTCP
flow affects MPTCP throughput evolution over time, we collected                                     primary subflow can reduce the flow completion time, and the rela-
tcpdump traces at the MPTCP Client during the measurement.                                          tive reduction can be significant for smaller flow sizes. For example,
From the traces, we calculate the average throughput from the time                                  in Figure 11a, the absolute throughput difference between LTE and
the MPTCP session is established, to the current time t. In Figure 10                               WiFi is 0.5 mbps for a 100 KB flow, and about 3 mbps for a 1 MB
and 9, we plot the average throughput as a function of time. Each sub                               flow. But in Figure 11b, the relative throughput ratio is 2.2x for 100
figure shows the throughput of the entire MPTCP session (shown                                      KB flow, larger than the 1.5x for a 1 MB flow.
as MPTCP) and the throughput of the individual WiFi and LTE
subflows.                                                                                            3.5       Coupled and Decoupled Congestion Control
    Figure 9 shows traces collected at a location where LTE has much                                    To understand how the choice of congestion-control algorithm
higher throughput than WiFi. At time 0, the client sent the SYN                                      within MPTCP affects its throughput, at 7 of the 20 locations, we
packet to the server. In Figure 9a, it took the client 1 second to                                   measured the following different MPTCP configurations on the
receive the SYN-ACK packet from the server over WiFi. MPTCP                                          Verizon LTE network and each location’s dominant WiFi network:
throughput is the same as the throughput of the WiFi subflow un-                                         1. LTE for primary subflow, coupled congestion control.
til the LTE subflow is established. Because LTE has much higher                                          2. LTE for primary subflow, decoupled5 congestion control.
throughput at this location and time, once the subflow is established                                    3. WiFi for primary subflow, coupled congestion control.
on LTE, it quickly increases its throughput (and therefore MPTCP’s                                       4. WiFi for primary subflow, decoupled congestion control.
throughput). By contrast, in Figure 9b, the client receives the SYN-                                    At each location, we measured 10 runs for each of the 4 configu-
ACK faster, and MPTCP throughput increases more quickly because                                      rations, along both the uplink and the downlink. Thus, each of the
the first subflow is on the higher-throughput LTE network. Because                                   four configurations has 140 data points ((10 + 10) × 7).
of the smaller SYN-ACK RTT and higher throughput on the first                                           To quantify the throughput difference between configurations, we
primary subflow, the MPTCP connection using LTE for the pri-                                         compute:
mary subflow (Figure 9b) has a higher average throughput than the
MPTCP connection using WiFi for the primary subflow (Figure 9a).                                                           |MPTCPLT E,coupled −MPTCPWiFi,coupled |
                                                                                                         rnetwork =                 MPTCPWiFi,coupled              ,   or
    Similarly, Figure 10 shows traces collected at a location where
WiFi has higher throughput than LTE. Here, using WiFi as the                                         5 Here, the decoupled congestion control uses TCP Reno for each
primary subflow for MPTCP results in higher throughput.                                              subflow.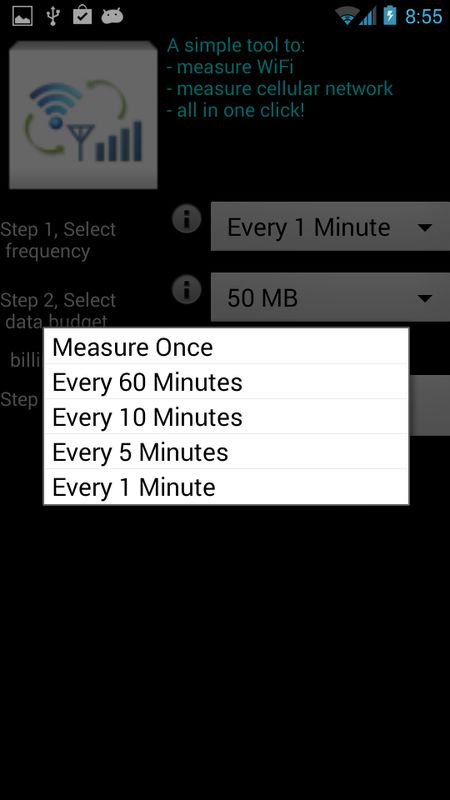
3                                                                         7
                       LTE                                                                         LTE
                       WiFi                                                                        WiFi
                 2.5 MPTCP                                                                     6 MPTCP

                                                                                               5
                     2
   Tput (mbps)

                                                                                 Tput (mbps)
                                                                                               4
                 1.5
                                                                                               3
                     1
                                                                                               2
                 0.5                                                                           1

                     0                                                                         0
                         0           0.5           1             1.5         2                     0            0.5           1              1.5          2
                                             Time (second)                                                              Time (second)
                              (a) Using WiFi for the primary subflow                                       (b) Using LTE for the primary subflow

Figure 9: MPTCP throughput over time, measured at a location where LTE has higher throughput than WiFi. MPTCP throughput grows faster
over time when using LTE for the primary subflow.

                 6                                                                             4.5
                     LTE                                                                                 LTE
                     WiFi                                                                          4     WiFi
                 5 MPTCP                                                                               MPTCP
                                                                                               3.5
                 4                                                                                 3
   Tput (mbps)

                                                                                 Tput (mbps)

                                                                                               2.5
                 3
                                                                                                   2
                 2                                                                             1.5
                                                                                                   1
                 1
                                                                                               0.5
                 0                                                                                 0
                     0             0.5           1              1.5          2                         0         0.5           1             1.5          2
                                           Time (second)                                                                 Time (second)
                              (a) Using WiFi for the primary subflow                                       (b) Using LTE for the primary subflow

Figure 10: MPTCP throughput over time, measured at a location where WiFi has higher throughput than LTE. MPTCP throughput grows faster
over time when using WiFi for the primary subflow.

                             |MPTCPLT E,decoupled −MPTCPWiFi,decoupled |                   left-most one is for 10 KBytes. Thus, using different congestion con-
   rnetwork =                          MPTCPWiFi,decoupled               .
                                                                                           trol algorithms has a greater effect on larger flow sizes. In Figure 14,
                                                                                           a pair-wise comparison between using different networks (labeled
   Here, rnetwork is the relative throughput difference when using
                                                                                           with“Network”) and using different congestion control algorithms
different networks for primary subflow. MPTCPn,c is the throughput
                                                                                           (labeled with “CC”) for each flow size shows the following:
measured when using network n for primary subflow and using
                                                                                               1. For small flow sizes, throughput is more affected by the choice
congestion control algorithm c. We also compute:
                                                                                                  of network for the primary subflow. For example, in Fig-
                  |MPTCPLT E,decoupled −MPTCPLT E,coupled |                                       ure 14a and 14b, “Network” is to the right of “CC”.
   rcwnd =                  MPTCPLT E,coupled               , or                               2. For large flow sizes, throughput is more affected by the choice
                   |MPTCPWiFi,decoupled −MPTCPWiFi,coupled |                                      of congestion control (decoupled or coupled) algorithms. For
           rcwnd =            MPTCPWiFi,coupled               .                                   example: in Figure 14c, “CC” is to the right of “Network”.
                                                                                                  However, the choice of network for the primary subflow is
   Here, rcwnd is the relative throughput difference when using dif-                              also important.
ferent congestion-control algorithms.                                                         In practice, selecting the best network for the primary subflow
   Figure 13 shows the CDF of the relative throughput difference be-                       is more feasible than changing congestion control algorithms for
tween using coupled and decoupled congestion control for three flow                        each MPTCP connection, since the primary flow can be defined
sizes: 10 KBytes, 100 KBytes, and 1 MByte. The rightmost CDF                               solely by the MPTCP endpoint initiating the connection, while the
curve corresponds to the relative difference for 1 MByte, while the                        congestion-control algorithm requires support at both endpoints.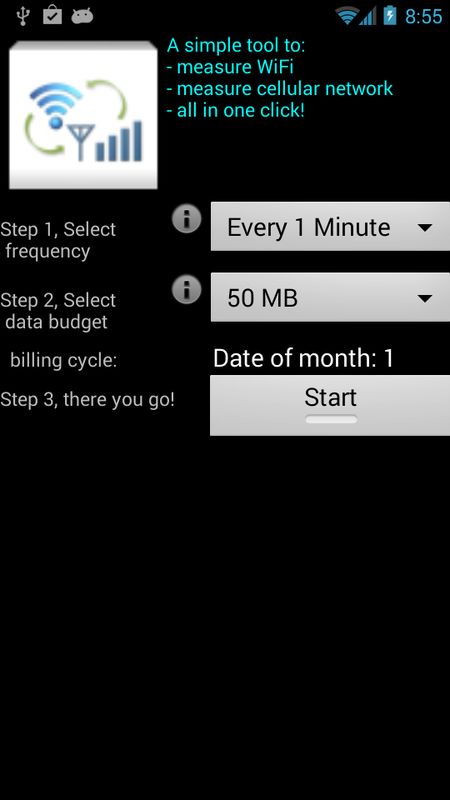
6                                                                         3
                                   MPTCP(LTE)                                                                                       MPTCP(LTE)
                                   MPTCP(WiFi)                                                                                      MPTCP(WiFi)
                           5                                                                        2.5
      Throughput (mbps)

                                                                                 Throughput Ratio
                           4                                                                         2

                           3                                                                        1.5

                           2                                                                         1

                           1                                                                        0.5

                           0                                                                         0
                               0        200      400        600    800    1000                            0      200       400        600       800       1000
                                                 Flow size (KB)                                                            Flow size (KB)
   (a) Absolute throughput difference: larger difference between WiFi and LTE (b) Relative throughput ratio: larger difference between WiFi and LTE for
   for larger flow sizes.                                                     smaller flow sizes.

Figure 11: Absolute throughput difference and relative throughput ratio as a function of flow size when LTE has higher throughput than WiFi.

                               5                                                                     2
                                                           MPTCP(LTE)                                                               MPTCP(LTE)
                            4.5                            MPTCP(WiFi)                                                              MPTCP(WiFi)
                               4
                                                                                                    1.5
      Throughput (mbps)

                                                                                 Throughput Ratio

                            3.5
                               3
                            2.5                                                                      1
                               2
                            1.5
                                                                                                    0.5
                               1
                            0.5
                               0                                                                     0
                                   0      200     400        600    800   1000                            0      200       400        600       800       1000
                                                  Flow size (KB)                                                           Flow size (KB)
   (a) Absolute throughput difference: larger difference between WiFi and LTE (b) Relative throughput ratio: larger difference between WiFi and LTE for
   for larger flow sizes.                                                     smaller flow sizes.

Figure 12: Absolute throughput difference and relative throughput ratio as a function of flow size when WiFi has higher throughput than LTE.

3.6                       Full-MPTCP and Backup Mode                                            the WiFi and LTE interfaces for one MPTCP flow. Sub-figures
   In Sections 3.4 and 3.5, all measurements were done using Full-                              on the left column are packet transmission (sending and receiving)
MPTCP mode, since our focus was on how MPTCP’s throughput                                       patterns captured when using LTE for the primary subflow, while
changes under different configurations, when all paths are fully                                sub-figures on the right are for using WiFi for the primary subflow.
utilized. Backup Mode is an MPTCP mode where only a subset                                         Figures 16a and 16b show that in Full-MPTCP mode, packets are
of paths are used to save energy, especially on power-constrained                               transferred through both WiFi and LTE during the entire MPTCP
mobile devices. In this section, we first show how Backup Mode                                  connection.
differs from Full-MPTCP at the per-packet level. Then we discuss                                   Figures 15c and 15d illustrate the backup mode where one network
the energy efficiency of both Full-MPTCP and Backup Mode.                                       is set to be the backup interface. For example, in Figure 15c, when
                                                                                                WiFi is set to backup, we only see the SYN and SYN ACK packets
3.6.1                      Packet-Level Behavior of Full-MPTCP and Backup                       transferred during the 3-way handshake procedure at t = 1, when the
                           Mode                                                                 connection establishes a WiFi subflow, as well as FIN and FIN-ACK
   Figure 15 shows the packet-transmission pattern over time for a                              packets at t = 19, when the connection ends. A similar pattern is
long flow employing MPTCP, using Full-MPTCP and Backup Mode.                                    shown in Figure 15d, when LTE is set to be the backup interface.
We use tcpdump at the MPTCP client to log packet transmission                                      Figures 15e and 15f show packet transmissions in backup mode,
and ack reception times. In Figure 15, we plot a vertical line at time                          when the primary network is disabled mid-flow. We disable the
t if there is a packet sent or ack received at time t in the tcpdump                            interface by setting the interface to “multipath off” in iproute. In
trace. t = 0 is the time when the first SYN packet is sent.                                     Figure 15e, WiFi is set to backup. When the connection starts, it
   Each sub-figure contains the packet-transmission patterns on both
1 1 1
0.9 0.9 0.9
0.8 0.8 0.8
0.7 0.7 0.7
0.6 0.6 0.6
CDF
CDF
CDF
0.5 0.5 0.5
0.4 0.4 0.4
0.3 0.3 0.3
0.2 0.2 0.2
0.1 CC 0.1 CC 0.1 CC
Network Network Network
0 0 0
0 50 100 150 200 0 50 100 150 200 0 50 100 150 200
Relative Difference(%) Relative Difference(%) Relative Difference(%)
(a) 10 KB (b) 100 KB (c) 1 MB
Figure 14: CDF of relative difference for using different networks for primary subflow (labeled as “Network”) vs using different congestion
control algorithms (labeled as “CC”), across 3 flow sizes. Median values for CC curves: 16% for “10 KB”, 16% for “100 KB”, and 34% for “1
MB”. Thus, using different congestion control algorithms has more impact on larger flows. Median values for Network curves: 60% for “ 10
KB”, 43% for “100 KB” , and 25% for “1 MB”. Thus, using a different network for the primary subflow has the greatest impact on smaller
flows.
1 3.6.2 Energy Efficiency in Backup Mode
0.9 As shown in Figure 15c and 15d, if MPTCP is set to Backup Mode,
0.8 the backup interface still transfers SYN and FIN packets when a
0.7 connection starts and ends. In Figure 16, we show that in certain con-
0.6 figurations, these SYN/FIN packets can consume excessive amounts
CDF
0.5 of energy on a mobile device. Here, we measure the power level of
0.4 the tethered phones using a power monitor [12], when each phone
0.3 serves as the backup or non-backup interface. In all sub-figures of
0.2 Figure 16, the base power consumed is 1 Watt. This is the power
10 KB
0.1 100 KB consumed when the network interfaces are not active. It is the total
1 MB power consumed by the other parts of the phone, such as the screen
0
0 50 100 150 200 and the CPU.
Relative Difference(%) Figure 16a shows the power level of LTE when it is actively
transmitting data, i.e., WiFi is set as a backup interface. Similarly,
Figure 13: CDF of relative difference between MPTCPcoupled and Figure 16b shows the power level of WiFi when it is active. We
MPTCPdecoupled , for different flow sizes. The median relative dif- can see that the WiFi power level is much lower than that of LTE.
ference for each flow size: 16% for 10 KBytes, 16% for 100 KBytes Also, in Figure 16a, after the FIN packet is sent, there is a 15-second
and 34% for 1MByte. Thus, throughput for larger flow sizes is most period in which the LTE power level stays at 2 Watts, instead of the
affected by the choice of congestion control. 1-Watt base power level. The energy consumed in this 15-second
period is called the “Tail Energy” [3, 7].
Figures 16c and 16d show the power level when WiFi or LTE is
set to be the backup interface. In Figure 16d, the energy consumed
transfers data through LTE. At t = 7, we disable LTE, so no data by WiFi is negligible. However, in Figure 16c, when a SYN or a FIN
can be transferred over that interface. We see that the subflow over packet is transmitted through LTE, the power level stays high for
WiFi is brought up and transfers data until the flow ends. A similar about 15 seconds due to the “Tail Energy” effect. Thus, even if only
behavior is seen in Figure 15f. SYN and FIN packets are transferred through LTE, the LTE interface
In Figures 15g and 15h, we disable one network by unplugging the still consumes an excessive amount of energy. For flows shorter than
USB cable connecting the phone to the laptop instead of disabling 15 seconds, little energy can be saved if the LTE interface is set to
it using iproute. Interestingly, we observe different behaviors in be the backup interface. To actually reduce energy consumption in
this experiment. Figure 15h shows that when LTE is set to backup this case, fast dormancy [9] should be used to quickly put the LTE
and we unplug WiFi in the middle of the transfer (at t = 6), the interface in the low-power mode after a SYN and FIN. Alternatively,
LTE path is brought up immediately to finish transferring the rest the Backup Mode should be implemented in a break-before-make
of the data. This behavior is similar to when WiFi was disabled manner. Prior work [16] has proposed Single-Path Mode, which
by changing iproute. However, in Figure 15g, when WiFi is establish a new MPTCP subflow only after the current subflow is
set to backup and we unplug the LTE network in the middle of inactive, at the expense of two more round-trip times compared with
the transfer (at t = 3), the client only transfers one TCP Window the current Backup Mode.
Update packet to the server through the WiFi subflow and then
halts. At t = 68, we re-connect the phone with the laptop. Then the
connection resumes, transfers the rest of the data through the LTE 4. M OBILE A PP T RAFFIC PATTERNS
subflow, and ends the session by sending FIN packets on both path. So far, our measurements have looked at the flow-level perfor-
The reason why disabling paths by physically disconnecting them mance of TCP over WiFi or LTE, and of MPTCP over both WiFi and
can cause different behaviors from disabling them in software is still LTE. We next turn to how the choice of networks for a multi-homed
under investigation. mobile device affects application-level performance as perceived byLTE LTE
SYN FIN
4
4 SYN FIN
3
Power (w)
3
Power (w)
2 2
1 1
WiFi WiFi 0 0
0 10 20 30 40 50 0 10 20 30 40 50
Time (Sec) Time (Sec)
0 5 10 15 20 0 5 10 15 20
(a) LTE power level when used for (b) WiFi power level when used
Time (sec) Time (sec) non-backup subflow. for non-backup subflow.
(a) Full-MPTCP, using LTE for (b) Full-MPTCP, using WiFi for 4
SYN FIN
4
primary subflow. primary subflow. 3 SYN FIN
Power (w)
3
Power (w)
2 2
LTE LTE 1 1
0 0
0 10 20 30 40 50 0 10 20 30 40 50
Time (Sec) Time (Sec)
WiFi WiFi (c) LTE power level when used for (d) WiFi power level when used
backup subflow. for backup subflow.
0 5 10
Time (sec)
15 20 0 10 20
Time (sec)
30 40 50 Figure 16: Power level for LTE and WiFi when used as non-backup
subflow. LTE has a much higher power level than WiFi in non-
(c) Backup Mode, using LTE for (d) Backup Mode, using WiFi for backup mode. LTE also consumes excessive amount of energy even
primary subflow, WiFi for backup. primary subflow, LTE for backup.
in backup mode.
LTE LTE
WiFi WiFi
traces. We extend these capabilities and develop a new shell, Mp-
Shell, to emulate multiple links along with their associated link
0 5 10 15 20 25 30 35 40 45 0 5 10 15 20 25 30 35
delays. This allows us to mimic a multi-homed mobile phone that
Time (sec) Time (sec)
can use both cellular and WiFi links. We use a trace-driven approach,
(e) Backup Mode, using LTE for (f) Backup Mode, using WiFi for as Mahimahi does, to emulate both the cellular and WiFi links.
primary subflow, WiFi for backup. primary subflow, LTE for backup. Because Mahimahi is agnostic to the specific client or server that
Then set LTE to “multipath off” at Then set WiFi to “multipath off” at generates the HTTP traffic, we use it to record all HTTP traffic to and
t = 9 sec. t = 11 sec.
from a mobile app running inside an Android emulator. Later, using
LTE LTE
ReplayShell and MpShell, we run the same mobile app within the
Android emulator under appropriately emulated network conditions.
This enables us to evaluate how MPTCP—or any other multipath-
WiFi WiFi capable transport—affects application performance of a real mobile
app.
0 10 20 30 40 50 60 70 80 90 0 5 10 15 20
Time (sec) Time (sec)
4.2 Traffic Patterns of Mobile Apps
(g) Backup Mode, using LTE for (h) Backup Mode, using WiFi for Figure 17 shows typical traffic patterns we observed across differ-
primary subflow, WiFi for backup. primary subflow, LTE for backup. ent mobile apps run inside RecordShell. We observe that apps tend
Unplug LTE at t = 3 sec. But WiFi Unplug WiFi at t = 6 sec. to initiate multiple TCP connections when launched or in response
does not continue transferring the
rest of the data. Plug LTE back at
to a user interaction. Most of these connections only transfer a small
t = 68 sec. amount of data (eg. connection ID 2 in Figure 17c). Some connec-
tions, such as connection ID 2 in Figure 17a, persist after small data
Figure 15: Full-MPTCP and Backup Mode. transfers.
A few connections, such as connection ID 30 in Figure 17d and
connection ID 8 in Figure 17f, transfer significant amounts of data,
lasting several seconds. The first example (ID 30) occurred when
a mobile app that uses one or more of these networks. To measure the user clicked a link to play a movie trailer. The app downloaded
performance at the level of a mobile app, we first record (Section 4.1) the entire trailer in one HTTP request. The second example (ID 8)
and analyze traffic (Section 4.2) originating from a mobile app, and occurred when the user clicked a PDF file in their Dropbox folder
then replay it under emulated link conditions (Section 5). and the app downloaded the whole file.
In summary, we can categorize app traffic patterns as short-flow
4.1 Record-Replay Tool dominated and long-flow dominated. short-flow dominated apps
Mahimahi [11] is a record-and-replay tool that can record and have only short connections or long-lived connections with little
replay client-server interactions over HTTP. Mahimahi’s Record- data transferred. long-flow dominated apps have one or multiple
Shell is a UNIX shell that records HTTP traffic and stores it as long-lasting flows transferring large amounts of data.
a set of request-response pairs. Later, during replay, Mahimahi’s
ReplayShell—another modified UNIX shell—matches incoming
requests to stored requests, ignoring time-sensitive fields in the re- 5. M OBILE A PP R EPLAY
quest header (eg. If-Modified-Since) that have likely changed since We feed the app traffic patterns described in Section 4 into Mahi-
recording. mahi’s ReplayShell for subsequent replay. To accurately emulate
Mahimahi also includes shells to emulate network delays and different network conditions, we use the recorded single-path TCP
fixed-rate and variable-rate network links using packet-delivery packet traces on both WiFi and LTE as a proxy for the true packet-0-10 kbps 25 0-10 kbps
20 10-100 kbps 10-100 kbps
100-500 kbps 100-500 kbps
500-1000 kbps 20 500-1000 kbps
> 1000 kbps > 1000 kbps
15
Flow ID
Flow ID
15
10
10
5 5
0 0
0 5 10 15 20 25 30 35 40 45 0 5 10 15 20 25 30 35 40 45
Time (sec) Time (sec)
(a) CNN launch. (b) CNN click.
35
14 0-10 kbps
10-100 kbps
100-500 kbps 30
12 500-1000 kbps
> 1000 kbps 25
10
Flow ID
Flow ID
20
8
6 15
4 10 0-10 kbps
10-100 kbps
5 100-500 kbps
2 500-1000 kbps
> 1000 kbps
0 0
0 5 10 15 20 25 30 35 40 45 0 5 10 15 20 25 30 35 40 45
Time (sec) Time (sec)
(c) IMDB launch. (d) IMDB click.
6 12 0-10 kbps
0-10 kbps
10-100 kbps 10-100 kbps
5 100-500 kbps 10 100-500 kbps
500-1000 kbps 500-1000 kbps
> 1000 kbps > 1000 kbps
4 8
Flow ID
Flow ID
3 6
2 4
1 2
0 0
0 5 10 15 20 25 30 35 40 45 0 5 10 15 20 25 30 35 40 45
Time (sec) Time (sec)
(e) Dropbox launch. (f) Dropbox click.
Figure 17: Traffic patterns for app launching and user interacting. Figures 17d and 17f show the “long-flow dominated’ traffic pattern, the other
figures show the “short-flow dominated” pattern.WiFi-TCP WiFi-TCP
10 LTE-TCP 1 Single-Path-TCP Oracle
Normalized App Response Time
MPTCP-Coupled-WiFi Decoupled-MPTCP Oracle
App Response Time (sec)
MPTCP-Coupled-LTE Coupled-MPTCP Oracle
8 MPTCP-Decoupled-WiFi 0.8 MPTCP-WiFi-Primary Oracle
MPTCP-Decoupled-LTE MPTCP-LTE-Primary Oracle
6
0.6
4
0.4
2
0.2
0
1 2 3 4 0
Network Condition ID
Figure 18: CNN app-response time under different network condi- Figure 19: CNN normalized app-response reduction by different
tions. oracle schemes.
delivery trace for WiFi and LTE6 . We use these TCP traces to emu- network conditions out of the 20 we emulated; results for other
late the WiFi and LTE links within MpShell. We emulate 20 distinct conditions are similar.
network conditions using the WiFi and LTE TCP data previously Network Condition IDs 1 and 2 emulate locations where WiFi
collected at 20 locations (Section 3.2). has a much higher bulk TCP throughput than LTE, and in Network
We present results from replaying two traffic patterns. We refer Condition IDs 3 and 4, LTE outperforms WiFi. In Figure 18, we
to the first as the short-flow dominated app where, as shown in observe that:
Figure 17a (CNN launch), an app initiates several connections but 1. Selecting the proper network to transmit for single-path TCP
only transfers a small amount of data on each connection. We refer significantly affects app-response time. For example, in Net-
to the second as the long-flow dominated app, where, as shown in work Condition 1, the app response time for WiFi-TCP is 2.7
Figure 17f (Dropbox user click), an app initiates several connec- seconds while LTE-TCP has an app response time of 5.5 sec-
tions and transfers a large amount of data for a few seconds over a onds, implying that using the proper network for single-path
small subset of the connections. We run each app pattern over the TCP can reduce the app response time by about 2.0x. For a
20 different network conditions (we only show the results from 4 network condition in which LTE has better performance, such
representative conditions due to space limitations). For each network as Network Condition ID 4, the app-response times for TCP
condition, we emulate 6 configurations: over WiFi (shown as “TCP-WiFi” in Figure 18) and TCP over
1. WiFi-TCP: Single-path TCP running on WiFi. LTE (shown as “TCP-LTE” in Figure 18) are 7.2 seconds and
2. LTE-TCP: Single-path TCP running on LTE. 2.8 seconds, respectively. In this case, using LTE can reduce
3. MPTCP-Coupled-WiFi: MPTCP with coupled congestion the app response time by 2.6x.
control using WiFi for the primary subflow. 2. Using MPTCP does not provide much improvement for the
4. MPTCP-Coupled-LTE: MPTCP with coupled congestion con- short-flow dominated app pattern. For instance, in Network
trol using LTE for the primary subflow. Condition 1, MPTCP-Coupled-LTE and MPTCP-Decoupled-
5. MPTCP-Decoupled-WiFi: MPTCP with decoupled conges- LTE have app response times of 5.3 and 4.0, respectively.
tion control using WiFi for the primary subflow. Compared to TCP over LTE, these MPTCP schemes only
6. MPTCP-Decoupled-LTE: MPTCP with decoupled congestion reduce the app response time by 4% and 15%, much smaller
control using LTE for the primary subflow. improvements than the 2x improvement seen when using TCP
Using tcpdump during the emulation, we collect the timestamp over WiFi compared to TCP over LTE.
at the start and end of each HTTP connection. Then we calculate In summary, Figure 18 shows that the choice of network for the
the app response time: the time between the start of the first HTTP primary subflow has a strong impact on app response time. This
connection and the end of the last HTTP connection7 . result is consistent with the results we show in Section 3.5.
We also study the extent to which app response times can be
reduced if we had access to an optimal network selection algorithm:
5.1 Short-Flow Dominated App Replay
an oracle that knew the right network to use, given a particular
Figure 18 shows the app-response time for the CNN app launching
congestion control strategy (coupled vs decoupled) and another
in different configurations under different network conditions. For
oracle that knew the right congestion control strategy to use given
clarity, we only show the emulation results for 4 representative
a particular choice for the network used by the primary subflow.
6 This approach does underestimate the true packet-delivery trace of
Figure 19 shows the app-response time with different oracle schemes,
averaged across all 20 network conditions and normalized by the
the underlying network because TCP takes a finite duration to reach
the link capacity due to Slow Start. app-response time with single-path TCP over WiFi (the default on
7 This metric doesn’t account for computation time that might be Android today). The oracle schemes are:
spent in the app itself after the last HTTP connection ends, but this 1. Single-Path-TCP Oracle: Uses single-path TCP and knows
is impossible to measure without instrumenting or rewriting existing which network minimizes app response time.
applications to report these numbers. 2. Decoupled-MPTCP Oracle: Uses MPTCP decoupled conges-In Figure 20, Network Condition IDs 1 and 2 emulate places
WiFi-TCP where WiFi has a much higher TCP throughput than LTE, and Net-
LTE-TCP
MPTCP-Coupled-WiFi work Condition IDs 3 and 4 represent places where LTE outperforms
App Response Time (sec)
MPTCP-Coupled-LTE WiFi. We observe that:
MPTCP-Decoupled-WiFi 1. Using MPTCP helps to reduce app response-time. For exam-
40 MPTCP-Decoupled-LTE ple, at Network Condition 1, when using single-path TCP, the
app response time is 10 seconds for WiFi and 15 seconds for
30
LTE. When using MPTCP, the app response time is 5 seconds.
2. Selecting the proper network is important: for example, at
20 Network Condition ID 2, the app response time for MPTCP-
Coupled-WiFi is 8 seconds, but if LTE is used for the primary
10 flow, response time increases to 14 seconds.
3. Selecting the proper congestion control algorithm also affects
0 app response time. For example, at Network Condition ID 1,
1 2 3 4 when using LTE for the primary subflow, the app response
Network Condition ID time for coupled congestion control is 4 seconds, while the re-
sponse time with decoupled congestion control is 13 seconds.
Figure 20: Dropbox app-response time under different network In Figure 21, we can see that:
conditions. 1. MPTCP Oracles reduce the app response time by up to 50%,
while the Single-Path-TCP Oracle only reduces app response
time by 42%. So using MPTCP can help improve performance
for “long-flow dominated” apps.
WiFi-TCP 2. For MPTCP Oracles, both selecting the proper network for the
1 Single-Path-TCP Oracle
Normalized App Response Time
Decoupled-MPTCP Oracle primary flow and selecting the appropriate congestion control
Coupled-MPTCP Oracle can reduce the normalized app response time by about 50%,
0.8 MPTCP-WiFi-Primary Oracle implying that both mechanisms are almost equally beneficial
MPTCP-LTE-Primary Oracle
to “long-flow dominated” apps.
0.6
6. R ELATED W ORK
We discuss related work under two headings: prior work compar-
0.4 ing WiFi with cellular network performance and Multi-Path TCP.
6.1 WiFi-Cellular Comparison
0.2
Several prior papers compare cellular network performance with
WiFi. Sommers et al. [20] analyzed crowd-sourced data from
0 SpeedTest.net. Each data sample represents one run of a TCP
upload/download test triggered by a mobile phone user, when the
phone is connected to the Internet through either WiFi or a cellular
Figure 21: Dropbox normalized app-response reduction by different network. We also collect our data in a crowd-sourced manner. How-
oracle schemes. ever, our mobile app, Cell vs WiFi, measures both WiFi and cellular
network performance on the same device at (almost) the same time.
Thus, our dataset reflects the performance difference observed from
a single device at almost the same time. Deshpande et al. [8] mea-
tion control and knows which network to use for the primary sured both 3G and WiFi performance simultaneously using a single
subflow to minimize app response time. device, but their measurement was focused on a vehicular setting
3. Coupled-MPTCP Oracle: Uses MPTCP coupled congestion and they only measured 3G, not LTE. Our dataset focuses on LTE
control and knows which network to use for the primary sub- measurements instead. In our app, we used an activity-recognition
flow to minimize app response time. API provided by Google [1], which shows that most of our measure-
4. MPTCP-WiFi-Primary Oracle: Uses MPTCP with WiFi for ments happen when users are still. Moreover, our data is collected
primary subflow and knows which congestion-control algo- in a crowd-sourced manner, allowing it to capture a wide diversity
rithm to use to minimize app response time. of conditions.
5. MPTCP-LTE-Primary Oracle: Uses MPTCP with LTE for pri-
mary subflow and knows which congestion-control algorithm 6.2 Multi-Path TCP
to use to minimize app response time. Multipath TCP (MPTCP) [21], and its recent implementation
We can see in Figure 19 that the 50% reduction in app response in iOS 7 [13] allow a single TCP connection to use multiple paths.
time with Single-Path-TCP Oracle is the most substantial, while MPTCP provides TCP’s reliable, in-order bytestream abstraction
the reductions with the MPTCP Oracles range from 15% to 35%. while taking advantage of multiple paths for increased through-
This suggests that MPTCP does not reduce app response time as put and fault tolerance. Previous work has looked at MPTCP in a
significantly as selecting the right network for single-path TCP does. mobile context: Raiciu et al. studied mobility with MPTCP [19].
Pluntke et al. designed a scheduler that picks radio interfaces with
5.2 Long-flow Dominated App Replay a view to reduce mobile energy consumption [18]. Paasch et al.
Figures 20 and 21 show emulation results for the long-flow dom- proposed different MPTCP modes to be used by mobile devices
inated traffic pattern, using the same data analysis methods and for Mobile/WiFi handover [16]. Barlow-Bignell et al. [4] studied
oracles as used in the previous subsection. MPTCP performance in the presence of WiFi interference wheremultiple devices connected to the same AP could interfere with each [3] N. Balasubramanian, A. Balasubramanian, and A. Venkatara-
other if they transmitted packets simultaneously. Closest to our work mani. Energy consumption in mobile phones: a measurement
is the work of Chen et al., who measured MPTCP performance over study and implications for network applications. In IMC, 2009.
cellular networks and WiFi [6]. Their measurement focuses on using [4] J. Barlow-Bignell, C. da Silva, J. Gjengset, and P. Oliha. Wire-
different number of subflows, and fine-grained statistics, such as less interference and multipath tcpreducing 3g energy con-
out-of-order delivery and round trip times. Instead, our focus is on sumption on mobile devices, 2013.
studying the choice of networks for the primary subflow, the choice [5] S. Barré, C. Paasch, and O. Bonaventure. Multipath tcp: from
of congestion-control modes, MPTCP’s energy consumption, and theory to practice. In NETWORKING 2011, pages 444–457.
MPTCP’s effect on higher-level metrics such as flow completion Springer, 2011.
times and app-response times. [6] Y.-C. Chen, Y. Lim, R. J. Gibbens, E. M. Nahum, R. Khalili,
and D. Towsley. A measurement-based study of multipath tcp
7. C ONCLUSION AND F UTURE W ORK performance over wireless networks. In IMC, 2013.
We presented a measurement study of single-path TCP and MPTCP [7] S. Deng and H. Balakrishnan. Traffic-aware techniques to
over LTE and WiFi networks. For single-path TCP, we found that reduce 3g/lte wireless energy consumption. In Proceedings
LTE outperforms WiFi 40% of the time – a higher fraction than of the 8th international conference on Emerging networking
one might expect at first sight. We also find that MPTCP offers no experiments and technologies, pages 181–192. ACM, 2012.
appreciable benefit over TCP for shorter flows, but it does improve [8] P. Deshpande, X. Hou, and S. R. Das. Performance compar-
performance for longer flows. For MPTCP, we found that, especially ison of 3g and metro-scale wifi for vehicular network access.
for short flows, it is crucial to select the correct network for the In Proceedings of the 10th ACM SIGCOMM conference on
primary subflow. For long flows, it is equally important to select the Internet measurement, pages 301–307. ACM, 2010.
proper congestion control algorithm. To understand how TCP and [9] UE "Fast Dormancy" behavior, 2007. 3GPP discussion and
MPTCP over LTE and WiFi can affect mobile app performance, we decision notes R2-075251.
analyzed mobile apps’ traffic patterns and categorized apps as either [10] R. Khalili, N. Gast, M. Popovic, U. Upadhyay, and J.-Y.
short-flow dominated or long-flow dominated. For each category, we Le Boudec. Mptcp is not pareto-optimal: performance issues
emulated app traffic patterns and the results we observed match our and a possible solution. In CoNEXT, 2012.
MPTCP measurement findings. [11] Mahimahi. http://mahimahi.mit.edu.
Our findings also bring up new research questions: how can we [12] Monsoon power monitor. http://www.msoon.com/
automatically decide when to use single path TCP and when to use LabEquipment/PowerMonitor/.
MPTCP? How should we decide which network to use for TCP, or [13] Apple ios 7 surprises as first with new multipath tcp connec-
which network to use for a subflow with MPTCP? We think these are tions. http://www.networkworld.com/news/2013/091913-ios7-
non-trivial questions due to the high mobility of devices and rapidly- multipath-273995.html.
changing network conditions. Also, with energy consumption being [14] Multipath tcp - linux kernel implementation.
a major concern for mobile devices, how can we make the decisions http://www.multipath-tcp.org/.
when trying to minimize energy consumption? We plan to explore [15] S. Nirjon, A. Nicoara, C.-H. Hsu, J. Singh, and J. Stankovic.
each of these future directions. MultiNets: Policy Oriented Real-Time Switching of Wireless
Interfaces on Mobile Devices. In RTAS, 2012.
8. ACKNOWLEDGMENTS [16] C. Paasch, G. Detal, F. Duchene, C. Raiciu, and O. Bonaven-
We are grateful to the IMC reviewers, and our shepherd, Dr. Ar- ture. Exploring mobile/wifi handover with multipath tcp. In
naud Legout in particular, for many helpful comments. We thank CellNet, 2012.
Katrina LaCurts, Lenin Ravindranath, and Amy Ousterhout for their [17] C. E. Perkins. Mobile ip. Communications Magazine, IEEE,
thoughtful suggestions. This work was also supported in part by 1997.
NSF grants 1407470 and 1161964. We also thank the members [18] C. Pluntke, L. Eggert, and N. Kiukkonen. Saving mobile device
of the MIT Center for Wireless Networks and Mobile Computing energy with multipath tcp. In MobiArch, 2011.
(Wireless@MIT), including Amazon.com, Cisco, Google, Intel, Me- [19] C. Raiciu, D. Niculescu, M. Bagnulo, and M. J. Handley. Op-
diatek, Microsoft, ST Microelectronics, and Telefonica, for their portunistic mobility with multipath tcp. In MobiArch, 2011.
support. [20] J. Sommers and P. Barford. Cell vs. wifi: on the performance
of metro area mobile connections. In IMC, 2012.
R EFERENCES [21] D. Wischik, C. Raiciu, A. Greenhalgh, and M. Handley. De-
[1] Recognizing the user’s current activity. http:// sign, implementation and evaluation of congestion control for
developer.android.com/training/location/ multipath tcp. In NSDI, 2011.
activity-recognition.html. [22] X. Zhao, C. Castelluccia, and M. Baker. Flexible network
[2] Android telephony manager api. http://developer. support for mobility. In MobiCom, 1998.
android.com/reference/android/telephony/
TelephonyManager.html.You can also read