Connecticut 2020 Annual Air Monitoring Network Plan - CT.gov
←
→
Page content transcription
If your browser does not render page correctly, please read the page content below
Connecticut 2020 Annual Air Monitoring Network Plan

          Connecticut Department of Energy and Environmental Protection
                            Bureau of Air Management

The Department of Energy and Environmental Protection (DEEP) is an affirmative action/equal
opportunity employer and service provider. In conformance with the Americans with Disabilities Act, DEEP
makes every effort to provide equally effective services for persons with disabilities. Individuals with
disabilities who need this information in an alternative format, to allow them to benefit and/or participate
in the agency’s programs and services, should call 860-424-3035 or e-mail the ADA Coordinator, at
DEEP.aaoffice@CT.Gov. Persons who are hearing impaired should call the State of Connecticut relay
number 711.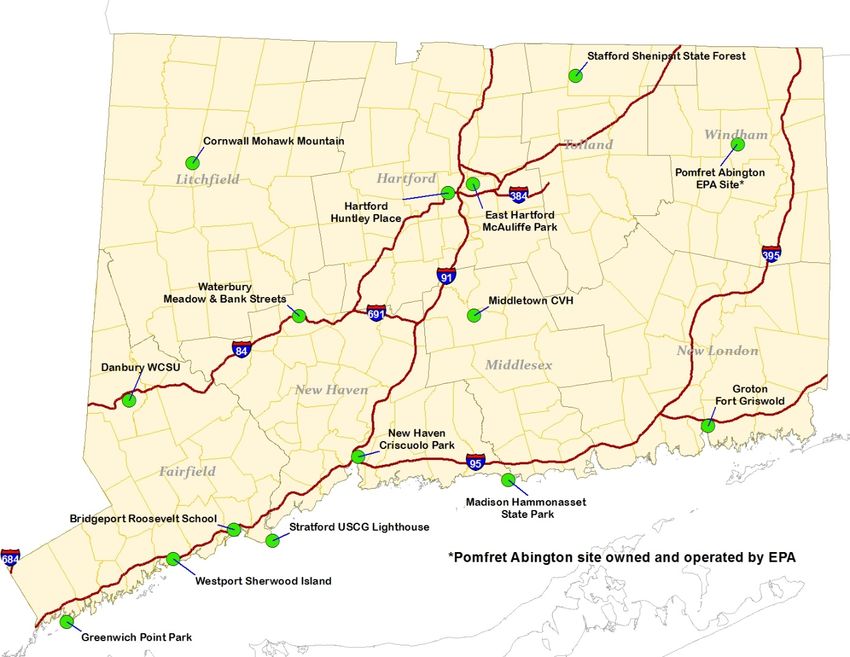
Connecticut 2020 Annual Air Monitoring Network Plan                                                                                       ii

Table of Contents

Table of Contents ...................................................................................................................... ii
Acronyms and Abbreviations ..................................................................................................... iii
Introduction ............................................................................................................................ 1
Background ............................................................................................................................. 1
Network Overview .................................................................................................................... 2
Proposed Network Changes ....................................................................................................... 3
Monitoring Site Information ....................................................................................................... 3
National Ambient Air Quality Standards (NAAQS) ......................................................................... 5
   PM 2.5 Annual Design Values (2018) ........................................................................................ 6
   PM 2.5 Daily Design Values (2018) ........................................................................................... 6
   Ozone Design Values (2018) .................................................................................................. 6
   CO, SO 2 , NO 2 , PM 10 and Pb NAAQS Comparisons (2018) .......................................................... 7
Overview of Network Operation ................................................................................................. 9
   PM 2.5 Monitoring .................................................................................................................. 9
   PM 10 /PM 10-2.5 Monitoring ...................................................................................................... 10
   PM Speciation Monitoring ..................................................................................................... 11
   Ozone Monitoring ................................................................................................................ 12
   Ozone Enhanced Monitoring Plan ........................................................................................... 12
Background ............................................................................................................................ 12
Strategic Approach and Objectives ............................................................................................ 13
Proposed Enhanced Monitoring Activities .................................................................................... 14
   SLAMS Ozone Monitoring...................................................................................................... 14
   SLAMS NO 2 Monitoring ........................................................................................................ 17
   Long Island Sound Ferry-Based Monitoring ............................................................................. 17
   Formaldehyde Monitoring ..................................................................................................... 17
   Upper Air Measurements ...................................................................................................... 17
   Long Island Sound Tropospheric Ozone Study ......................................................................... 17
   Project Assessment and Future Planning ................................................................................ 18
   NO 2 and NO/NO Y Monitoring ................................................................................................. 18
   CO Monitoring ..................................................................................................................... 19
   SO 2 Monitoring ................................................................................................................... 19
Detailed Site Information ......................................................................................................... 21
Appendix A         Network Plan Public Comments and Responses ................................................... A-1

Figure 1: Connecticut DEEP Air Monitoring Network ...................................................................... 2
Figure 2: Map of CT DEEP SLAMS and Proposed EMP Monitoring ................................................... 16

Table 1: Monitoring Network Summary ....................................................................................... 4
Table 2: National Ambient Air Quality Standards .......................................................................... 5
Table 3: DEEP PM2.5 FRM/FEM Network Summary ...................................................................... 10
Connecticut 2020 Annual Air Monitoring Network Plan                                       iii

         Acronyms and Abbreviations

AQI – Air Quality Index
AQS – Air Quality System
BAM – Beta Attenuation Monitor
BC – Black Carbon (Aethalometer)
CAA – Clean Air Act
CBSA – Core-Based Statistical area
CFR – Code of Federal Regulations
CO – carbon monoxide
CSA – combined statistical area
CSN – Chemical Speciation Network
DEEP – Connecticut Department of Energy and Environmental Protection
DAS – data acquisition system
EC/OC – Elemental Carbon/Organic Carbon
EMP – Enhanced Monitoring Plan for ozone
EPA – Environmental Protection Agency
FEM – Federal Equivalent Method
FRM – Federal Reference Method
GC – gas chromatography
GC/MS – gas chromatography/mass spectrometry
HAP – hazardous air pollutant
IMPROVE – Interagency Monitoring of Protected Visual Environments
LC – local conditions of temperature and pressure
LISTOS – Long Island Sound Tropospheric Ozone Study
LMP – limited maintenance plan
MPA – monitoring planning area
MSA – metropolitan statistical area
NAAQS – National Ambient Air Quality Standards
NCore – National Core Monitoring Stations
NOAA – National Oceanic and Atmospheric Administration
NOx – nitrogen oxides
NOy – reactive oxides of nitrogen
OAQPS – Office of Air Quality Planning and Standards
OTR – Ozone Transport Region
PAMS – Photochemical Assessment Monitoring Stations
PM 2.5 – fine particulate matter (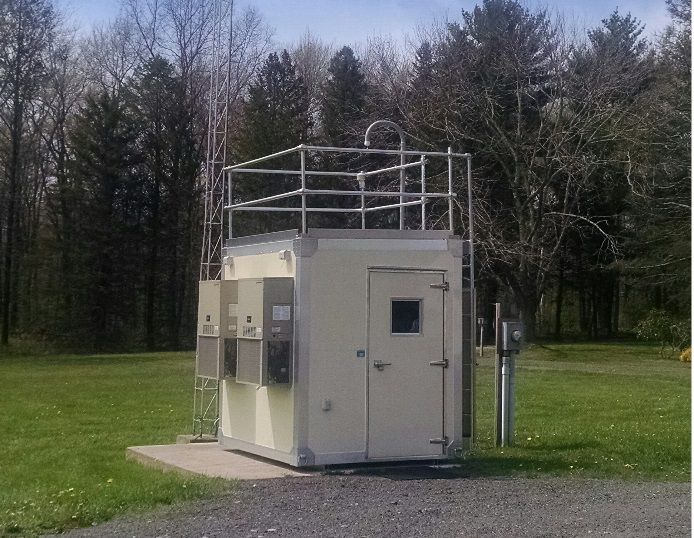
Connecticut 2020 Annual Air Monitoring Network Plan                                                        1

Introduction

The Connecticut 2020 Air Monitoring Network Plan (Network Plan) is prepared by the Connecticut
Department of Energy and Environmental Protection (DEEP) in accordance with 40 CFR 58.10. This
plan meets the requirement to develop and submit to the Environmental Protection Agency (EPA) an
annual air quality monitoring network plan to describe the air monitoring network and propose any
planned changes to air quality monitoring sites and monitored air pollutants to occur within 18 months
following submittal.

The draft Network Plan is posted on DEEP’s website at DEEP: Air Monitoring Network. DEEP made this
Network Plan available for public review and accepted comments from May 29, 2020 to June 28, 2020.
DEEP received one set of comments, which were from EPA Region 1. In response to those comments,
the carbon monoxide (CO) design values presented on page 7 were revised to reflect a change in
EPA’s method for deriving the values.

Background

The Clean Air Act of 1970 (CAA) established the EPA as the principal administrative body to enact
regulations to meet the requirements of the CAA and subsequent amendments thereto. One such
requirement directed EPA to set primary and secondary air quality standards, known as the National
Ambient Air Quality Standards (NAAQS) for the six “criteria pollutants” that Congress determined
presented serious negative impacts to human health and welfare. For areas within Connecticut that do
not meet a NAAQS, DEEP develops State Implementation Plans (SIPs) to detail the steps to be taken
to bring air quality into attainment. Ambient air quality monitoring is essential to track progress
towards meeting clean air goals and demonstrate attainment.

While DEEP monitors ambient air quality in Connecticut primarily for comparison with the NAAQS,
there are other important objectives to ambient air quality monitoring. This monitoring provides local
air quality data to the public, supports air quality forecasting and the Air Quality Index (AQI), supports
long-term health assessments and other scientific research, assists with air permitting and identifying
long-term air quality trends to gauge effectiveness of air pollution control strategies and serves as an
accuracy check on computer based air quality models.

DEEP’s ability to manage the air quality monitoring network greatly depends on federal grant support
from EPA. DEEP matches a portion of the federal grant by covering personnel costs from its general
fund allocation. As potential state budget challenges related to the COVID-19 pandemic begin to
impact DEEP, there may need to be a greater reliance on federal funds. Future federal funding levels
for air monitoring programs continue to remain uncertain and many indications are that federal
funding will be reduced during the time period covered by this plan. In addition, as with state
governmental operations everywhere, state resources allocated to ambient air quality monitoring are
unable to keep pace with rising costs. DEEP will strive to provide an acceptable level of service within
these constraints by continually improving operations and focusing its efforts to ensure the completion
of the most critical ambient air quality monitoring. As operating costs and federal monitoring
requirements increase, DEEP must operate within its means by either improving operational
efficiencies or reducing other aspects of the air monitoring network. Efficiencies being employed and
expanded include improving data acquisition software and hardware, streamlining access to the public
thorough DEEP’s website, and reducing the number of monitoring sites or parameters measured by
increasing multi-pollutant monitoring or terminating duplicative or unnecessary monitors.
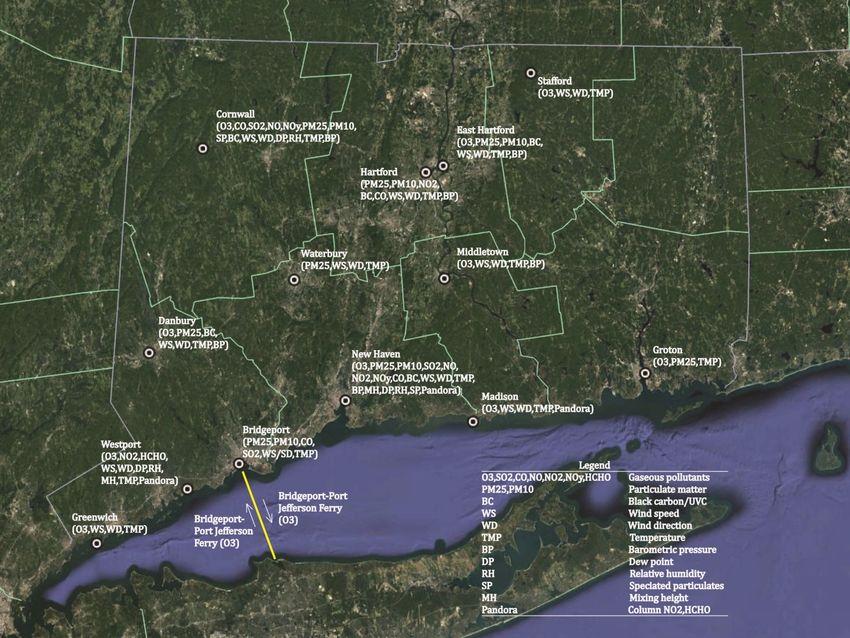
Connecticut 2020 Annual Air Monitoring Network Plan                                                  2

Network Overview

DEEP currently operates 14 stations in its air-monitoring network (Figure 1) as part of the national
State and Local Air Monitoring Stations (SLAMS) network, established under the CAA. In October
2006, EPA instituted a network of core multi-pollutant sites. These sites are known as the National
Core (NCore) network, the primary purpose of which is to consolidate monitoring of multiple pollutants
at fewer sites for efficiency and cost savings. In addition, the NCore sites provide a comprehensive
suite of high-resolution pollutant data for NAAQS compliance assessment, research studies and long-
term trends analysis. There are two NCore sites located in Connecticut: Criscuolo Park in New Haven,
and Mohawk Mountain in Cornwall. The NCore network is part of the SLAMS network.

Figure 1: Connecticut DEEP Air Monitoring Network
Connecticut 2020 Annual Air Monitoring Network Plan                                                            3

Proposed Network Changes

Details of the proposed monitoring network configuration are described in the following site
information pages. In addition to infrastructure maintenance and improvements, DEEP proposes the
following changes to the monitoring network during the period 2020-2021:

    •   Deploy a portable ozone monitor on a ferry operating between Bridgeport and Port Jefferson,
        NY during the 2021 ozone season. The ferry crosses Long Island Sound several times each day
        during daytime hours.
    •   Commence formaldehyde (HCHO) monitoring at Westport, possibly during 2020 or 2021,
        pending acceptable commercially available models*.
    •   Commence mixing height monitoring at Westport during the period 2020 – 2021*.

*
 Note: These two proposed changes were previously requested in the 2018 Network Plan as part of the Enhanced
Monitoring Plan, which was submitted one year in advance as requested by EPA.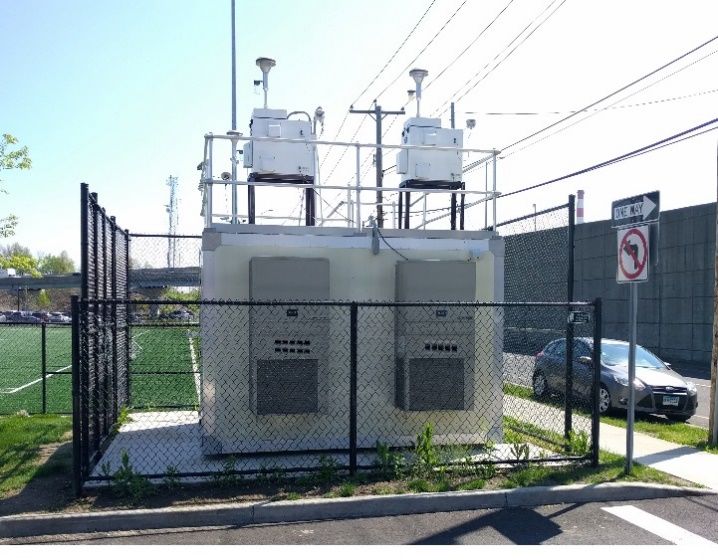
Connecticut 2020 Annual Air Monitoring Network Plan 4
Monitoring Site Information
The ambient air monitoring sites currently operated by DEEP are listed in the Table 1 below. Detailed
information for each monitoring site is provided in a later section of this plan.
Table 1: Monitoring Network Summary
PM10/PM10-2.5 (cont. FEM, secondary)
PM2.5 Carbon (BC/UVC, continuous)
PM2.5 (continuous FEM, secondary)
PM10/PM-10.2.5 (continuous FEM)
PM10/PM10-2.5 (FRM, collocated)
Dew Point / Rel. Humidity
PM Speciation (IMPROVE)
Total Column NO 2 /HCHO
PM2.5 (continuous FEM)
PM2.5 (FRM, collocated)
PM10/PM10-2.5 (FRM)
PM Speciation (CSN)
Barometric Pressure
HCHO (continuous)
Solar Radiation
Wind Direction
Mixing Height
PM2.5 (FRM)
Traffic Count
Temperature
Wind Speed
NO/NOy
Ozone
SO2
NO 2
CO
Town Site
Bridgeport Roosevelt School 1/6 X X X X
Bridgeport
Park City Vessel P
LIS Ferry
Mohawk
Cornwall 1/3 X X 1/3 X X X X X X X X X X X
Mountain
Western
Danbury Connecticut 1/6 X X X X X X X X
State University
East
McAuliffe Park X X X X X X X X X X
Hartford
Greenwich Point Park X X X X
Groton Fort Griswold X X X X
Hartford Huntley Place 1/6 X X X X X X X X X X
Hammonasset
Madison X X X X X
State Park
Connecticut
Middletown Valley X X X X X
Hospital
New Haven Criscuolo Park 1/3 1/6 X X 1/3 1/6 X X 1/3 X X X X X X X X X X X X X X
Shenipsit State
Stafford X X X X
Forest
Stratford
Stratford X X
Lighthouse
Meadow & Bank
Waterbury X X X X X
Street
Sherwood Island
Westport X X P X X X X X P
State Park
X=Existing P = Planned in 2020/2021 T = Terminated in 2020/2021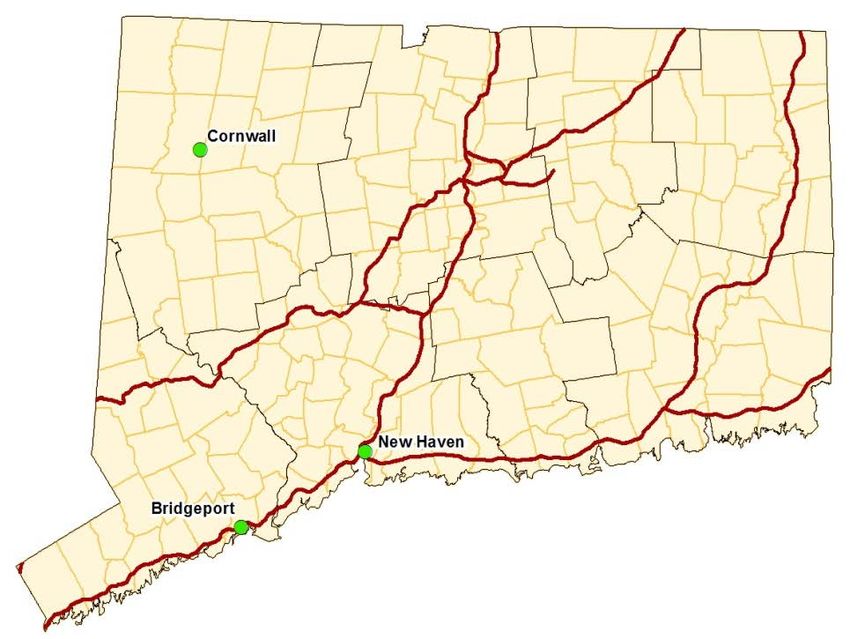
Connecticut 2020 Annual Air Monitoring Network Plan                                                                                                 5

National Ambient Air Quality Standards (NAAQS)

The EPA’s Office of Air Quality Planning and Standards (OAQPS) has set NAAQS for six principal
pollutants, known as the criteria pollutants. Table 2, reprinted here from EPA’s website 1, summarizes
the current NAAQS compliance requirements for the criteria pollutants.

Table 2: National Ambient Air Quality Standards

    Pollutant                       Primary/          Averaging            Level                Form
    [links to historical            Secondary         Time
    tables of NAAQS
    reviews]
    Carbon Monoxide (CO)            primary           8 hours              9 ppm                Not to be exceeded more than once
                                                      1 hour               35 ppm               per year
    Lead (Pb)                       primary           Rolling 3            0.15 μg/m3 (a)       Not to be exceeded
                                    and               month
                                    secondary         average
    Nitrogen Dioxide (NO 2 )        primary           1 hour               100 ppb              98th percentile of 1-hour daily
                                                                                                maximum concentrations, averaged
                                                                                                over 3 years
                                    primary           1 year               53 ppb (b)           Annual Mean
                                    and
                                    secondary
    Ozone (O 3 )                    primary           8 hours              0.070 ppm     (c)
                                                                                                Annual fourth-highest daily maximum
                                    and                                                         8-hour concentration, averaged over
                                    secondary                                                   3 years
    Particle             PM 2.5     primary           1 year               12.0 μg/m3           annual mean, averaged over 3 years
    Pollution (PM)                  secondary         1 year               15.0 μg/m3           annual mean, averaged over 3 years
                                    primary           24 hours             35 μg/m3             98th percentile, averaged over 3
                                    and                                                         years
                                    secondary
                         PM 10      primary           24 hours             150 μg/m3            Not to be exceeded more than once
                                    and                                                         per year on average over 3 years
                                    secondary
    Sulfur Dioxide (SO 2 )          primary           1 hour               75 ppb (d)           99th percentile of 1-hour daily
                                                                                                maximum concentrations, averaged
                                                                                                over 3 years
                                    secondary         3 hours              0.5 ppm              Not to be exceeded more than once
                                                                                                per year

Notes for Table 2:

a
    In areas designated nonattainment for the Pb standards prior to the promulgation of the current (2008) standards, and for which
implementation plans to attain or maintain the current (2008) standards have not been submitted and approved, the previous standards (1.5
µg/m3 as a calendar quarter average) also remain in effect.
b The level of the annual NO 2 standard is 0.053 ppm. It is shown here in terms of ppb for the purposes of clearer comparison to the 1-hour
standard level.
c
  Final rule signed October 1, 2015, and effective December 28, 2015. The previous (2008) O3 standards additionally remain in effect in some
areas. Revocation of the previous (2008) O3 standards and transitioning to the current (2015) standards will be addressed in the
implementation rule for the current standards.
d The previous SO standards (0.14 ppm 24-hour and 0.03 ppm annual) will additionally remain in effect in certain areas: (1) any area for which
                    2

it is not yet 1 year since the effective date of designation under the current (2010) standards, and (2)any area for which implementation plans
providing for attainment of the current (2010) standard have not been submitted and approved and which is designated nonattainment under
the previous SO 2 standards or is not meeting the requirements of a SIP call under the previous SO 2 standards (40 CFR 50.4(3)), A SIP call is an
EPA action requiring a state to resubmit all or part of its State Implementation Plan to demonstrate attainment of the required NAAQS.

1
    https://www.epa.gov/criteria-air-pollutants/naaqs-table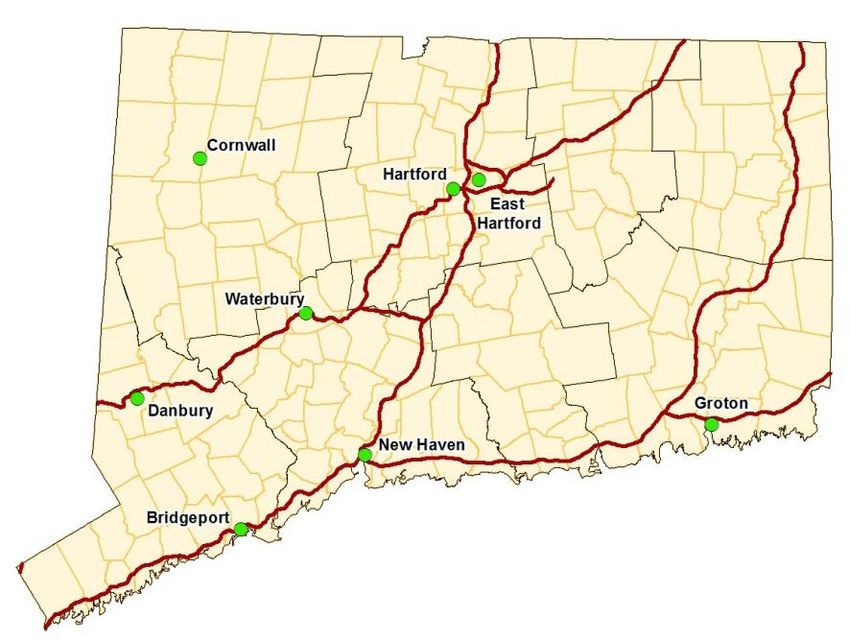
Connecticut 2020 Annual Air Monitoring Network Plan 6
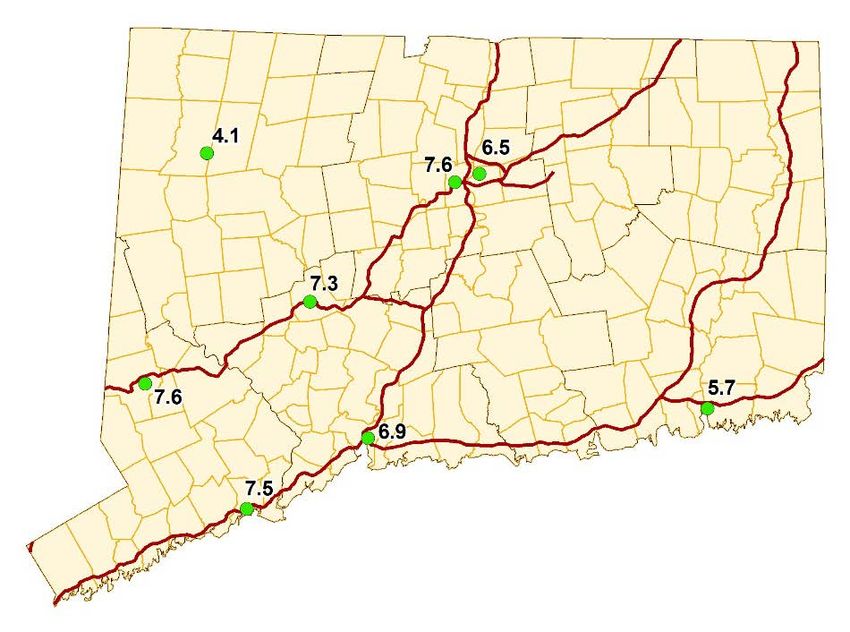
PM2.5 Annual Design Values (2019)
The 2018 annual design values for PM 2.5 , based on 2017 through 2019 data, are presented in the
table and figure below. PM 2.5 annual design values are calculated using the 3-year average of the
respective annual weighted averages. The current annual PM 2.5 NAAQS is 12.0 µg/m3. All Connecticut
monitors demonstrate compliance with the design value for the annual PM 2.5 NAAQS.
Design Value
Site
(µg/m3)
Bridgeport 7.5
Cornwall 4.1
Danbury 7.6
East Hartford 6.5
Groton 5.7*
Hartford 7.6
New Haven 6.9
Waterbury 7.3
NAAQS 12.0
*Design values considered invalid
due to incomplete quarters over
the period 2017-2019.
PM2.5 Daily Design Values (2019)
Daily design values for PM 2.5 using 2017 through 2019 data are given below. PM 2.5 daily design
values are calculated using the 3-year average of the annual 98th percentile values. The daily PM 2.5
NAAQS is 35 µg/m3. Final designations relative to the 2006 24-hour PM 2.5 NAAQS were finalized by
EPA in November 2009 (effective as of December 14, 2009), based upon measured data from 2006
through 2008. All Connecticut monitors demonstrate compliance with the design value for the 24-
hour PM 2.5 NAAQS.
Design Value
Site
(µg/m3)
Bridgeport 19
Cornwall 12
Danbury 20
East Hartford 17
Groton 15*
Hartford 18
New Haven 18
Waterbury 19
NAAQS 35
*Design values considered invalid
due to incomplete quarters over
the period 2017-2019.
Connecticut 2020 Annual Air Monitoring Network Plan                                                     7

                                     Ozone Design Values (2019)

The 2019 ozone 8-hour design values for the 2015 NAAQS are given in the table below. Ozone design
values are derived by averaging three consecutive annual fourth highest daily maximum 8-hour ozone
values. Based on both the 2008 ozone standard of 0.075 ppm (75 ppb) and the October 2015 revised
ozone standard of 0.070 ppm (70 ppb), 10 out of 12 sites indicate nonattainment, shown in red font
below. Starting in 2017, the ozone monitoring season in Connecticut is extended by a month,
beginning March 1 and ending September 30.

                   Design
                   Value
 Site
                   (ppb)
 Abington               71
 Cornwall               66
 Danbury                73
 East Hartford          69
 Greenwich              81
 Groton                 75
 Madison                82
 Middletown             77
 New Haven              75
 Stafford               71
 Stratford              82
 Westport               82
 NAAQS                  70

                   CO, SO2, NO2, PM10 and Pb NAAQS Comparisons (2019)

Comparisons of ambient levels of CO, SO 2 , NO 2 , PM 10 and Pb to the primary NAAQS are provided in
the tables below. The design values for each pollutant were derived in accordance with 40 CFR 50.
For PM 10 , the 3-year fourth-high value, rounded to the tens place, is given to indicate the ambient
level relative to the standard, as the actual design value is the expected number of annual
exceedances of the standard, averaged over a 3-year period, which is in attainment with a value of
less than or equal to one.

CO NAAQS Comparison⃰

                    1-Hr Design       8-Hr Design
 Site
                    Value (ppm)       Value (ppm)
 Bridgeport              2.5               1.7
 Cornwall                 0.5               0.3
 Hartford                 1.5               1.0
 New Haven                2.1               1.2
 NAAQS                    35                 9
⃰Design values represent highest of 2018 and 2019 2nd high values
Connecticut 2020 Annual Air Monitoring Network Plan 8
SO 2 NAAQS Comparison
1-Hr Design
Site
Value (ppb)
Bridgeport 4
Cornwall 2
New Haven 2
NAAQS 75
NO 2 NAAQS Comparison
1-Hr Design Annual Design
Site
Value (ppb) Value (ppb)
East Hartford 42 8
Hartford 46 13
New Haven 52 12
Westport* 39* 8
NAAQS 100 53
*Invalid
design value based on only 2 year of complete data (2018)
PM 10 NAAQS Comparison
Daily “Design Value”*
Site
(μg/m3 STP)
Bridgeport 40
Cornwall 30
East Hartford 20
Hartford 60
New Haven 30
NAAQS 150
*Daily“design values” given are the fourth high daily concentrations
over three years (2017-2019), presented here for comparison to the
standard. The actual PM10 design value form is the expected number of
exceedance days per year, averaged over three years, which should be
less than or equal to one.Connecticut 2020 Annual Air Monitoring Network Plan 9
Overview of Network Operation
DEEP operates a network of 14 State and Local Air Monitoring Stations (SLAMS) sites throughout
Connecticut used for monitoring air pollutants and meteorological parameters. This section contains
information about monitoring methods and sampling frequencies, as well as monitoring network maps
for each pollutant parameter. Network changes planned before the end of 2021 are discussed as are
any anticipated network changes beyond that period.
PM2.5 Monitoring
Network Design The DEEP PM 2.5
network consists of Thermo
Partisol®-Plus 2025i sequential
FRM air samplers with BGI VSCC
(RFPS-0498-118/EQPM-020-145)
and Teledyne API T640X
continuous air samplers (EQPM-
0516-238) for NAAQS compliance
at eight air monitoring stations.
The distribution of PM 2.5 monitors
in the network and their
applicability to NAAQS attainment
are shown in Table 3. All valid
data from designated primary
monitors is used in the derivation
of NAAQS design values.
Additionally, valid data from
collocated and supplemental
monitors, respectively, are used
to fill in any missing or
invalidated scheduled or
nonscheduled days for the
primary monitor data used for computing the design values.
The filter-based FRM monitors operate at a one-in-six day frequency, except for at the two NCore
sites, New Haven and Cornwall, which run on a one-in-three day schedule. As shown in Table 3, there
are three primary PM 2.5 FRM monitors, so the collocated monitor in New Haven meets the collocation
requirement of 15 percent of the network 2. The FEM monitor in Bridgeport is designated as primary,
collocated with FRM monitor, to meet collocation requirements for the FEM network 3 and to provide
precision data. The FEM monitors in East Hartford McAuliffe Park, Groton Fort Griswold, Hartford
Huntley Place, and Waterbury Bank Street are designated as primary monitors. The two Continuous
FEM monitors in New Haven are used to provide precision data for the Teledyne T640X analyzers.
2
40 CFR 58 Appendix A 3.2.3
3
Ibid.Connecticut 2020 Annual Air Monitoring Network Plan 10
Table 3: DEEP PM 2.5 FRM/FEM Network Summary
Site Primary Collocated Supplemental
Bridgeport-Roosevelt Sch. Continuous FEM 1-in-6 FRM
Cornwall-Mohawk Mt. 1-in-3 FRM Continuous FEM
Danbury-WCSU 1-in-6 FRM Continuous FEM
East Hartford-McAuliffe Pk. Continuous FEM
Groton-Ft. Griswold Continuous FEM
Hartford-Huntley Pl. 1-in-6 FRM Continuous FEM
New Haven-Criscuolo Pk. 1-in-3 FRM 1-in-6 FRM 2 Continuous FEMs
Waterbury-Bank St. Continuous FEM
PM10/PM10-2.5 Monitoring
DEEP operates one PM 10 /PM 10-2.5 FRM
sites in the air monitoring network
using Thermo Partisol®-Plus 2025i
sequential air samplers (RFPS-1298-
127). The New Haven NCore site
operates on a 1-in-3 day sample
schedule. The New Haven site has a
collocated PM 10 FRM sampler
operating on a 1-in-6 day sample
schedule. All primary and collocated
PM 10 FRM samplers are paired with
PM 2.5 FRM samplers for coarse PM
(PM 10-2.5 ). The New Haven site has
PM 10-2.5 collocated FRM monitors, as
requested by EPA as part of a
minimum number of PM 10-2.5
collocated sites for data quality
assessment.
In addition to the FRM PM 10 monitors,
8 sites have FEM Teledyne API T640 continuous PM mass monitors with 640X option for FEM PM 10
(EQPM-0516-239). The current PM 10 network configuration is shown in Table 4. The T640X analyzers
produce 1-minute and 60-minute average PM 2.5 , PM 10 (at local (LC) and standard (STP) conditions of
temperature and pressure) and PM 10-2.5 (coarse PM). Coarse PM is defined as thoracic PM having
particle aerodynamic diameters between 2.5 and 10 microns, operationally defined as the difference
PM 10 minus PM 2.5 .Connecticut 2020 Annual Air Monitoring Network Plan 11
Table 4: DEEP PM10 Network Configuration
Site Primary Collocated Supplemental
Bridgeport-Roosevelt Sch. Continuous FEM
Cornwall-Mohawk Mt. Continuous FEM
Danbury-WCSU Continuous FEM
East Hartford-McAuliffe Pk. Continuous FEM
Groton-Ft. Griswold Continuous FEM
Hartford-Huntley Pl. Continuous FEM
New Haven-Criscuolo Pk. 1-in-3 FRM 1-in-6 FRM 2 Continuous FEMs
Waterbury-Bank St. Continuous FEM
PM Speciation Monitoring
PM 2.5 chemical speciation
measurements are obtained at five
sites in the DEEP air monitoring
network. These include filter-based
daily composite 1-in-3 day samples at
the 2 NCore sites, and continuous
hourly black carbon at five sites.
The Interagency Monitoring of
Protected Visual Environments
(IMPROVE) monitor is located at the
Cornwall site and the Chemical
Speciation Network (CSN) monitor is
at the New Haven Criscuolo Park site.
Both sites are operated on the
standard EPA 1-in-3 day PM sample
schedule and provide 24-hour
integrated filter-base measurements.
Black carbon (BC) and ultra-violet
channel carbon (UVC), a wood smoke PM surrogate, are monitored at the Criscuolo Park, Cornwall,
Hartford, East Hartford McAuliffe Park and Danbury WCSU sites using 7-channel TAPI Model 633
aethalometers. No changes are proposed to the PM speciation network during 2020-2021.Connecticut 2020 Annual Air Monitoring Network Plan 12
Ozone Monitoring
DEEP operates eleven ozone sites in
its air monitoring network for NAAQS
compliance. The ozone analyzers at
the Cornwall Mohawk Mountain, East
Hartford McAuliffe Park and New
Haven Criscuolo Park sites are
operated year-round, while the
remaining sites are operated during
the EPA-defined ozone season, which
for Connecticut is from March 1 to
September 30. In addition to the
DEEP network, EPA operates an
ozone monitor in Abington (Pomfret)
during the ozone season as part of
its Clean Air Status and Trends
(CASTNET) network.
NAAQS compliance ozone monitoring
in the DEEP network is conducted
using Teledyne-API Model T400 UV
photometric ozone analyzers
(method EQOA-992-087). Ozone
measurements are sent to the EPA AIRNow website for AQI purposes on an hourly basis.
In addition to the NAAQS compliance monitors discussed above, DEEP deployed a portable ozone
monitor (Teledyne API model 430) during the 2018 ozone season on a ferry operating between
Bridgeport and Port Jefferson, NY. The ferry crosses Long Island Sound several times each day during
daytime hours. Pending approval from the ferry owner, DEEP intends to deploy the same type of
portable ozone monitor during the 2021 ozone season to complement planned research efforts in the
greater New York/Long Island Sound area. The monitor is intended only for scientific study only and
will not be used to determine NAAQS compliance.
Ozone Enhanced Monitoring Plan
This section consists of the Enhanced Monitoring Plan (EMP) for Connecticut pursuant to 40 CFR
sections 58.10 (a) (11) and 58 App D 5(h). These federal regulations, revised under the 2015 National
Ambient Air Quality Standards (NAAQS) for ozone 4, require that any state with any area designated
moderate nonattainment or above, or any state within the Ozone Transport Region (OTR), submit an
Enhanced Monitoring Plan for ozone (EMP) to the regional office of the Environmental Protection
Agency (EPA) no later than October 1, 2019.
Background
Recent ozone (O 3 ) levels in Connecticut are generally the highest in the eastern U.S, placing all
regions of the state in serious nonattainment for the 2008 ozone National Ambient Air Quality
Standards (NAAQS). The southwestern three counties of the state (Connecticut portion of the New
York-N. New Jersey-Long Island, NY-NJ-CT non-attainment area) have been designated moderate for
the 2015 ozone NAAQS, while the remainder of the state is designated marginal, under the 2015
4
FR 80 65292, October 26, 2015Connecticut 2020 Annual Air Monitoring Network Plan 13
NAAQS. These levels largely result from transport of ozone precursors into Connecticut from the
south-west direction along the northeast urban corridor. Modeling and other analyses have shown
significant contributions to ozone levels in Connecticut from sources both inside and outside of the
greater New York and greater Connecticut nonattainment areas 5.
DEEP has documented through numerous public comment submissions, communications and even
litigation, that EPA 6 must implement the Clean Air Act provisions designed to address interstate air
pollution transport before Connecticut can reasonably expect to attain either the 2008 or 2015 ozone
NAAQS in the Connecticut portion of the Northern New Jersey – New York – Connecticut
nonattainment area. Nonetheless, EPA continues to fail to adopt sufficiently stringent national
measures to control ozone precursor emissions or enforce the tools EPA claims the states possess
(CAA section 176A or 126 petitions or the section 110(a)(2)(D) good neighbor provisions). As such,
DEEP is proposing monitoring activities under this EMP to increase the scientific knowledge and
understanding of the fate and transport mechanisms of ozone and related ozone precursor pollutants
in this region, with specific attention to impacts of the water-land boundary. DEEP expects the data
from these enhanced monitoring activities will further clarify the critical role that interstate air
pollution transport plays in the Northern New Jersey-New York-Connecticut and Greater Connecticut
nonattainment areas and further inform the development and implementation of meaningful national
programs that will protect public health and the environment.
The 2015 O 3 NAAQS amended monitoring requirements for the Photochemical Air Monitoring Stations
(PAMS) network. Previously, Connecticut operated PAMS volatile organic compounds (VOC) monitors
at three sites: East Hartford McAuliffe Park, New Haven Criscuolo Park and Westport Sherwood Island
State Park. The revised rule now requires VOC monitoring at all National Core (NCore) monitoring
sites in Core-Based Statistical Areas (CBSAs) having populations greater than 1 million. In addition,
areas with moderate or higher levels of O 3 nonattainment, as well as all areas within the Ozone
Transport Region (OTR), are required to develop Enhanced Monitoring Plans (EMPs). EMPs are
required to provide for any additional monitoring beyond the minimum requirements for State and
Local Air Monitoring Stations (SLAMS) that would be beneficial in identifying pollutant levels, sources,
transport and progress towards attainment. The EMP mandate is intended to provide state and local
environmental agencies an opportunity to implement additional monitoring beyond SLAMS that
addresses the particular needs of nonattainment areas not explicitly covered under the revised PAMS
network.
Strategic Approach and Objectives
State and local environmental agencies have conducted considerable surface monitoring of O 3 , O 3
precursors [e.g.: nitrogen oxides (NO, NO 2 , NO X , NO Y ), volatile organic compounds (VOCs)] and
meteorological parameters for many years as part SLAMS and PAMS networks. Current strategies for
analyzing O 3 production and transport are typically based on computer modeling with source
emissions and meteorological inputs, where high resolution speciated VOC data have limited
usefulness in model development or validation.
PAMS monitoring programs also include, in addition to VOCs, three carbonyls that are more typically
abundant: formaldehyde, acetaldehyde and acetone. The most significant of these, formaldehyde
(HCHO), has been used extensively as a proxy for VOC free radical formation in research and analyses
on tropospheric ozone 7. Given the understanding that O 3 formation may be sensitive to changes in
either VOCs (VOC limited regime) or NO X (NO X limited regime), as demonstrated with photochemical
5
FR 82 1733, January 6, 2017
6
Greater CT Ozone Attainment Demonstration for the 2008 NAAQS
7
Jin, X et. al, 2017,Evaluating a Space-Based Indicator of Surface Ozone-NOx-VOC Sensitivity Over Midlatitude
Source Regions and Application to Decadal Trends, J. of Geophysical Research, 122 (19) 10,439-10,461Connecticut 2020 Annual Air Monitoring Network Plan 14
numeric computer models, the ratio of HCHO to NO 2 from ambient air monitoring during high O 3
events can be key in the validation of computer modeling approaches.
In addition to monitoring strategies aimed at understanding aspects of the regional O 3 chemistry,
collecting data that clearly show the spatial variability of surface O 3 concentrations is critical to
developing approaches to address non-attainment in Connecticut. DEEP maintains an extensive
network of O 3 monitoring sites, particularly along its prevailing upwind (south-southwestern) border
to effectively track ozone plumes transported into the state, and these sites consistently show the
highest ozone concentrations in Connecticut.
Proposed Enhanced Monitoring Activities
DEEP is proposing the following activities and resource commitments to meet the objectives for
enhanced monitoring under this EMP. DEEP believes these proposed actions meet the requirements of
the EMP and will assist DEEP’s ongoing efforts toward assessing and understanding ozone
nonattainment issues in Connecticut:
• Continued operation of two additional O 3 monitors beyond those minimally required for the
State and Local Air Monitoring Station (SLAMS) in the Bridgeport-Stamford-Norwalk Core-
Based Statistical Area (CBSA).
• Continued operation of one additional ozone monitor beyond those minimally required in the
Hartford-West Hartford-East Hartford CBSA.
• Continued operation of one additional NO 2 monitor, located at the Westport Sherwood Island
State Park site.
• Targeted deployment of a compact O 3 monitor on one of the Bridgeport, CT – Port Jefferson,
NY ferries crossing the Long Island Sound to assist scientific research of ozone fate and
transport mechanisms in the greater New York-Long Island Sound region.
• Installation of one HCHO continuous monitor at the Westport site.
• Installation and operation of two ceilometers, at Westport and New Haven, for atmospheric
mixing height (boundary layer depth).
• Provision of on-site technical support for EPA’s Pandora spectrophotometers, which
continuously monitor total column NO 2 and HCHO, at three coastal monitoring sites (Westport
Sherwood Island, New Haven Criscuolo Park and Madison Hammonasset State Park.
• Provision of technical and/or financial support for select scientific or engineering research
projects that have the potential to further develop understanding of the mechanisms of ozone
production and transport impacting Connecticut. For example, DEEP participated in the multi-
faceted LISTOS (Long Island Sound Tropospheric Ozone Study) project in 2017 – 2018. In
particular, DEEP hosted enhanced surface and upper air monitoring at multiple coastal sites. In
addition, DEEP (1) contracted with Stony Brook University for a study to characterize the
meteorology of the Long Island Sound region; (2) contributed funding and planning support
for air quality and meteorological monitoring from a light aircraft during multiple high ozone
episodes; and (3) contributed funding for continuous VOC monitoring on the north shore of
Long Island, which was conducted by Stony Brook University.
DEEP has participated as a joint effort with multiple state and federal agencies, academic researchers,
non-governmental organizations and private businesses in the development, planning and
implementation of these activities. Figure 2 shows the proposed DEEP monitoring network with EMP
activities included.
SLAMS Ozone Monitoring
The ozone monitoring requirements in 40 CFR 58 for state and local air monitoring stations (SLAMS)
set minimum numbers of monitors based on ozone NAAQS design values and population for each
core-based statistical area (CBSA). In addition, the months of the ozone season are determined forConnecticut 2020 Annual Air Monitoring Network Plan 15
each location, which for Connecticut is March through September. Ozone monitors at National Core
(NCore) multipollutant sites operate year-round, using Teledyne API 400E analyzers (reference
method ID EQOA-0992-087).
Minimum SLAMS ozone monitoring requirements are provided in Table D-2 of Appendix D, 40 CFR 58.
An assessment for the Connecticut network, shown in Table 1 below, gives populations and design
values for each CBSA. For both the Bridgeport-Stamford-Norwalk and Hartford-West Hartford-East
Hartford CBSAs, a minimum of 2 monitors are required, while there are 4 and 3 monitors in each
CBSA, respectively. DEEP proposes to consider these 3 additional monitors as part of this EMP.
Table 5: Summary of Connecticut Ozone Monitoring Network Design Compliance
CBSA 2016 Population Maximum 2017 No. of required Current no. of
(estimated) design value SLAMS monitors SLAMS monitors
Bridgeport- 944,177 83 2 4
Stamford-Norwalk,
CT
Hartford-West 1,206,836 79 2 3
Hartford-East
Hartford, CT
New Haven-Milford, 856,875 82 2 2
CT
Norwich-New 269,801 76 1 1
London, CT
Worcester, MA-CT 935,781 68 2 3
Torrington, CT 182,571 72 1 1Connecticut 2020 Annual Air Monitoring Network Plan 16 Figure 2: Map of CT DEEP SLAMS and Proposed EMP Monitoring
Connecticut 2020 Annual Air Monitoring Network Plan                                                    17

                                           SLAMS NO2 Monitoring

Connecticut meets its regulatory NO 2 monitoring requirements for near road and area-wide monitors with
two monitors in the Hartford CBSA. An additional NO 2 monitor required by the Regional Administrators
for the protection of sensitive and vulnerable populations is located at the New Haven NCore site. A
fourth monitor, located in Westport as part of the enhanced monitoring plan, is intended to provide
further data to assist in understanding ozone precursor transport into Connecticut. All NO 2 monitors are
Teledyne API T500U cavity attenuated phase shift spectroscopy (CAPS) (reference method ID EQNA-
0514-212).

                               Long Island Sound Ferry-Based Monitoring

In an effort to collect surface data on Long Island Sound, DEEP has conducted ozone monitoring on a
ferry operating continuously during daytime hours between Bridgeport, CT and Port Jefferson, NY during
the 2018 ozone season, to coincide with the most of the targeted monitoring associated with the Long
Island Sound Tropospheric Ozone Study (LISTOS). Pending permission of the ferry owner, DEEP plans to
deploy the monitor on the ferry during the 2021 season. The portable ozone monitoring modules are
Teledyne API model 430 analyzers, equipped with battery back-up, global positioning system (GPS)
sensor and cellular data transmission equipment.

                                         Formaldehyde Monitoring

DEEP intends to purchase and deploy a continuous automated formaldehyde (HCHO) sensor at Westport
during the ozone monitoring season. HCHO measurements will be a complement to NO 2 measurements,
as the ratio is an important indicator to assess whether the ozone production regime is VOC or NO X
limited. The particular analyzer make or model is yet to be determined at this time.

                                          Upper Air Measurements

The planetary boundary layer (PBL) is the near-surface portion of the troposphere that is generally
considered to be well mixed, such that pollutants emitted or created are more or less mixed but confined
within the PBL. As such, lower boundary layer heights are associated with higher pollutant
concentrations. The different radiative and absorptive capacities of land and water can affect the PBL
height, also known as the mixing height (MH). Thus, coastal areas downwind of large water bodies may
have higher concentrations than inland levels where the mixing heights are increased. DEEP is proposing
to operate two ceilometers, at New Haven and Westport, for automated mixing height measurements.
The ceilometers are model CL51, manufactured by Vaisala, Oyj, that operate based on optical
backscattering by fine particulate aerosols that tend to concentrate just below the mixing height. The
New Haven ceilometer has been in operation since November 2015, and the Westport ceilometer is
expected to be purchased and deployed in 2020.

                              Long Island Sound Tropospheric Ozone Study

Starting in 2017, and continuing through 2018, DEEP partnered with EPA, the National Aeronautics and
Space Administration (NASA), the Northeast States for Coordinated Air Use Management (NESCAUM),
other states and academic institutions to conduct field studies of O 3 atmospheric chemistry and transport
in the greater New York – Long Island Sound – Connecticut area, with a particular focus on the
mechanisms that result in the high O 3 levels observed along the Connecticut coastline. This study, named
the Long Island Tropospheric Ozone Study (LISTOS) 8, has utilized, in addition to the enhanced
monitoring conducted by DEEP as described above (fixed site and ferry O 3 , NO 2 HCHO, MH), ground-
based upper air monitoring, investigations into coastal meteorology, intensive upper air chemical and
meteorological monitoring during high O 3 events, aircraft-based high resolution remote sensing of trace
gases for source identification during high O 3 events, and ground-based episode monitoring of trace NO 2
and VOCs using a mobile laboratory.
LISTOS activities for which DEEP provided monetary or in-kind support include:

8
    http://www.nescaum.org/documents/listos/
Connecticut 2020 Annual Air Monitoring Network Plan 18
• Three Pandora spectrophotometers, located at the Madison, New Haven and Westport sites, for
column NO 2 and HCHO.
• An O 3 Light Detection and Ranging (LIDAR) sensor, located at Westport from mid-July 2018 to
the end of the O 3 season, for upper air ozone concentration vertical profiling.
• Multiple balloon sonde launches at Westport for upper air ozone and meteorological profiling.
Ozone sonde data will allow for calibration of the O 3 LIDAR.
• Low altitude atmospheric meteorological and chemical monitoring with the University of Maryland
(UMD) experimental light aircraft during several forecasted high O 3 events. This was first
conducted in 2017, and is planned for the 2018 and 2019 ozone seasons.
• An intensive meteorological study of the Long Island Sound region conducted by Stony Brook
University. The study will use measurements collected from ground-based and aircraft wind field
monitoring, combined with computer modeling, to determine atmospheric transport
characteristics typical of high ozone events.
• A monitoring study of reactive VOCs by Stony Brook University based at a site located on the
north shore of Long Island, approximately forty miles east of New York City. Surface ambient air
monitoring will be conducted during selected high ozone events for VOC, trace gas and
meteorological parameters. VOC analysis will employ Stony Brook’s high resolution proton
transfer time of flight mass spectrometer.
Project Assessment and Future Planning
Assessment of the data generated by the LISTOS project will be ongoing, and most of the activities
described above were planned only for the 2018 period. Additional monitoring may be deployed in the
future if the results and analysis of LISTOS indicate that new directions of investigation are warranted to
further characterize the regional O 3 chemistry and transport.
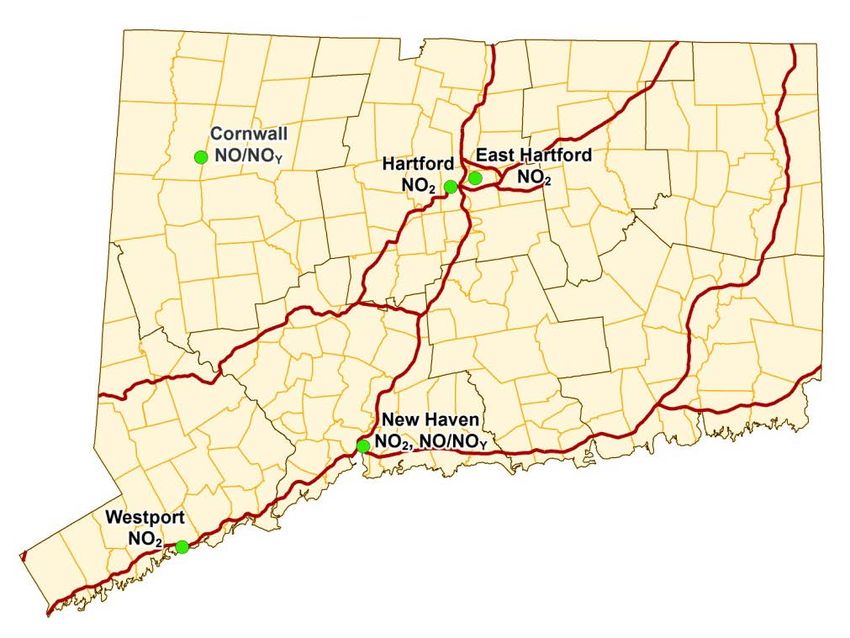
NO2 and NO/NOY Monitoring
DEEP monitors nitrogen dioxide
(NO 2 ) at four sites in the
monitoring network using
Teledyne-API Model T500U
(EQNA-0514-212), which are
capable of directly measuring
NO 2 using cavity attenuated
phase shift (CAPS) spectroscopy
methodology. The NO 2 monitors
are maintained at Hartford
Huntley Place, East Hartford
McAuliffe Park, New Haven
Criscuolo Park and Westport
Sherwood Island State Park for
regulatory compliance.
DEEP also operates two nitrogen
oxide/total reactive oxides of
nitrogen (NO/NO Y ) TAPI model
T200U/501 monitors, at
Cornwall Mohawk Mountain and
New Haven Criscuolo Park, to
comply with NCore
requirements. NO Y is defined as
NO+NO 2 +NO Z , where NO Z represents higher oxides of nitrogen. The major components of NO Z include
nitrous acids [nitric acid (HNO 3 ), and nitrous acid (HONO)], organic nitrates [peroxyl acetyl nitrate (PAN),
methyl peroxyl acetyl nitrate (MPAN), and peroxyl propionyl nitrate, (PPN)], and particulate nitrates.
The NO 2 and NO/NO Y networks fulfill requirements for NCore and SLAMS monitoring of these parameters.
These requirements include: near road and area wide NO 2 monitoring in a core-based statistical area
(CBSA) with a population greater than 1,000,000 (Hartford and East Hartford sites, respectively);Connecticut 2020 Annual Air Monitoring Network Plan 19
nationwide NO 2 monitoring for susceptible and vulnerable populations at site selected by EPA (New
Haven) and NCore NO/NO Y monitoring (Cornwall and New Haven). The Westport NO2 monitor is operated
in fulfillment of Connecticut’s enhanced monitoring plan.
CO Monitoring
DEEP operates three carbon
monoxide (CO) sites in the air
monitoring network, as shown on
the map at right. All CO
samplers are operated year-
round and employ TEI 48i- TLE
analyzers (RFCA-0981-054),
which DEEP is transitioning to
TEI 48iQ analyzers (RFCA-0981-
054). Of the 3 sites, New Haven
and Cornwall satisfy the
requirement for CO monitoring at
NCore sites and Hartford fulfills
requirements for co-location with
an NO 2 near road monitor in a
CBSA having a population
greater than 1 million. 9 The EPA
Regional Administrator has not
indicated any locations in the
state for additional CO
monitoring aimed at susceptible
and vulnerable populations.
SO2 Monitoring
DEEP currently operates three
sulfur dioxide (SO 2 ) sites in the air
monitoring network
All samplers are TEI 43i-TLE SO 2
analyzers (EQSA-0486-060) and
are operated year-round. Both 1-
hour average and 5-minute block
average SO 2 data are validated
and reported to EPA. DEEP is
replacing the older 43i-TLE units
with TEI 43iQTL SO 2 analyzers
(EQSA-0486-060).
The network requirements for SO 2
monitoring include NCore,
population-weighted emissions
index (PWEI) and Regional
Administrator-required
monitoring. 10 The Cornwall and
9
76 FR 54294; August 31, 2011
10
75 FR 35520; June 22, 2010Connecticut 2020 Annual Air Monitoring Network Plan 20
New Haven sites satisfy the NCore SO 2 requirement.
Table 6 shows the PWEI values for CBSAs that are within or intersecting Connecticut, based on the 2014
National Emissions Inventory and US Census Bureau 2015 county population estimates. The SO 2 NAAQS
monitoring requirements based on PWEI values state that a monitor is required in areas having PWEI
values greater than or equal to 5,000 MMperson-tons/yr. Therefore, no PWEI SO 2 monitors are currently
required in the state. In addition, the EPA has not indicated any additional SO 2 monitors in areas having
the potential to violate the NAAQS, areas where vulnerable or sensitive populations may be impacted, or
near large sources not conducive to modeling. We also note that the SO 2 primary design values, as
provided in an earlier section of this Network Plan, range from 2 to 4 ppb, and are well below the 1-hour
NAAQS of 75 ppb.
Although not covered by PWEI requirements, DEEP intends to continue SO 2 monitoring at Bridgeport
Roosevelt School at this time, given that it is located in an area of higher concentrations, vulnerable and
sensitive populations and a large emission source. The source, Bridgeport Harbor Unit 3, is scheduled for
a complete shutdown in 2021.
Table 6: Population Weighted Emissions Index (PWEI) Values for Connecticut CBSAs
SO 2 PWEI (MMperson-
Core-Based Statistical Area (CBSA) (tpy) Population tons/yr)
Bridgeport-Stamford-Norwalk, CT 3573.11 948053 3387
Hartford-West Hartford-East Hartford, CT 3762.76 1211324 4558
Torrington, CT 731.01 183603 134
New Haven-Milford, CT 2690.13 859470 2312
Norwich-New London, CT 1209.38 271863 329
Worcester, MA-CT 2258.63 935536 2113Connecticut 2020 Annual Air Monitoring Network Plan 21
Detailed Site Information
The following section presents detailed information for each monitoring site, such as: identification code,
location, history, monitored parameters, monitoring objectives, history and descriptive information.
Town – Site: Pomfret – Abington
County: Windham Latitude: 41.84046°
Address: 80 Ayers Road Longitude: -72.010368°
AQS Site ID: 09-015-9991 Elevation: 209 m (686 ft)
Spatial Scale: Regional Year Established: 1993
Statistical Area: CBSA Willimantic, CT
This site is not under the operational control or purview of DEEP and is included in this
Network Plan for informational purposes only
Dew Point / Rel. Humidity
PM2.5 (Continuous - FEM)
PM Speciation (IMPROVE)
PM2.5 (FRM, Collocated)
PM10/PM-Coarse (FRM)
Lead-PM10 (Collocated)
PM2.5 Carbon (BC/UVC,
PM10/PM-Coarse (FRM,
PM Speciation (CSN)
Barometric Pressure
PM10/PM-Coarse
Solar Radiation
Wind Direction
NO/NO 2 /NOx
VOCs (PAMS)
(Continuous)
PM2.5 (FRM)
Traffic Count
Temperature
Continuous)
Wind Speed
Collocated)
Lead-PM10
Direct NO 2
NO/NOy
Ozone
SO2
CO
X
X=Existing P = Planned in 2019/20 T = Proposed to terminate in 2019/2020
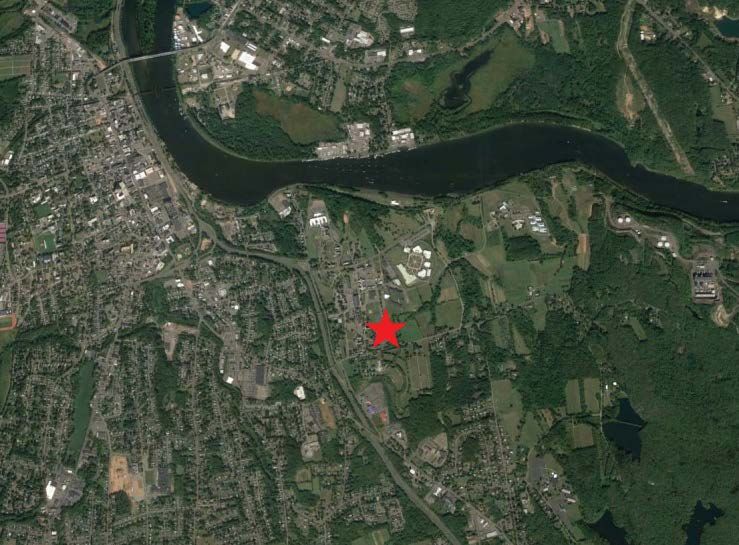
Site Description: The Abington site is a regional-scale site located in a rural/agricultural area in
northeast Connecticut in the town of Pomfret. This site is operated by the National Park Service under
the direction of EPA as part of their Clean Air Status and Trends Network (CASTNET). It is located on a
hilltop approximately 2.3 km south of State Route (SR) 44 and 0.6 km east of SR 97. The site includes
a portable shed located in the center of an agricultural field that is surrounded by forest. DEEP tracks
ambient air quality and quality assurance data from the site but is not responsible for site operations
and planning.
Monitoring Objectives: The Abington monitoring site objective is to collect ozone measurements to
assess long-terms trends as part of the national CASTNET network. The site will also be used to
determine compliance with the ozone NAAQS in Windham County.
Planned changes for 2020-2021: This site is not under the operational control or purview of DEEP
and is included in this Network Plan for informational purposes only.Connecticut 2020 Annual Air Monitoring Network Plan 22
Town – Site: Bridgeport – Roosevelt School
County: Fairfield Latitude: 41.17086°
Address: Park Avenue Longitude: -73.19476°
AQS Site ID: 09-001-0010 Elevation: 7 m (23 ft)
Spatial Scale: Neighborhood Year Established: 1982
Statistical Area: CSA (New York-Newark-Bridgeport)
PM2.5 Carbon (BC/UVC, Continuous)
PM10/PM-Coarse (FRM, Collocated)
PM10/PM-Coarse (Continuous)
Dew Point / Rel. Humidity
PM2.5 (Continuous - FEM)
PM Speciation (IMPROVE)
PM2.5 (FRM, Collocated)
PM10/PM-Coarse (FRM)
Lead-PM10 (Collocated)
PM Speciation (CSN)
Barometric Pressure
Solar Radiation
Wind Direction
NO/NO 2 /NOx
VOCs (PAMS)
PM2.5 (FRM)
Traffic Count
Temperature
Wind Speed
Lead-PM10
Direct NO 2
NO/NOy
Ozone
SO2
CO
1/6 X X X X
X=Existing P = Planned in 2020/21 T = Proposed to terminate in 2020/21
Site Description: The Roosevelt School site is a neighborhood-scale site located in southwestern
Connecticut in the city of Bridgeport. This site is located 50 m to the north of I-95 and 200 m to the
west of the I-95 and Rte 8 interchange. This coastal site is located in a schoolyard and residential
neighborhoods are present in every direction of the site. This site meets all siting requirements and
criteria and has been approved internally by DEEP and independently by EPA Region I.
Monitoring Objectives: The Bridgeport Roosevelt School monitoring site objectives include collecting
continuous FEM PM 2.5 measurements for compliance purposes and for AQI and forecasting purposes.
The PM 2.5 FEM is designated as the primary sampler to for NAAQS.
Planned changes for 2020-2021: DEEP proposes no changes in 2020-2021Connecticut 2020 Annual Air Monitoring Network Plan 23
Town – Site: Cornwall – Mohawk Mountain
County: Litchfield Latitude: 41.82140°
Address: Mohawk Mountain Longitude: -73.29733°
AQS Site ID: 09-005-0005 Elevation: 505 m (1656 ft)
Spatial Scale: Regional Year Established: 1988
Statistical Area: CSA (New York-Newark-Bridgeport)
PM2.5 Carbon (BC/UVC, Continuous)
PM10/PM-Coarse (FRM, Collocated)
PM10/PM-Coarse (Continuous)
Dew Point / Rel. Humidity
PM2.5 (Continuous - FEM)
PM Speciation (IMPROVE)
PM2.5 (FRM, Collocated)
PM10/PM-Coarse (FRM)
Lead-PM10 (Collocated)
PM Speciation (CSN)
Barometric Pressure
Solar Radiation
Wind Direction
NO/NO 2 /NOx
VOCs (PAMS)
PM2.5 (FRM)
Traffic Count
Temperature
Wind Speed
Lead-PM10
Direct NO 2
NO/NOy
Ozone
SO2
CO
1/3 X X 1/3 X X X X X X X X X X X
X=Existing P = Planned in 2020/21 T = Proposed to terminate in 2020/2021
Site Description: The Mohawk Mountain site is a rural regional-scale site located in northwestern
Connecticut in the town of Cornwall. The site is located at the summit of Mohawk Mountain with an
elevation of 505 m (1656 ft), and is approximately 17 km to the east of the New York border and 25
km to the south of the Massachusetts border. This site meets all siting requirements and criteria and
has been approved by EPA as an NCore site.
Monitoring Objectives: The primary monitoring objectives are to meet NCore requirements for O 3 ,
CO, SO 2 , NO, NOy, PM 2.5 FRM, PM 10 FRM, PM 10-2.5 FRM, PM 2.5 speciation, continuous PM 2.5 and surface
meteorology. PM 2.5 chemical speciation measurements are collected through the IMPROVE network as
one-in-three day 24-hour samples and by continuous analyzers for fine particulate carbon parameters
(BC/UVC).
Planned changes for 2020-2021: None.Connecticut 2020 Annual Air Monitoring Network Plan 24
Town – Site: Danbury – Western Connecticut State University
County: Fairfield Latitude: 41.398692°
Address: White Street Longitude: -73.443148°
AQS Site ID: 09-001-1123 Elevation: 116 m (380 ft)
Spatial Scale: Neighborhood Year Established: 1974
Statistical Area: CSA (New York-Newark-Bridgeport)
PM2.5 Carbon (BC/UVC, Continuous)
PM10/PM-Coarse (FRM, Collocated)
PM10/PM-Coarse (Continuous)
Dew Point / Rel. Humidity
PM2.5 (Continuous - FEM)
PM Speciation (IMPROVE)
PM2.5 (FRM, Collocated)
PM10/PM-Coarse (FRM)
Lead-PM10 (Collocated)
PM Speciation (CSN)
Barometric Pressure
Solar Radiation
Wind Direction
NO/NO 2 /NOx
VOCs (PAMS)
PM2.5 (FRM)
Traffic Count
Temperature
Wind Speed
Lead-PM10
Direct NO 2
NO/NOy
Ozone
SO2
CO
1/6 X X X X X X X X
X=Existing P = Planned in 2020/21 T = Proposed to terminate in 2020/2021
Site Description: The Western Connecticut State University (WCSU) site is a neighborhood-scale site
for PM 2.5 and an urban-scale site for O 3 , located in western Connecticut in the city of Danbury. This
site is located on the top level of a parking garage on the WCSU campus. This site is located
approximately 140 m to the southeast of I-84 on White Street. Residential neighborhoods are located
in all directions of the site. This site meets all siting requirements and criteria and has been approved
by EPA Region I. The downtown area of Danbury has a generally bowl-shaped topography, and
therefore is subject to occasional high PM 2.5 events during the winter.
Monitoring Objectives: The Danbury WCSU monitoring site objectives include collecting PM 2.5 and
PM 10 /PM 10-2.5 measurements for NAAQS compliance and for AQI forecasting purposes. Ozone is
measured at the Danbury site for compliance assessment and AQI forecast reporting. Black carbon
(BC/UVC) aethalometer monitoring is included to track the wood smoke contribution to PM pollution.
Planned changes for 2020-2021: None.You can also read