Penrith
Local Emergency
Management Plan
←
→
Page content transcription
If your browser does not render page correctly, please read the page content below
Penrith Local Emergency Management Plan
Penrith Local Emergency Management Plan

Part 1 – Administration

Authority

The Penrith Local Emergency Management Plan (EMPLAN) has been prepared by the
Penrith Local Emergency Management Committee in compliance with the State Emergency
& Rescue Management Act 1989.

APPROVED

………………………………………………………

Chair

Penrith Local Emergency Management Committee

Dated: 24January 2021

Review November 2020            Page 2 of 43            Printed 1/02/2021 8:43 AM
Penrith Local Emergency Management Plan

Contents

Part 1 – Administration ......................................................................................................... 2
   Authority ............................................................................................................................ 2
   Contents............................................................................................................................ 3
   Purpose............................................................................................................................. 5
   Objectives ......................................................................................................................... 5
   Scope ................................................................................................................................ 5
   Principles .......................................................................................................................... 6
   Test and Review Process ................................................................................................. 6
Part 2 – Community Context................................................................................................. 7
   Annexure A – Community Profile ...................................................................................... 7
      General.......................................................................................................................... 7
      Landform and Topography ............................................................................................ 9
      Climate .......................................................................................................................... 9
Cujrrent Climate and weather events ..................................................................................10
      Temperature .................................................................................................................10
      Rainfall .........................................................................................................................10
      Flooding........................................................................................................................10
      Fire Weather .................................................................................................................12
      Projected Weather ........................................................................................................12
      Temperature .................................................................................................................13
      Temperature Extremes .................................................................................................14
      Rainfall .........................................................................................................................14
      Extreme Rainfall ...........................................................................................................14
      Fire Weather .................................................................................................................15
      Land Use ......................................................................................................................15
      Land Use Zone / Type / Classification ..........................................................................20
      Area (sq km) .................................................................................................................20
      % of LGA ......................................................................................................................20
      Population and People .................................................................................................20

Review November 2020                                 Page 3 of 43                             Printed 1/02/2021 8:43 AM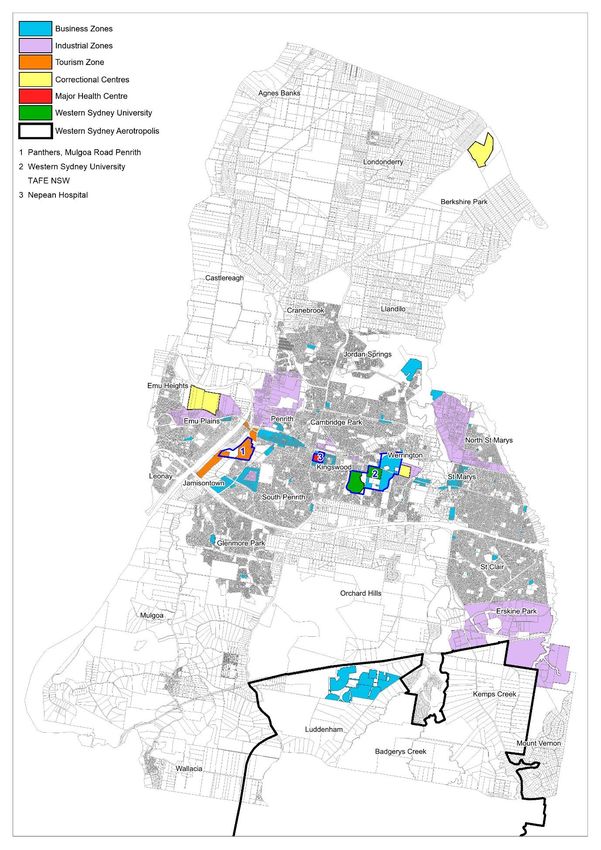
Penrith Local Emergency Management Plan

    Transport Routes and Facilities ....................................................................................25
 YS ....................................................................................................................................26
    Major Transport Routes & Waterways ..........................................................................27
    Economy and Industry ..................................................................................................28
 Annexure B – Hazards and Risks Summary ....................................................................37
 Annexure C – Local Sub Plans, Supporting Plans and Policies .......................................41

Review November 2020                               Page 4 of 43                              Printed 1/02/2021 8:43 AM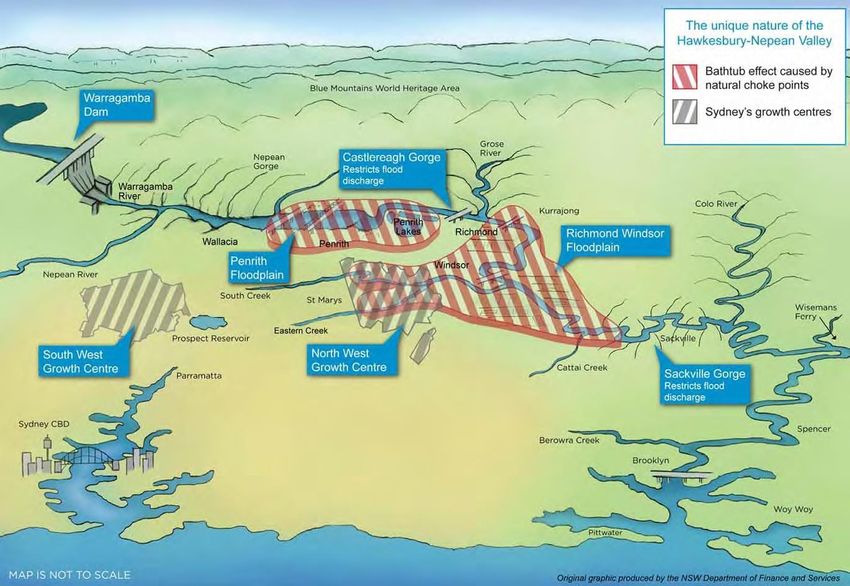
Penrith Local Emergency Management Plan

Purpose

Details arrangements for, prevention of, preparation for, response to and recovery from
emergencies within the Local Government Area(s) covered by this plan.

It encompasses arrangements for:

   •   emergencies controlled by combat agencies;
   •   emergencies controlled by combat agencies and supported by the Local Emergency
       Operations Controller (LEOCON);
   •   emergency operations for which there is no combat agency; and
   •   circumstances where a combat agency has passed control to the LEOCON.

Objectives

The objectives of this plan are to:

   •   define participating organisation and Functional Area roles and responsibilities in
       preparation for, response to and recovery from emergencies;
   •   set out the control, co-ordination and liaison arrangements at the Local level;
   •   detail activation and alerting arrangements for involved agencies; and
   •   detail arrangements for the acquisition and co-ordination of resources.

Scope

The plan describes the arrangements at Local level to prevent, prepare for, respond to and
recover from emergencies and provides policy direction for the preparation of Sub Plans and
Supporting Plans:

   •   Arrangements detailed in this plan are based on the assumption that the resources
       upon which the plan relies are available when required; and
   •   The effectiveness of arrangements detailed in this plan are dependent upon all
       involved agencies preparing, testing and maintaining appropriate internal instructions,
       and/or standing operating procedures.

Review November 2020                  Page 5 of 43             Printed 1/02/2021 8:43 AM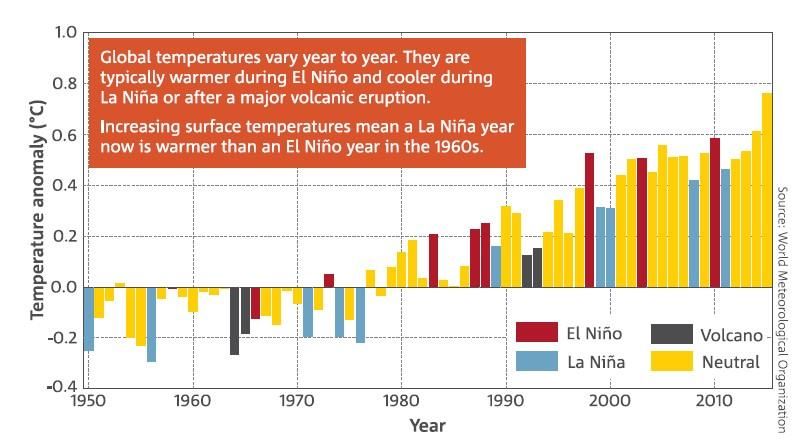
Penrith Local Emergency Management Plan

Principles

The following principles are applied in this plan:

   a) The Emergency Risk Management (ERM) process is to be used as the basis for
      emergency planning in New South Wales. This methodical approach to the planning
      process is to be applied by Emergency Management Committees at all levels.
   b) Responsibility for preparation, response and recovery rests initially at Local level. If
      Local agencies and available resources are not sufficient they are augmented by
      those at Regional level.
   c) Control of emergency response and recovery operations is conducted at the lowest
      effective level.
   d) Agencies may deploy their own resources from their own service from outside the
      affected Local area or Region if they are needed.
   e) The Local Emergency Operations Controller (LEOCON) is responsible, when
      requested by a combat agency, to co-ordinate the provision of resources support.
      EOCONs would not normally assume control from a combat agency unless the
      situation can no longer be contained. Where necessary, this should only be done after
      consultation with the Regional Emergency Operations Controller (REOCON) and
      agreement of the combat agency and the appropriate level of control.
   f) Emergency preparation, response and recovery operations should be conducted with
      all agencies carrying out their normal functions wherever possible.
   g) Prevention measures remain the responsibility of authorities/agencies charged by
      statute with the responsibility.

Test and Review Process

The Penrith Local Emergency Management Committee (LEMC) will conduct exercises
annually to test the Plan, and will review the Plan every three (3) years, or following any:

   •   activation of the Plan in response to an emergency;
   •   legislative changes affecting the Plan; and
   •   exercises conducted to test all or part of the Plan.

Review November 2020                 Page 6 of 43              Printed 1/02/2021 8:43 AM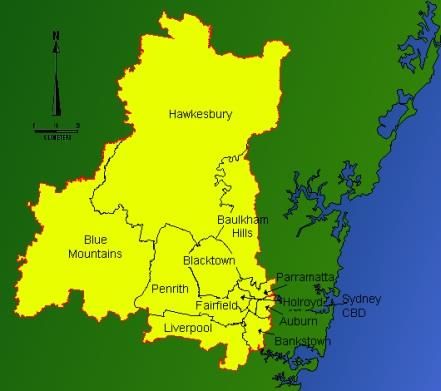
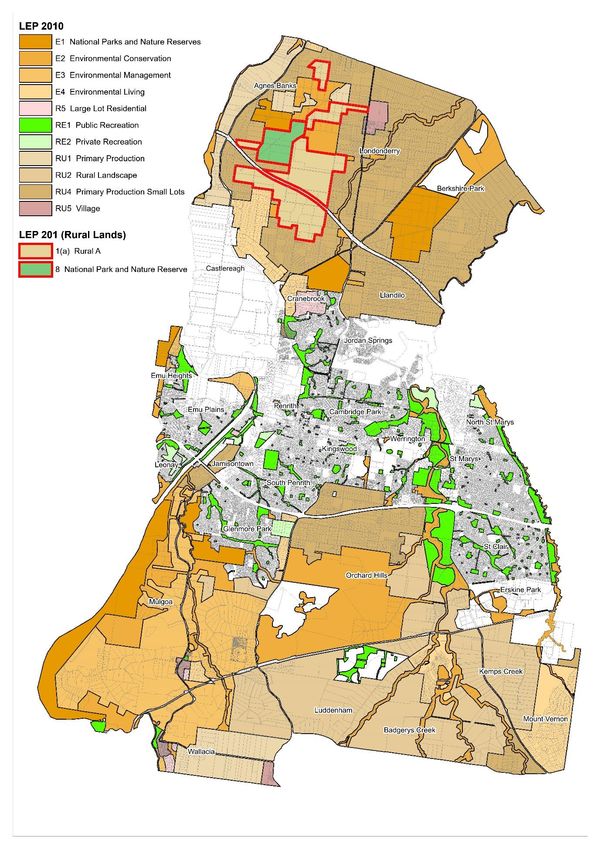
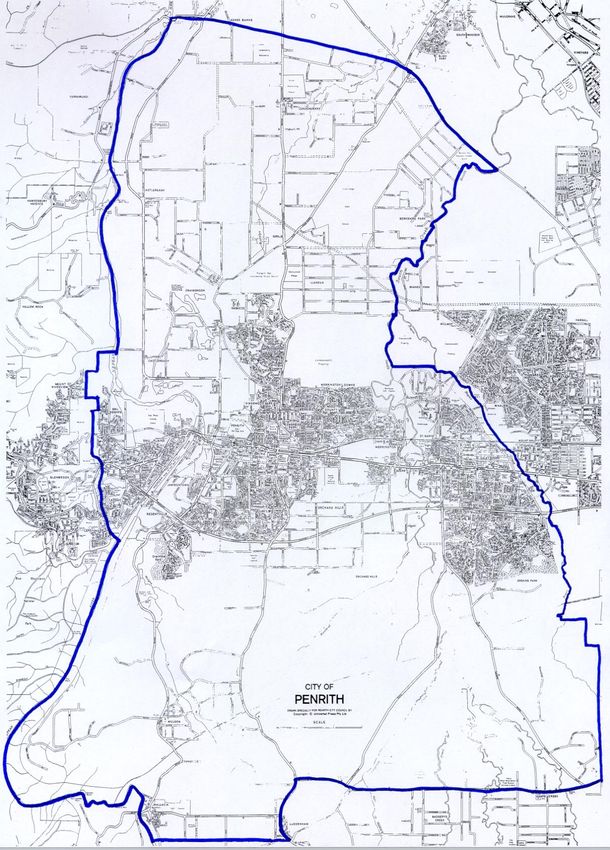
Penrith Local Emergency Management Plan

Part 2 – Community Context

Annexure A – Community Profile

General
Penrith City is located at the western fringe of the Sydney metropolitan area - approximately
54 kilometres from the Sydney GPO. Penrith City is bounded by Hawkesbury City in the
north, Blacktown City and Fairfield City in the east, Liverpool City and Wollondilly Shire in
the south and Blue Mountains City in the west

Review November 2020                 Page 7 of 43              Printed 1/02/2021 8:43 AM
Penrith Local Emergency Management Plan

Penrith City contains a blend of urban and rural communities which include Agnes Banks
(part), Badgerys Creek (part), Berkshire Park, Caddens, Cambridge Gardens, Cambridge
Park, Castlereagh, Claremont Meadows, Colyton, Cranebrook, Emu Heights, Emu Plains,
Erskine Park, Glenmore Park, Jamisontown, Jordan Springs, Kemps Creek (part),
Kingswood, Kingswood Park, Leonay, Llandilo, Londonderry, Luddenham (part), Mount
Vernon, Mulgoa, , Mulgoa Rise, North Penrith, North St Marys, Orchard Hills, Oxley Park,
Penrith, Regentville, South Penrith, St Clair, St Marys, Wallacia (part), Werrington,
Werrington County and Werrington Downs.

Review November 2020                Page 8 of 43             Printed 1/02/2021 8:43 AM
Penrith Local Emergency Management Plan

Landform and Topography
Topography of the Penrith LGA is variable with elevations of between 20m and 240m AHD.

The Penrith area forms part of the physiographic unit commonly referred to as the
Cumberland Plain. The following general description broadly describes the topography,
although local variations do exist.

The highest and steepest areas occur on the Blue Mountains Escarpment at Emu Plains
and along the Nepean Gorge, south of the M4 Motorway Bridge. Flat alluvial plains are
associated with the Nepean River north of the Penrith Town Centre and along the middle to
lower section of South, Ropes and Mulgoa Creeks. Gently to moderately undulating land is
located in the central and southern parts of the LGA. The northern portion of the LGA is
slightly undulating.
Climate
Penrith City is a growing Regional City with projections of an additional 60,000 residents
over the next 20 years.

The Nepean River runs through the City and is a strong part of its identity and a significant
natural asset.

Penrith is part of the Sydney Basin, which covers a significant portion of the central east
coast of NSW, sitting within the lower altitude part of the basin, with the elevated terrain
of the Blue Mountains to the west. The basin has significant effects on the climate of
Penrith.
The topography of the area means that sea breezes from the east don’t reach much of
Western Sydney, including Penrith. This leads to consistently higher temperatures and lower
rainfall in Penrith than in the more coastal parts of Sydney.
Penrith also sits on the Cumberland Plain, which comprises gently undulating plains and
low hills formed on sediments of the Wiannamatta group of shales, as well as alluvial
deposits along rivers and floodplains. These soils support eucalypt woodland with a grassy
understorey including the Cumberland Plain Woodland, which is listed as critically
endangered, with only 8.5% of its original extent remaining.

Penrith has some large areas of native bushland remaining, supporting around 17% of the
remaining bushland on the Cumberland Plain in Western Sydney. Some of these areas are
part of the national reserve system, however significant areas of bushland are also found on
private land.

Review November 2020                  Page 9 of 43               Printed 1/02/2021 8:43 AM
Penrith Local Emergency Management Plan

Cujrrent Climate and weather events
Penrith’s climate has a warm to hot summers and cool to mild winter based on historical
temperature and humidity (Refer to Table X - BoM website).
                      Jan      Feb     Mar     Apr    May    Jun    Jul     Aug    Sep    Oct    Nov    Dec    Annual

Mean Max Temp          30.7     29.4   27.6    24.5   21.1   18.1   17.7    19.8   23.2   25.9   27.3   29.2     24.5

Mean No. days >=

35C                      6.8     3.2     0.9      0      0     0      0       0     0.1    1.2    3.1     4      19.3

Mean Min Temp          18.5     18.5   16.7    13.2    9.3    6.9    5.5     6.2    9.4   12.1    15    16.9     12.4

Mean Rainfall (mm)    100.8    121.4   69.2    51.1   38.8   59.9   30.6    31.4    32    53.4   85.7   62.4    728.1

Mean No. days of

Rain                   11.7     11.4   11.5    10.6   11.2   15.1   12.1     8.6    7.9    9.3   12.3   10.8    132.5

Mean No. days of

Rain >= 25mm             1.3     1.5     0.6    0.5    0.4    0.6    0.1     0.3    0.2    0.5    0.9    0.6      7.5

Table X - Penrith Lakes Weather Station Data (1995 – 2016)

Temperature
Long term temperature records show an increase across the whole Sydney Metropolitan
area since the 1960’s. The most sustained period of warming has occurred in the most
recent decades. This is borne out by data from local weather stations at Orchard Hills and
Penrith Lakes.

The mean annual maximum temperature between 1995 and 2016 recorded at Penrith
Lakes was 24.5°C compared with a mean annual maximum temperature of 23.4°C
recorded between 1970 and 1989 at Orchard Hills. Mean annual minimum temperature for
the same time period at Penrith Lakes is 12.4°C compared with 11.6°C at Orchard Hills.

Average maximum temperatures in summer range from 28 to 30°C while in winter average
minimum temperatures range from 5 to 10°C. There are on average 19 hot days (>35°C)
each year.

Rainfall
Rainfall can vary considerably from year to year in Penrith due to the influence of larger
scale climate patterns such as the El Nino Southern Oscillation. Annual average rainfall in
Penrith is 728 mm, with more rainfall generally experienced in summer and autumn than
winter and spring. Thunderstorm activity during summer in Penrith usually occur between
January and March and show an increase in severity that was experienced particularly
during the 2019 summer season.

Flooding
Penrith City lies within the Hawkesbury-Nepean Catchment and is dominated by rivers,
creeks, waterways and associated tributaries, the most significant being the Nepean River
and South Creek. Both systems are accompanied by wide open floodplains and generally

Review November 2020                             Page 10 of 43                        Printed 1/02/2021 8:43 AM
Penrith Local Emergency Management Plan drain from south to north. There are 40 creek systems and associated catchment areas, all draining into either the Nepean River or South Creek. The natural landscape of the Hawkesbury-Nepean River system makes it prone to flooding, as floodwaters are trapped by the topography. Flooding of the river has a high level of risk as water levels are prone to rising quickly, with low lying exit routes and development of low lying areas. Figure Y: The two main floodplains in the Hawkesbury-Nepean Valley The Overland Flow Flood Overview Study undertaken in 2006 states that large areas of the Penrith LGA are subject to mainstream flooding from the Nepean River and South Creek. In a 1 in 100 Average Recurrence Interval (ARI) event, approximately 29 square kilometres of Nepean River floodplain, and 23 square kilometres of South Creek floodplain would be inundated. In addition, there are numerous tributaries of these waterways that have significant floodplain areas within the LGA as a result of local catchment flooding. More than 14,000 properties were identified as being affected by flooding in a 1 in 100 year ARI event. Significant flood events have been experienced in the area with the largest occurring in 1867.This flood resulted in loss of life, destruction of property and livestock, flooding Emu Plains, Castlereagh and the lower parts of Penrith. Other significant flooding events occurred in March 1978, August 1986, April-May 1988, and August 1990. The most recent flood event, which was only minor, occurred in 2015. Review November 2020 Page 11 of 43 Printed 1/02/2021 8:43 AM
Penrith Local Emergency Management Plan

Fire Weather
The Bureau of Meteorology (BoM) reports that there has been an increase in extreme fire
weather, and a longer fire season, across large parts of Australia since the 1970s. In NSW
the fire season, which generally runs from October to March, is starting earlier and lasting
longer, with fire weather extending into spring and autumn.

Fire weather is classified by the BoM as ‘severe’ when the Forest Fire Danger Index (FFDI)
is above 50. The FFDI combines observations of temperature, humidity and wind speed
with an estimate of the state of ‘fuel’. FFDI in Sydney is only available for Richmond and
Sydney Airport. Severe fire weather conditions are estimated to occur on average 1 day
per year at Sydney Airport and 1.8 days per year at nearby Richmond. Penrith’s FFDI is
expected to be much closer to the conditions recorded at Richmond, with a higher risk of
bushfires than more coastal parts of Sydney.
The 2013-14 bush fire season saw 195 homes destroyed in the nearby communities of
Yellow Rock and Winmalee in the Blue Mountains. Extreme fire weather is increasing in
Australia’s southeast. During the February 2017 heatwave, nearly 100 bushfires were
ignited through parts of inland NSW.

The 2019-20 bushfire season significantly affected the eastern coast of NSW. The
bushfires in total burned more than 5.5 million hectares of bushland and destroyed 2,448
homes throughout the State.

Whilst the Penrith LGA was seriously not affected by the 2019 bushfire events, adjoining
Local Government Areas of Wollondilly Shire, Blue Mountains, and Hawkesbury Local
Government Ageas were significantly impacted, with significant loss of bushland and
building structures in those areas.

Projected Weather
Global average annual carbon dioxide levels are steadily increasing, reaching 399 parts
per million in 2015. This increase in global carbon dioxide levels acts to increase the
temperature of the Earth’s surface, ocean and atmosphere by making it harder for the
Earth to radiate incoming solar radiation back into space. Because carbon dioxide
increases persist in the atmosphere for hundreds of years, future warming and sea level
rises are now considered to be locked in, resulting in unavoidable climate change.

As a result of these changes in our atmosphere 2015 was the warmest year on record
globally since reliable air temperature records began in 1880. The last 15 years are
amongst the warmest 16 years ever recorded. Similarly Australia’s mean surface air
temperature has risen by around 1°C since 1910.

Review November 2020                 Page 12 of 43             Printed 1/02/2021 8:43 AM
Penrith Local Emergency Management Plan

Observations and climate modelling consistently indicate a future of ongoing, long term
climate change interacting with natural variability. These changes are expected to have an
impact on the Penrith environment and community, particularly related to increases in the
frequency or intensity of heat events, fire weather and drought.

The climate change projections referenced in this document are from the NSW and ACT
Regional Climate Modelling (NARCliM) project. The project has produced a suite of twelve
regional climate projections spanning the range of likely future changes in climate. The
information in this document has been sourced from the regional projection for Metropolitan
Sydney (NSW OEH, 2014).

Future climate change projections are provided for two future 20 year time frames: 2020-
2039, referred to as 2030 or ‘Near Future’; and 2060-2079, referred to as 2070 or ‘Far
Future’.

Temperature
Across NSW all of the climate models agree that average, minimum and maximum
temperatures are increasing for the near future and the far future. There is also expected to
be more hot days and fewer cold nights.

In the Sydney metropolitan area maximum temperatures are expected to increase by 0.7°C
in the near future and up to 1.9°C in the far future. Spring will experience the greatest
change in maximum temperatures, increasing by up to 2.2°C in the far future. Increased
maximum temperatures are known to impact human health through heat stress and
increasing the number of heatwave events. They are also likely to impact on the health of
plants and animals and their distribution patterns.

Minimum temperatures are projected to increase by 0.6°C in the near future and up to 2°C
in the far future.

Review November 2020                 Page 13 of 43             Printed 1/02/2021 8:43 AM
Penrith Local Emergency Management Plan

Temperature Extremes
Similarly there is expected to be an increase in the number of hot days experienced in
Penrith. Western Sydney currently experiences between 10 and 20 hot days on average
each year (>35°C). There is projected to be an additional 5 to 10 hot days in the near
future, increasing to 10 to 20 additional hot days each year by 2070.

These hot days are projected to occur mainly in spring and summer, although in the far
future hot days may also extend into autumn.

There is a significant body of research available to demonstrate that prolonged hot days
results in an increased incidence of illness and death, and this is particularly evident for
vulnerable members of the community including the elderly, the very young and those with
chronic diseases.
An increase in the number of hot days is also linked to increased bushfire risk and water
supply, it also has implications for ecosystem and biodiversity health, as well as the
functioning of critical infrastructure.

The Sydney region is also expected to experience fewer cold nights (
Penrith Local Emergency Management Plan

most indices and regions; however, several indices and regions do now show statistically
significant increases.

Fire Weather
Metropolitan Sydney is projected to experience an increase in average and severe fire
weather in the near and far future. Increasing hot days, heatwaves and rainfall deficiencies
in NSW are driving the likelihood of very high fire danger weather.

Land Use
Penrith Council is currently undertaking a review to update the current Rural Lands Study.
The previous study informed the zonings under Penrith’s current Local Environmental Plan
2010 (LEP).

A set of land use zonings and corresponding minimum lot sizes have been established for
rural lands to reflect the desirable land uses for identified localities under Penrith’s LEP.
The land use zonings and minimum lot sizes are:

 RU1 Primary Production                          20 hectares
 RU2 Rural Landscape                             40 hectares
 RU4 Primary Production Small Lots               560 m2
                                                 2 hectares
                                                 1000 hectares
 RU5 Village                                     1000 hectares
                                                 550 m2
                                                 2000 m2
 R5 Large Lot Residential                        4000 m2
                                                 2 hectares
 E1 National Parks and Nature Reserves           40 hectares
                                                 20 hectares
 E2 Environmental Conservation                   20 hectares
                                                 40 hectares
                                                 2 hectares
 E3 Environmental Management                     20 hectares
                                                 40 hectares
                                                 1 hectare
                                                 600 m2
 E4 Environmental Living                         1 hectare
                                                 2 hectares
                                                 20 hectares
                                                 4000 m2

Review November 2020                 Page 15 of 43               Printed 1/02/2021 8:43 AM
Penrith Local Emergency Management Plan Current Rural and Environmental Zonings Review November 2020 Page 16 of 43 Printed 1/02/2021 8:43 AM
Penrith Local Emergency Management Plan

Employment land use

There are significant industrial centres within Penrith LGA. Large commercial/industrial areas
exist at Penrith (Castlereagh Road), St Marys (Dunheved Estate), Emu Plains (Old Bathurst
Road) and Jamisontown. Also, a new emerging centre is located at Luddenham (Sydney
Science Park). A major new development at Erskine Park has also been established under the
State Environmental Plan Western Sydney Employment Area 2009.

A vital centre for health and education in Western Sydney is located within Kingswood and is
known as “The Quarter”. This location covers over 300 hectares between Penrith and St Marys
and is committed to becoming an international destination for investment and excellence in
health care, medical research, education and related technology. Employment facilities in “The
Quarter” include Western Sydney University, NSW TAFE, Nepean Hospital and Nepean Private
Hospital.

Three correctional centres are located within the LGA: Cobham at Kingswood, Emu Plains
Correctional Centre, and John Moroney at Londonderry.

The following map show the existing and future planned employment lands within the Penrith
LGA.

Industries include:
   • Light industry
   • Agriculture
   • Education
   • Health Facilities - The major public hospital in the area is the Nepean Hospital at
       Kingswood.
   • Tourism
   • Correctional Centres

Review November 2020                  Page 17 of 43              Printed 1/02/2021 8:43 AM
Penrith Local Emergency Management Plan Zoned Employment Lands Review November 2020 Page 18 of 43 Printed 1/02/2021 8:43 AM
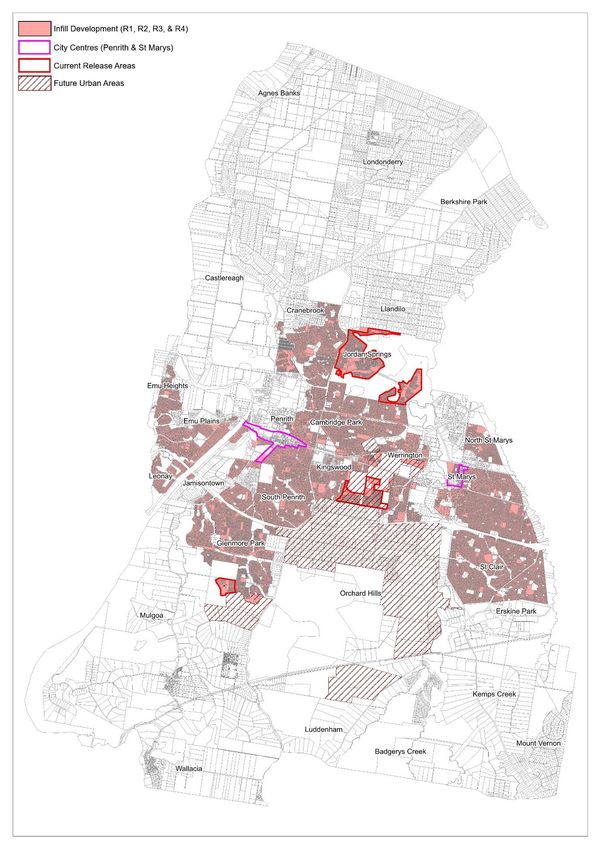
Penrith Local Emergency Management Plan

Residential land use

The following map shows the existing residential zones, City Centres and current and future
release areas within the Penrith LGA.

   Residential Lands

Review November 2020                  Page 19 of 43             Printed 1/02/2021 8:43 AM
Penrith Local Emergency Management Plan

The table below shows the approximate areas as at July 2019, of the various land use zonings
within the Penrith Local Government Area.

 Land Use Zone / Type /      Area (sq km)                 % of LGA
 Classification
 Business Zones              6.44                         2
 Industrial Zones            15.76                        4
 Recreation Zones            24.77                        6
 Residential Zones           57.58                        14
 Rural Zones                 159.8                        40
 Environment Protection      116                          29
 Zones
 Infrastructure Zones        21.12                        5
                             403.8                        100

The Draft Penrith Rural Lands Strategy identifies a range of agricultural activities within the
Penrith LGA that includes a large number of commercial farming and grazing businesses.
These include commercial vegetable businesses, orchards, beef grazing holdings, in
Berkshire Park, Llandilo, Luddenham, Kemps Creek and Badgerys Creek.
There are also 20 egg and poultry farms concentrated in Londonderry, Llandilo,
Luddenham, and Kemps creek.

In addition to these commercial activities there is also a broad range of livestock and
companion animals held by rural landowners.

Nursery and cut flower production is also carried out in the rural areas of Penrith, with
Nurseries in North Cranebrook, Llandilo and Agnes Banks, Orchard Hills, Kemps Creek,
and Mulgoa. Turf farming activities occur along the fertile alluvial plains of the Nepean River
in Agnes Banks and North Castlereagh.

The presence of these activities on rural lands within the Penrith LGA provides potential
implications for emergency service agencies, in Particular the Department of Primary
Industries, managing evacuation of animals in the event of the bushfires and flooding or
isolation of livestock and farming properties in the event of an outbreak of significant plant
and animal communicable diseases.
Population and People
Population statistics were obtained from Profile id data for the Penrith LGA. The Penrith
City Community Profile provides demographic analysis for the City and its suburbs based
on results from the 2011, 2006, 2001, 1996, 1991 Censuses of Population and Housing.
The profile is updated with population estimates when the Australian Bureau of Statistics
(ABS) releases new figures.

In 2016, the total resident population in the Penrith LGA was 201,597, having risen from
184,589 in 2011. This change represented significant growth between these Census
periods, at an average rate of over 1.77% each year. The Penrith City Estimated Resident
Population for 2018 is 209,210, with a population density of 5.17 persons per hectare, an

Review November 2020                  Page 20 of 43              Printed 1/02/2021 8:43 AM
Penrith Local Emergency Management Plan increase from 4.98 persons per hectare in 2016. These figures indicate that Penrith is continuing to experience significant growth in its resident population. The total resident population in the Penrith LGA is expected to experience an increase of over 56,791 people between 2016 and 2036, at an average annual growth rate of 1.25% per annum. This is based on an increase of over 24,272 households for the period, with the average number of persons per household falling from 2.85 to 2.71. The Penrith City population forecast for 2021 is 219,315, and is forecast to reach 258,195 by 2036. This represents an overall population change between 2016 and 2036 of 28.2% as indicated in the graph below. Whilst the overall rate of population increase is expected to average at 1.25% per annum for the twenty year period between 2016 and 2036, higher growth is expected in the five year period between 2016 and 2021 (1.72% per annum). The most recent population projections are based on expected new dwellings in new release areas and some infill development, with more than 24,900 additional dwellings expected by 2036. The highest average annual population increases between 2016 and 2036 are expected to occur within the Caddens release Area (6.0%), Penrith (3.8%), Werrington (3.5%) and the St Marys release area – Jordan Springs (3.5%) (shaded blue in the table below shown in the table below). Review November 2020 Page 21 of 43 Printed 1/02/2021 8:43 AM
Penrith Local Emergency Management Plan

In 2016, the most populous age group in Penrith City was 30-34 year olds, with 15,251
persons and accounting for 7.8% of the total persons. Whereas, In 2011, the dominant age
structure for persons in Penrith City was 0-4 year olds , which accounted for 7.6% of the
population with 13,558 total persons.

In 2021 the most populous forecast age group will be 25-29 year olds, with an estimated
17,333 persons (7.3% of the population).

The 5 year age group with the largest increase in persons between 2016 and 2026 is
forecast to be in ages 75 to 79, which is expected to increase by 3,067 and account for
2.9% of the total persons. The number of people aged under 17 is forecast to increase by
7,463 (14.6%), and will comprise 25.1% of the population. The number of persons aged
over 60 is expected to increase to 10,985 (33.4%) and comprise 18.8% of the total
population by 2026.

Review November 2020                Page 22 of 43            Printed 1/02/2021 8:43 AM
Penrith Local Emergency Management Plan

Household Type

The dominant household type in Penrith is couples with children (37.2%), compared with
couples without children (21.7%). Penrith has a slightly higher proportion of single parent
families (14.1%) compared to Greater Sydney (10.4%).

Ethnicity

Analysis of the country of birth of the population in Penrith City in 2016 compared to the
Greater Sydney shows that there was a smaller proportion of people born overseas
and also a smaller proportion of people from a non-English speaking background.
Overall, 21.6% of the population was born overseas, and 16.8% were from a non-
English speaking background, compared with 36.7%and 35.8% respectively for the
Greater Sydney.
The dominant non-English speaking country of birth in Penrith City was Philippines,
where 1.9% of the population, or 3,797 people, were born.
   The major differences between the countries of birth of the population in Penrith City
   and Greater Sydney were: a smaller percentage of people born in China (0.6%
   compared to 4.7%), and a smaller percentage of people born in Vietnam (0.2%
   compared to 1.7%)

Between 2011 and 2016, the number of people born overseas increased by 5,081 or
12.2%and the number of people from a non-English speaking background increased by
7,053 or 27.2%

Review November 2020                 Page 23 of 43              Printed 1/02/2021 8:43 AM
Penrith Local Emergency Management Plan

The largest changes in birthplace countries of the population in this area between 2011 and
2016 were for those born in:

    •   India (+1,509 persons)
    •   United Kingdom (-747 persons)
    •   Philippines (+724 persons)
    •   New Zealand (+631 persons)

Aboriginality

The Indigenous population Penrith increased from 5,385 in 2011 to 7,740in 2016. As a
proportion of Penrith’s total population, Aboriginal or Torres Strait Islanders make up 3.9%
of the population; this proportion was 3.0% in 2011

Analysis of the Aboriginal and Torres Strait Islander service age groups in Penrith City in
2016 compared to the Aboriginal and Torres Strait Islander population in New South Wales
shows that there was a similar proportion of people in the younger age groups (0 to 17
years) and a lower proportion of people in the older age group (65+ years).
Overall,41.2% of the Aboriginal and Torres Strait Islander population in Penrith City was
aged between 0 and 17, and 3.6% were aged 65 years and over, compared with 30.8%and
5.4% respectively for the Aboriginal and Torres Strait Islander population in New South
Wales.
The major differences between the age groups of the Aboriginal and Torres Strait Islander
population in Penrith City and the Aboriginal and Torres Strait Islander population in New
South Wales were:

           •A   larger percentage of people aged 18 to 24 years (14.5% compared to 12.7%)
           •A   larger percentage of people aged 25 to 34 years (14.2% compared to 12.8%)
           •A   smaller percentage of people aged 50 to 59 years (7.2% compared to 9.1%)

From 2011 to 2016, Penrith City's Aboriginal and Torres Strait Islander population
increased by 2,358 people ( 43.8%). This represents an average annual population change
of 7.53%per year over the period.
The largest changes in age groups of the Aboriginal and Torres Strait Islander population in
this area between 2011 and 2016 were in the age groups:

           •     25 to 34 (+398 people)
           •    18 to 24 (+384 people)
           •    35 to 49 (+366 people)
           •    5 to 11 (+357 people)

Review November 2020                  Page 24 of 43             Printed 1/02/2021 8:43 AM
Penrith Local Emergency Management Plan
Transport Routes and Facilities
The main transport routes through the Region are: -
M4 Motorway
The Driftway/Richmond Road Great Western Highway
The Northern Road Mamre Road
Castlereagh Road Elizabeth Drive
Mulgoa Road Dunheved Road
The Main Western Rail Line connecting Sydney CBD to the Western Districts and Western
NSW.
The rail line traverses East-West through the centre of the city, adjacent to residential,
commercial and industrial areas. The line is used for the transport of people (particularly
during peak hours), hazardous and inert materials.
The consequences of a rail accident will vary, depending on the nature of the incident, with
factors including the type of material being transported (hazardous or inert material), the
time at which the accident occurs, and the location along the rail line relative to adjacent
housing and transport routes.
Incidents which will impact on both internal and external to the Rail network system are
infrequent; however the consequences of such an accident may be high.
Review November 2020 Page 25 of 43 Printed 1/02/2021 8:43 AMPenrith Local Emergency Management Plan
Major aircraft routes traverse the area and include air traffic from Richmond air base,
Mascot, Bankstown, and to a lesser extent to smaller airfield at Camden.
Disruptions on these routes are likely to cause a significant regional problem.
YS
The area’s main waterway is the Nepean River, which is utilised by a wide variety of
watercraft (particularly in summer), including motorboats, rowboats and jet skis.
The area is traversed by smaller, un-navigable waterways flowing in a northerly direction
(see Map below).
Major fresh water storage reservoir facilities exist at:
• Defence Establishment Orchard Hills - The Northern Road, Orchard Hills
• Cranebrook - adjacent to the intersection of Borrowdale Way and The
Northern Road
• Kingswood - Glebe Place
• Erskine Park - adjacent to the corner of Swallow Drive and Chameleon Drive
Review November 2020 Page 26 of 43 Printed 1/02/2021 8:43 AMPenrith Local Emergency Management Plan
Major Transport Routes & Waterways
Review November 2020 Page 27 of 43 Printed 1/02/2021 8:43 AMPenrith Local Emergency Management Plan Economy and Industry Penrith City is a residential and rural area, with most of the population living in residential areas in a linear corridor along the Great Western Highway and the main western railway. The City has a total area of approximately 407 sq km, of which 80% is either rural and/or rural residential. Most of the urban area is residential, with some commercial and industrial areas which include extractive industries and manufacturing. A large portion of the rural area is used for agricultural purposes, including dairy, poultry and hobby farming, orcharding, market gardening and horse breeding. The major commercial centres within the LGA are situated at Penrith and St Marys. The employment statistics in this section have been extracted from data obtained from .id in its economic and industrial profile of Penrith City. The employment statistics were compiled by .id from the National Institute of economic and Industry Research (NIEIR). Employment total is the most accurate and up to date measure of the total number of people employed in Penrith. The workforce in Penrith is made up of all the people who are employed in the local area, regardless of where they live. Workforce statistics reveal how the characteristics of the workforce in Penrith City vary between each industry sector and indicates specific industry sector workforce requirements and employment opportunities. The analysis of the workforce in Penrith City in 2017/2018 identified the three largest employment industries as: • Health Care and Social Assistance (12,573 people or 14.5%) • Construction (11,849 people or 13.7%) • Retail Trade (10,322 people or 11.9%) In combination, these three industries accounted for 37,744 people in total or 40.1%of the workforce. The number of people in the workforce in Penrith City increased by 2,851 between 2013/14 and 2017/18, with the largest changes in employment being for people employed in: • Construction (+3,734 local workers) • Health Care and Social Assistance (+2,495 local workers) • Education and Training (+1,688 local workers); and • Retail Trade (+1,348 local workers) The economic impacts of disasters or emergencies can potentially be devastating given that dwellings, business, and community infrastructure can be damaged and services disrupted with a flow on effect on employment. Businesses and households experience a range of impacts both direct and indirect which, depending on the nature of the emergency/disaster and its severity, that have long and short-term effects. Review November 2020 Page 28 of 43 Printed 1/02/2021 8:43 AM
Penrith Local Emergency Management Plan

Direct impacts result from flood, storm, wind, and bushfire or fire damage to crops, and
damage to commercial/ residential/and public buildings and infrastructure including roads
and services. Indirect impacts result from disruptions to communications and transport
networks.

Indirect impacts may impact on tourism, workers and businesses due to trade losses, loss
of social and business networks and interruptions to the natural resource/raw materials and
product supply chains.

Historical data indicates that the emergencies or disasters most likely to occur in the Penrith
Local Government Area are low impact and short term bushfire and flood (riverine and flash
flooding) emergencies which will have a short term effect but are unlikely to have a ling tern
effect the local Penrith economy.

Review November 2020                 Page 29 of 43              Printed 1/02/2021 8:43 AM
Penrith Local Emergency Management Plan

Employment (total) by industry
Penrith City                                                2017/18                               2012/13                                 Change
                                                                    New South
Industry                                          Number       %                       Number        %     New South Wales%     2012/13 to 2017/18
                                                                      Wales%
Agriculture, Forestry and Fishing
                                                      811     0.9          2.2             722      1.0                   2.2                 +89

Mining
                                                      412     0.5          1.1             493      0.7                   1.2                  -82

Manufacturing
                                                    7,319     8.5          6.5            7,506    10.4                   8.0                -187

Electricity, Gas, Water and Waste Services
                                                    1,089     1.3          0.9            1,042     1.4                   1.1                 +47

Construction
                                                   11,849    13.7          9.3            7,275    10.0                   8.2              +4,574

Wholesale Trade
                                                    2,332     2.7          3.2            2,505     3.5                   4.2                -173

Retail Trade
                                                   10,322    11.9        10.0             8,934    12.3                  10.1              +1,388

Accommodation and Food Services
                                                    6,833     7.9          7.5            5,640     7.8                   7.1              +1,193

Transport, Postal and Warehousing
                                                    5,102     5.9          4.8            4,150     5.7                   5.2                +952

Information Media and Telecommunications
                                                      509     0.6          2.2             633      0.9                   2.6                -124

Financial and Insurance Services
                                                    1,024     1.2          5.0             996      1.4                   5.1                 +28

Rental, Hiring and Real Estate Services
                                                    1,257     1.5          1.7            1,154     1.6                   1.8                +102

Professional, Scientific and Technical Services
                                                    2,879     3.3          8.7            2,436     3.4                   8.3                +443

Review November 2020                       Page 30 of 43              Printed 1/02/2021 8:43 AM
Penrith Local Emergency Management Plan
Penrith City 2017/18 2012/13 Change
New South
Industry Number % Number % New South Wales% 2012/13 to 2017/18
Wales%
Administrative and Support Services
2,569 3.0 3.4 2,130 2.9 3.5 +439
Public Administration and Safety
5,768 6.7 5.8 5,489 7.6 6.0 +278
Education and Training
9,437 10.9 9.1 7,533 10.4 8.2 +1,904
Health Care and Social Assistance
12,573 14.5 13.3 9,660 13.3 11.7 +2,913
Arts and Recreation Services
1,032 1.2 1.6 1,095 1.5 1.7 -63
Other Services
3,305 3.8 3.7 3,081 4.3 3.9 +225
Total Industries 86,420 100.0 100.0 72,473 100.0 100.0 +13,946
Review November 2020 Page 31 of 43 Printed 1/02/2021 8:43 AMPenrith Local Emergency Management Plan
Registered businesses by industry
Penrith City - Total registered businesses 2018 2014 Change
Industry Number % New South Wales % Number % New South Wales % 2014 to 2018
Agriculture, Forestry and Fishing
267 1.9 6.8 275 2.2 7.9 -8
Mining
15 0.1 0.2 19 0.2 0.2 -4
Manufacturing
752 5.2 3.4 686 5.6 3.7 +66
Electricity, Gas, Water and Waste Services
68 0.5 0.3 55 0.4 0.3 +13
Construction
3,527 24.6 16.0 2,958 23.9 14.9 +569
Wholesale Trade
462 3.2 3.6 457 3.7 4.0 +5
Retail Trade
758 5.3 5.7 766 6.2 6.5 -8
Accommodation and Food Services
394 2.8 4.0 315 2.6 4.1 +79
Transport, Postal and Warehousing
1,745 12.2 7.6 1,237 10.0 6.2 +508
Information Media and Telecommunications
74 0.5 1.2 66 0.5 1.2 +8
Financial and Insurance Services
878 6.1 9.1 691 5.6 8.5 +187
Rental, Hiring and Real Estate Services
1,461 10.2 10.9 1,348 10.9 11.1 +113
Professional, Scientific and Technical Services
1,173 8.2 13.1 1,034 8.4 13.0 +139
Administrative and Support Services 627 4.4 4.1 523 4.2 4.0 +104
Review November 2020 Page 32 of 43 Printed 1/02/2021 8:43 AMPenrith Local Emergency Management Plan
Penrith City - Total registered businesses 2018 2014 Change
Industry
Number % New South Wales % Number % New South Wales % 2014 to 2018
Public Administration and Safety
72 0.5 0.4 85 0.7 0.4 -13
Education and Training
218 1.5 1.4 172 1.4 1.4 +46
Health Care and Social Assistance
699 4.9 5.9 581 4.7 5.7 +117
Arts and Recreation Services
196 1.4 1.3 148 1.2 1.3 +48
Other Services
849 5.9 4.0 768 6.2 4.0 +81
Industry not classified
96 0.7 0.9 168 1.4 1.6 -72
Total business
14,332 100.0 100.0 12,355 100.0 100.0 +1,977
Review November 2020 Page 33 of 43 Printed 1/02/2021 8:43 AMPenrith Local Emergency Management Plan
Local workers key statistics - All industries
Penrith City 2016 2011 Change
Name
Number % New South Wales % Number % New South Wales % 2011 to 2016
Local workers
Total local workers (Census)
68,597 100.0 100.0 60,546 100.0 100.0 +8,051
• Males
34,850 50.8 52.6 30,349 50.1 53.3 +4,501
• Females
33,747 49.2 47.4 30,192 49.9 46.7 +3,555
Age structure
15 - 24 years
11,709 17.1 14.0 10,567 17.5 14.5 +1,142
25 - 54 years
43,746 63.8 66.6 39,328 65.0 67.7 +4,418
55 - 64 years
10,646 15.5 15.0 9,045 14.9 14.4 +1,601
65 years and over
2,503 3.6 4.3 1,602 2.6 3.5 +901
Top three industries
Health care and social assistance
9,767 13.5 11.9 8,187 13.2 11.3 +1,580
Retail trade
8,034 11.1 9.2 7,807 12.6 10.1 +227
Education and training
6,943 9.6 8.0 6,277 10.1 7.7 +666
Review November 2020 Page 34 of 43 Printed 1/02/2021 8:43 AMPenrith Local Emergency Management Plan
Penrith City
2016 2011 Change
Name
Number % New South Wales % Number % New South Wales % 2011 to 2016
Top three occupations
Professionals
12,893 18.8 23.6 11,133 18.4 22.7 +1,760
Clerical and administrative workers
9,937 14.5 13.8 9,668 16.0 15.0 +269
Technicians and trades workers
8,729 12.7 12.7 7,831 12.9 13.2 +898
Hours worked
Full time
42,862 62.5 63.1 37,504 61.9 62.9 +5,358
Part time
24,349 35.5 34.9 21,573 35.6 33.1 +2,776
Qualifications
Bachelor or higher degree
15,769 23.0 32.6 11,977 19.8 27.9 +3,792
Advanced diploma or diploma
7,015 10.2 11.1 5,504 9.1 10.5 +1,511
Certificate level
17,341 25.3 22.2 14,747 24.4 22.2 +2,594
No qualifications
26,521 38.7 31.1 25,502 42.1 34.9 +1,019
Individual Income
Less than $500
12,590 18.4 17.2
$500 -$1,749
45,098 65.7 60.8
Review November 2020 Page 35 of 43 Printed 1/02/2021 8:43 AMPenrith Local Emergency Management Plan
$1,750 or more
9,760 14.2 20.5
Method of Travel to Work
Car
52,473 76.5 61.9 44,897 74.2 62.5 +7,576
Public Transport
2,990 4.4 16.0 2,599 4.3 13.8 +391
Bicycle
192 0.3 0.7 270 0.4 0.7 -78
Walked only
1,240 1.8 3.9 1,290 2.1 4.1 -50
Other Characteristics
Born overseas
18,768 27.4 32.8 15,485 25.6 30.1 +3,283
Speaks a language other than English at home
14,409 21.0 26.4 10,611 17.5 22.8 +3,798
Arrived between 2011 and 9th August 2016
2,165 3.2 6.0
Review November 2020 Page 36 of 43 Printed 1/02/2021 8:43 AMPenrith Local Emergency Management Plan
Annexure B – Hazards and Risks Summary
A Local Emergency Risk Management (ERM) Study has been undertaken by the Penrith Local Emergency Management Committee
identifying the following hazards as having risk of causing loss of life, property, utilities, services and/or the community’s ability to function
within its normal capacity. These hazards have been identified as having the potential to create an emergency. The Penrith Local Emergency
Risk Management Study should be referenced to identify the complete list of consequences and risk descriptions.
Combat /
Likelihood Consequence Risk
Hazard Risk Description Responsible
Rating Rating Priority
Agency
An agriculture/horticulture incident that
Agricultural
results, or has potential to result, in the Department of
Disease Possible Moderate High
spread of a communicable disease or Primary Industries
(Animal/Plant)
infestation.
Failure of a major bridge structure with or
without warning owing to structural failure or LEOCON
Bridge Collapse Unlikely Major Medium
as a result of external/ internal events or FRNSW
other hazards/ incidents.
Collapse of building owing to structural FRNSW (USAR)
Building Collapse failure or impact from external/internal event Possible Major High
of other hazards /incidents. LEOCON
Pandemic illness that affects, or has
Communicable
potential to affect, large portions of the Possible Catastrophic Extreme NSW Health
Disease - Human
human population
Review November 2020 Page 37 of 43 Printed 1/02/2021 8:43 AMPenrith Local Emergency Management Plan
Combat /
Likelihood Consequence Risk
Hazard Risk Description Responsible
Rating Rating Priority
Agency
A dam is compromised that results in
Dam Failure Unlikely Catastrophic High NSW SES
localised or widespread flooding.
Earthquake of significant strength that
Earthquake Rare Major Medium LEOCON
results in localised or widespread damage.
NSWRFS in RFS
Fire (Bush or Almost District
Major fires in areas of bush or grasslands. Moderate High
Grass) Certain FRNSW in Fire
District
NSWRFS in RFS
Serious industrial fire in office complexes District
Fire (Industrial) Possible Moderate High
and/or warehouses within industrial estates. FRNSW in Fire
District
NSWRFS in RFS
Serious commercial fires in shopping District
Fire (Commercial) centres, aged persons units, nursing homes Possible Moderate High
and hospitals. FRNSW in Fire
District
Review November 2020 Page 38 of 43 Printed 1/02/2021 8:43 AMPenrith Local Emergency Management Plan
Combat /
Likelihood Consequence Risk
Hazard Risk Description Responsible
Rating Rating Priority
Agency
NSWRFS in RFS
Serious residential fire in medium/high rise District
Fire (Residential) Possible Moderate High
apartments. FRNSW in Fire
District
Heavy rainfall causes excessive localised
Flood (Flash) Likely Moderate High NSW SES
flooding with minimal warning time
River flows exceed the capacity of normal
Flood (Riverine) river systems resulting in flood waters Likely Moderate High NSW SES
escaping and inundating river plains
Hazardous Hazardous material released as a result of
Possible Moderate High FRNSW
Release an incident or accident.
A sequence of abnormally hot conditions
Heatwave having the potential to affect a community Possible Moderate High SEOCON
adversely.
Landslip/landslide resulting in localised or
Landslip Unlikely Insignificant Low LEOCON
widespread damage.
Review November 2020 Page 39 of 43 Printed 1/02/2021 8:43 AMPenrith Local Emergency Management Plan
Combat /
Likelihood Consequence Risk
Hazard Risk Description Responsible
Rating Rating Priority
Agency
Severe storm with accompanying lightning,
hail, wind, and/or rain that causes severe Almost
Storm Moderate High NSW SES
damage and/or localised flooding (includes Certain
tornado)
Aircraft crashes in LGA resulting in large
Transport
number of fatalities, injuries and/or damage Unlikely Major Medium LEOCON
Emergency (Air)
to property.
A major rail accident that disrupts one or
more major transport routes that can result
Transport
in risk to people trapped in train carriages, Unlikely Major Medium LEOCON
Emergency (Rail)
restrict supply routes and/or protracted loss
of access to or from the area.
A major vehicle accident that disrupts one or
more major transport routes that can result LEOCON
Transport
in risk to people trapped in traffic jams, Likely Moderate High
Emergency (Road) NSWPF
restrict supply routes and/or protracted loss
of access to or from the area.
Major failure of essential utility for
Almost
Utilities Failure unreasonable periods of time as a result of Moderate High LEOCON
Certain
a natural or man-made occurrence.
Review November 2020 Page 40 of 43 Printed 1/02/2021 8:43 AMPenrith Local Emergency Management Plan
Annexure C – Local Sub Plans, Supporting Plans and Policies
Responsibility for the preparation and maintenance of appropriate sub and supporting plans
rest with the relevant Combat Agency Controller or the relevant Functional Area Coordinator.
The sub/supporting plans are developed in consultation with the Penrith LEMC and the
community.
The plans listed below are supplementary to this EMPLAN. The sub/supporting plans have
been endorsed by the LEMC and are determined as compliant and complimentary to the
arrangements listed in this EMPLAN.
These plans are retained by the LEMO on behalf of the LEMC and public release versions
are available on the Council Website.
Combat /
Plan/Policy Purpose
Responsible Agency
This Plan covers the
preparedness measures, the
conduct of response
Hawkebury Nepean Flood operations and coordination NSW State Emergency
Emergency State Plan of immediate recovery Service
measures for all levels of
flooding on the Nepean
River
This Plan covers the
preparedness measures, the
conduct of response
operations and coordination
City of Penrith Local Flood NSW State Emergency
of immediate recovery
Plan 2012 Service
measures for all levels of
flooding on the Nepean
River within the boundaries
of the Penrith City.
Review November 2020 Page 41 of 43 Printed 1/02/2021 8:43 AMPenrith Local Emergency Management Plan
Combat /
Plan/Policy Purpose
Responsible Agency
This supporting plan details
the control and coordination
arrangements for the use of
all agricultural and animal
resources available within
State Agriculture and
the State to the Agriculture Department of Primary
Animal Services
and Animal Services Industries/Local Land
Functional Area
Functional Are Coordinator service.
Supporting Plan
for the prevention of,
preparedness for, response
to, and recovery from the
impact and effects of an
emergency
Review November 2020 Page 42 of 43 Printed 1/02/2021 8:43 AMPenrith Local Emergency Management Plan
You can also read