Spatio-temporal mapping of local areas for engaging communities in the planning of smart local energy initiatives
←
→
Page content transcription
If your browser does not render page correctly, please read the page content below
5-133-21 + Rajat Gupta

   Spatio-temporal mapping of local areas for engaging
    communities in the planning of smart local energy
                       initiatives
Rajat Gupta, Pablo Jimenez-Moreno, Angelines Donastorg Sosa
Low Carbon Building Research Group, School of Architecture
Oxford Institute for Sustainable Development, Oxford Brookes University
Oxford OX3 0BP, UK
Email: rgupta@brookes.ac.uk, pjimenez-moreno@brookes.ac.uk, adonastorg-sosa@brookes.ac.uk

Patrick Devine-Wright
College of Life and Environmental Sciences
University of Exeter
Exeter EX4 4RJ, UK
Email: P.G.Devine-Wright@exeter.ac.uk

Abstract
Community engagement in the planning and delivery of smart local energy initiatives is essential for their long-
term success. Spatial and temporal visualisation of local energy flows can be used to engage communities in a
more joined-up way. This paper describes the development and trial of an online and interactive smart local area
energy mapping (LEMAP) tool for planning smart local energy neighbourhoods in Oxfordshire (UK). The spatial-
temporal tool has been designed for community groups and residents.
The LEMAP tool brings together public, private and crowd-sourced data on energy demand, energy resources,
building attributes, socio-demographics, fuel poverty and electricity networks within the ESRI ArcGIS platform.
Postcode and dwelling level energy demand profiles are generated using the CREST energy demand model. The
tool has been organised around three technical and three engagement elements that include ‘baselining’ local area
energy flows in relation to socio-economic characteristics; ‘targeting’ suitable properties for low carbon
technologies (LCT) such as rooftop solar, heat pumps, EV chargers; and ‘forecasting’ energy demand profiles at
postcode level for different LCT scenarios. The engagement elements include: ‘Participatory mapping’ to allow
residents to visualise their energy demand profiles, compare against the neighbourhood and see how the profile
changes with LCTs; ‘Storymap’ for creating blogs on local energy flows; and ‘Forum’ to enable chats amongst
users of LEMAP and project stakeholders.
The LEMAP tool was applied to a socially-deprived but data-rich neighbourhood in Oxford comprising over 2,500
households. A social enterprise organisation in Oxfordshire was trained online to use LEMAP to plan for energy
management at neighbourhood level. Participatory mapping was found to enrich the tool and engage communities
to provide local data through online surveys and highlight any discrepancies in the public and private data through
local data interpretation.

Introduction
The UK has declared plans to decarbonise the built environment by 2050 at the latest, with a 78% reduction in
carbon emissions by 2035 (Gummer et al., 2020a; Gummer et al., 2020b). Net-zero carbon presents a different
challenge from the previous 2050 target of 80% reduction in emissions, which means that where zero-carbon
options exist, these must be deployed (BEIS, 2018; DECC, 2011). In response, over the past ten years, energy
systems have not only become decarbonised and decentralised (local or community energy) but have also
developed in a smart way by becoming more digitised (Ford et al., 2019). Termed as smart local energy systems
(SLES), these systems can help overcome energy network constraints by allowing better control over local energy
demand, distribution and energy supply (DECC, 2014; Gupta & Zahiri, 2020a). This is why the UK Government
has launched the £102 million Prospering from the Energy Revolution (PFER) programme that has co-funded the
development of three large SLES demonstrator projects and ten detailed design projects (UKRI, 2019; Hampton
& Fawcett, 2020).
The growth in SLES is driven not only by achieving local energy management but also by local stakeholders desire
to align the development of energy systems with their community objectives, including alleviating fuel poverty,
community income generation, and improvements in local energy knowledge (Aunedi & Green, 2020).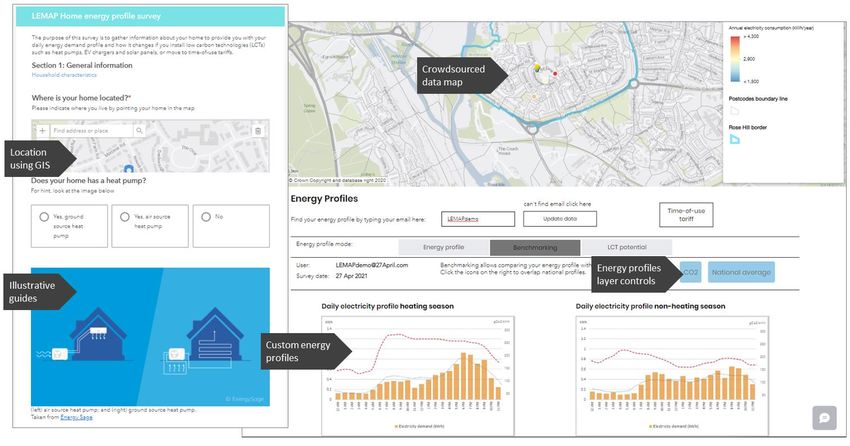
Community-driven local energy projects have been playing a major role in achieving net-zero in the UK by
contributing around 265 MW of renewable electricity generation and 13.1 MW renewable heat to the energy
system (Regen, 2021). Alongside delivering renewable generation, community-based energy projects can facilitate
SLES transition by ensuring that hard-to-reach areas are not left behind and supporting the economic returns of
community-owned generation into the local area. However, a recent meta-study of SLES projects over the last 10
years showed that only 30% of SLES initiatives in the UK provided any evidence of user engagement (Gupta &
Zahiri, 2020b) despite the fact that community engagement in local energy initiatives is essential for their long-
term success.
Geospatial energy mapping tools are emerging as essential tools for helping SLES planning and implementation
given their ability to provide rapid and accurate spatial intelligence (Fonseca & Schueter, 2015, Amado et al.,
2018; Morstyn et al., 2018; Camporeale & Mercader-Moyano, 2021). However, most of the current mapping tools
are technical and have low engagement levels with the target community. These tools have been critiqued for
having information-deficit assumptions about users as they focus on analytics and unidirectional dashboards
(Owens & Driffill, 2008). Instead, energy mapping tools could help to engage communities if these move beyond
a one-way flow of representing local energy flows (Buchanan et al., 2018) to two-way interaction with local
communities who can also offer a local interpretation of data underpinning these tools.
This paper describes the development and trial of an online and interactive smart local area energy mapping
(LEMAP) tool for planning smart local energy neighbourhoods in Oxfordshire designed for community groups
and residents. LEMAP brings together public, private and crowd-sourced data on energy demand, energy
resources, building attributes, socio-demographics, fuel poverty and electricity networks within the ESRI ArcGIS
platform. Postcode and dwelling level energy demand profiles are generated using the CREST energy demand
model. The tool has been organised around three technical and three engagement elements. LEMAP was applied
to a socially-deprived but data-rich neighbourhood in Oxford comprising over 2,500 households. A social
enterprise organisation in Oxfordshire was trained online to use LEMAP to plan for energy management at the
neighbourhood level. The study is part of two research and innovation projects on smart local energy systems -
Project Local Energy Oxfordshire (LEO) and EnergyREV.

Review of local energy mapping tools
The growth in smart local energy initiatives has enabled the rise of spatially-based energy mapping tools and
approaches to help with decision-making at a local scale. Over the last decade, several researchers have explored
how online spatial energy visualisation can contribute to decision-making, design, planning, and implementation
processes in local energy initiatives (Chiang et al., 2012, D’Oca et al., 2014, Wate & Coors, 2015, Flacke & De
Boer, 2017; Camporeale & Mercader-Moyano, 2021). Given the current variety of online mapping tools, an
extensive review of published and grey literature was conducted to identify 53 relevant local energy mapping tools
(18 UK, 23 international, 12 global). These tools were characterised by key criteria that included spatial resolution,
functionality, energy vector, data source, accessibility, form of communication, and target audience, as shown in
Table 1. The review helped to identify any gaps that could be addressed by the proposed energy mapping approach.
Most of the tools identified in Table 1 had a single vector focus (electricity in 35 tools) and operated at sub-station
level (n: 24), and were mainly focussed on visualisation of spatial data (n: 33), indicating one-way flow of
information. About 20 tools had provision for user interaction to query and customise the visualisation of spatial
energy data to extract spatial intelligence. For example, Amado’s et al. (2018) ‘E-City’ web-based approach for
the city of OEIRAS in Portugal presented digital visualisation of the existing municipal GIS system with statistical
zoning and municipal energy demand for local government decision-making with limited opportunity for user
interaction and customisation of results. Furthermore, Google supported project ‘sunroof’ provided a property-
level 2D rooftop view of potential for rooftop solar, however, there was limited ability for spatial data
customisation and multiple property selection, making it unsuitable for planning SLES projects (Castellanos et al.,
2017).
Furthermore, majority (n: 39) of the identified tools were accessibly publicly for visualisation of spatial energy
data, such as the ‘DNO’s web-based tools. Other tools varied public access depending upon the granularity of
spatial data, such as the ‘Non-gas map’ in the UK, which provided public access to off-gas properties at a local
authority level; however, further information at a postcode scale was by registration.
Table 1. Key characteristics of the identified 53 local energy mapping tools
 Criteria           Categories                                              UK      International   Global (including
                                                                          (n:18 )      (n:23 )        UK) (n:12 )

 Spatial            Regional                                               1/18           -                 -
 resolution
                    County                                                 1/18         3/23                -

                    City                                                       -        5/23                -

                    Neighbourhood                                              -          -                 -

                    Substation                                             10/18        8/23              6/12

                    Postcode                                               3/18         3/23                -

                    Property                                               3/18         4/23              6/12

 Functionality      Visualisation of spatial data                          14/18       12/23              7/12

                    Visualisation, customisation and extraction of         4/18        11/23              5/12
                    intelligence of spatial data

 Energy vector      Single vector (Electricity, heat or transport)         11/18       20/23             11/12

                    Multi-vector (Combination of two or more               7/18         3/23              1/12
                    vectors)

 Data source        Publicly available                                     17/18       15/23              2/12

                    Privately available (purchase, registration)           9/18        20/23             10/12

                    Crowd-sourced                                          1/18           -                 -

 Accessibility      Public access                                          14/18       17/23              8/12

                    Limited access by registration                         3/18         5/23              1/12

                    Limited access by purchase                             1/18         1/23              3/12

 Form of            One-way communication                                  14/18       12/23              7/12
 communication
                    Two-way communication                                  4/18        11/23              5/12

 Audience           DNOs                                                   16/18       16/23              9/12

                    Local Authorities                                      12/18        5/23              2/12

                    Community groups                                       1/18         2/23                -

                    Residents                                              1/18           -               1/12

The review revealed several functionality gaps, including (1) lack of visualisation at a neighbourhood spatial scale
level, (2) the scarcity of multi-vector energy focus, (3) lack of utilisation of crowd-sourced data and (4) limited
focus on residents and community groups. The proposed local area energy mapping approach (LEMAP) was
designed to address these gaps by adopting a spatio-temporal approach for planning smart local energy initiatives
while engaging community groups and residents. These aspects are further described in the following sections.

Methods and case study
The development and refinement of the proposed LEMAP tool was conducted systemically through a series of
stages. Firstly, data were gathered from different private and public sources, which led to the initial development
of the tool. Then, the working of the tool was demonstrated by applying it to a case study neighbourhood area in
Oxford. Finally, the tool was trialled with a sample of target users and feedback was gathered to refine the tool.
Approach for developing LEMAP
LEMAP was created to spatially and temporally visualise local energy flows and energy profiles in an intuitive
manner to help with the planning of smart local energy initiatives (called smart and fair neighbourhoods). The tool
development processes consisted of: (1) gathering relevant energy, buildings and socio-economic data; (2)
generating maps and energy profiles using the collected data; (3) creating a website to display maps and energy
profiles technically (4) developing the engagement elements; (5) enabling two-way communication and interaction
with users (6) improving the tool based on feedback from the trial (Figure 1).
Figure 1. LEMAP development flowchart. (SFN— Smart and Fair Neighbourhoods).
To address the needs of different users, LEMAP was organised around three technical and three engagement
elements. The technical elements were targeted towards project teams (local authorities) and intermediaries (e.g.
community interest companies, project managers of smart local energy initiatives) involved in planning SLES
projects, while the engagement elements were designed for engaging residents and community groups. The
technical elements included ‘baselining’ local area energy flows in relation to socio-economic characteristics;
‘targeting’ suitable properties for low carbon technologies (LCT) such as rooftop solar, heat pumps, EV chargers;
and ‘forecasting’ energy demand profiles at postcode level for different LCT scenarios. The engagement elements
include: ‘Participatory mapping’ to allow residents to visualise their energy demand profiles, compare against the
neighbourhood and see how the profile changes with LCTs; ‘Storymap’ for creating blogs on local energy flows;
and ‘Forum’ to enable chats amongst users of LEMAP and project stakeholders. LEMAP was constructed on the
ESRI ArcGIS platform using spatial data in the form of shapefiles from sources such as OS Mastermap, Geomni,
Energeo, BEIS sub-national data, EPCs.
Two-way communication was developed in four ways that included: (1) enabling map interaction through filters
and queries (2) displaying elements, maps and corresponding data via buttons and menu bars; (3) filtering energy
profiles and benchmarking data at postcode and dwelling level (using email); and by (4) enabling users and
stakeholders to add content and comments.
Data sources
LEMAP brought together disparate data sources, including publicly-available, privately-available and crowd-
sourced datasets on energy demand, energy resources, building attributes, socio-demographics, fuel poverty and
electricity networks within the ESRI ArcGIS platform.
Public data - were data accessible to the public, that included data from the Department for Business,
Energy and Industrial Strategy (BEIS) on sub-national annual electricity and gas consumption (domestic
and non-domestic) at different spatial scales (MSOA, LSOA, postcode), as well as energy performance
certificates (EPC’s) data for domestic and non-domestic properties from the Ministry of Housing,
Communities and Local Government. Data cleaning was done to make these datasets spatially mappable.
Private data - were datasets accessible through special permissions or purchase, such as Geomni’s UK
national building database, Ordnance Survey (OS) data on administrative boundaries and building
footprints, including building area, built form, property type, and other building attributes.
Crowd-sourced data - were data acquired from residents through an online survey on dwelling attributes,
household characteristics and energy use. Crowd-sourced data helped to enhance communityparticipation by enabling addition of contextual detail and provision of customised results to residents
about their dwelling energy profiles and potential for low carbon technologies. Crowd-sourced data were
only displayed with the consent of the user to maintain data privacy.
Energy modelling method
Daily energy profiles were generated using the published CREST Energy Demand Model v2.3.3 (CREST)
developed by Loughborough University, which is a high-resolution stochastic model of domestic thermal and
electricity demand that produce hourly energy profiles based on user input. CREST runs on Excel Visual Basic
(VBA) platform and allows input parameters to be adapted for customised results (McKenna & Thomson, 2016;
Pimm et al., 2018). The CREST model was adapted for the case study neighbourhood location and programmed
to provide results for a weekday in the heating season and a weekday in the non-heating season, set to the closest
days to the solstices, i.e. 20th December 2019 and 19th June 2020 respectively.
In the forecasting element of LEMAP, the CREST model was used to generate temporal energy profiles of
dwellings that were suitable for deploying LCTs at a postcode level to maintain data privacy. The CREST input
parameters were filled in relation to the proportion of dwellings that shared common attributes at postcode level,
including building type (built form) and insulation quality.
The 'PV systems' configuration was set to 100% of dwellings with a system of 12 panels with an area of 19.2 m 2
(1.6 m per panel), system efficiency of 0.15 ηpv, slope of 40° (CREST default) and south-oriented. For heat
2
pumps, electricity load profile (winter weekday) was extracted from Love et al. (2017) for net electricity demand
assuming take-up of 75% of air source heat pumps (ASHPs) and 25% of ground source heat pumps (GSHPs) at
postcode level.
For electric vehicle (EV) chargers, a standard load was added to the electricity demand. It was assumed that EVs
travel 32 km per day, consuming 0.20 kWh per km, resulting in a daily energy demand of 6.4 kWh/day. Charging
times were set to a night schedule (12 am-5am) corresponding to low rates in a time of use tariff plans (Octopus
flexible tariff). Home batteries were assumed to have a capacity of 5 kWh and charged with surplus solar electricity
during the day. Discharge from the batteries was set at 5 pm in the peak evening period.
For participatory mapping, 54 archetypal energy profiles were generated using building attributes to represent the
case study neighbourhood. Each archetype consisted of an average of 25 simulations, which proved to have a
difference with metered data of less than 1.2% by Richardson et al. (2010). Based on the inputs in the online
survey, sensitivity analysis of local input parameters was undertaken to reduce uncertainty assessment associated
with the energy profiles generated by the stochastic modelling of CREST (Pianosi et al., 2016). Based on
sensitivity analysis, data for attributes such as the number of residents, building type and appliances were gathered
for each archetype, while attributes such as user occupancy and weather conditions were left to stochastic
modelling.
Case study application and trial
The working of LEMAP tool was demonstrated by applying it to a socially-disadvantaged neighbourhood (Rose
Hill), located in the south-west of Oxford city. The neighbourhood was selected since it was part of the smart and
fair neighbourhoods (SFNs) initiative and had an active community group that aspired to achieve a zero-carbon
estate. The neighbourhood was also part of a previous ERIC research project which involved a domestic trial of
smart home batteries and rooftop solar (Gupta & Bruce-Konuah, 2017a; Gupta & Bruce-Konuah, 2017b), thereby
making it data-rich.
Following the application of LEMAP to Rose Hill area, a trial of LEMAP was conducted with six project managers
of a community interest company who were responsible for planning SFNs as part of Project LEO, one of the
Government-funded SLES demonstrators. Henceforth, this group of users are called SFN project managers. The
trial was run for SFN project managers through three sessions to avoid information overload.
Overview session (19 January 2021) - provided rationale and introduction to the tool.
Overview session (3 February 2021) - details about the capabilities of the tool.
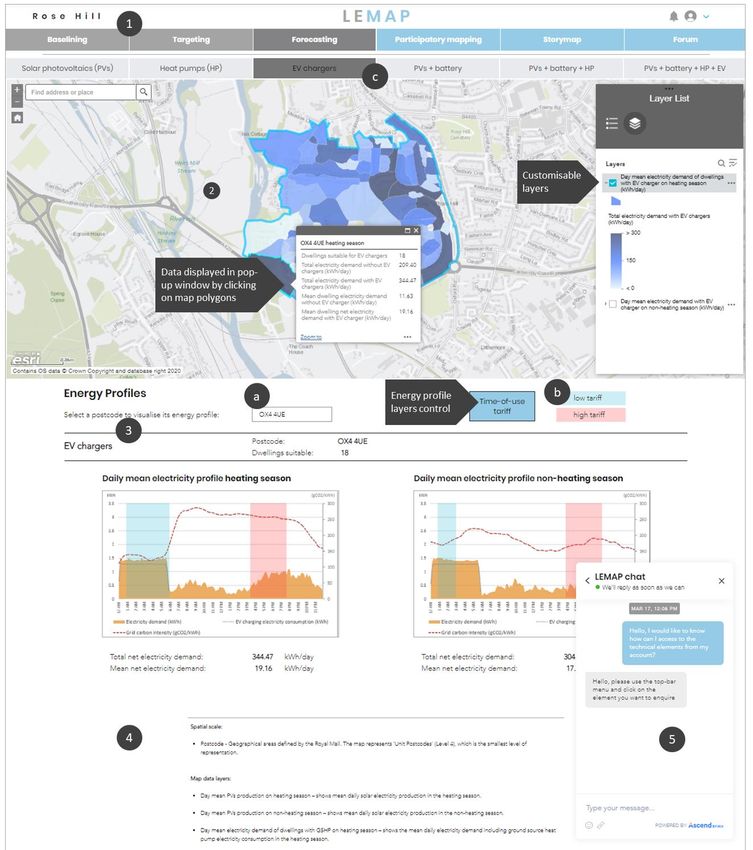
Training session (10 February 2021) - provided live demo, user guide and trialling the tool.Results Overview of LEMAP The spatial-temporal mapping approach of LEMAP brought together over 20 discrete datasets comprising contextual maps, building attributes, socio-demographics, electricity networks, energy demand, energy resources, energy profiles and blog stories for the Rose Hill area in Oxford as a case study. As shown in Figure 2, the user interface of LEMAP was designed to be navigated through (1) an interactive bar with buttons at the top for filtering content (2) map window extended to the length of the display screen (3) energy profile display and interactive buttons (4) description of the map layers, data sources and notes about the LEMAP element (5) chat box located at the bottom right of each page. The energy profiling aspect of LEMAP consisted of (a) filter profiles by dwelling or postcode (b) benchmarking profiles against grid carbon intensity, national average and time-of-use tariff (c) profiles for individual and grouped LCT scenarios (Figure 2). Figure 2. Forecasting element with EV scenario enabled; energy profile filtered to 'OX4 4UE' postcode with 'time-of-use tariff indicator turned on; and chat window opened.
The online interface of LEMAP was designed using 'Editor X' web builder platform, where registered users could
access the different elements and create storymap entries. While community interest companies and local
authorities could access the three technical (baselining, targeting, forecasting) and three engagement elements
(participatory mapping, storymap, forum) for planning smart local energy initiatives. Community groups and
residents’ (householders) access was restricted to the three engagement elements.

Technical elements
The baselining element in LEMAP consisted of mostly publicly available maps of local area energy flows with
socio-economic and dwelling characteristics combined with subnational annual electricity and gas consumption
and EPCs at Lower Layer Super Output Area (LSOA) level comprising 400-1,200 households as well as postcode
and property levels. The spatial data layers was organised in three baselining tabs – context, energy demand and
energy resources. Each of the tabs had multiple data layers at different spatial scales with the ability to filter by
data attributes. This is shown in Table 2 below.

Table 2. Details of baselining element – data layers, spatial scale and filters
 Map            Data layers                       Spatial scale    Filters and count

 Context        - Primary substations location    - Site           - none
                - Postcode border                 - Postcode       - none
                - Building type and use           - Property       - count number of dwellings and room average
                - Fuel poverty                    - LSOA           - number and percentage of dwellings in fuel poverty
                - Homeownership                   - LSOA           - ownership and rents percentage
                - Unemployment rate               - LSOA           - unemployment, retirement, student and self-
                                                                   employed rates

 Energy         - EPC properties                  - Property       - EPC rating and building attributes (age, form, type,
 demand         - Postcode border                 - Postcode       walls and heating system energy efficiency)
                - Building type and use           - Property       - none - none
                - Electricity and gas             - LSOA and       - number of meters per area and mean and total
                consumption                       postcode         consumption

 Energy         - Primary substations location    - Site           - none
 resources      - Dwellings with PV and           - Dwelling       - number and orientation of panels, system size, roof
                dwellings with batteries                           type, battery status, car ownership; and count
                - EV public chargers              - Site           - none
                - EV domestic chargers            - Postcode       - none

The purpose of the targeting element was to identify dwellings that were suitable for deploying different low
carbon technologies (LCTs) at a property and postcode level. Six LCT scenarios were created, ranging from solar
photovoltaics (PVs), Heat pumps, EV chargers, PVs + batteries, PVs + batteries + heat pumps, and PVs + batteries
+ heat pumps + EV chargers. Publicly and privately available datasets were superimposed based on common
parameters such as address or UPR and filters were applied for each LCT scenario to generate corresponding maps
to help LEMAP users target suitable areas and dwellings for take-up of LCTs.

Table 3. Data layers and assumptions behind LCTs scenarios
 LCT scenario            Data layers                                   Assumptions*

 Solar photovoltaics     - Dwellings suitable for PVs                  - Roof not thatch; EPC greater than 54
 (PVs)                   - Dwellings need to improve EPC for PVs       - Roof not thatch
                         - Estimated annual average solar irradiance   - Energeo parameter

 Heat pumps (HP)         - Suitable for GSHP                           - Not mid-terrace, insulated dwellings, double
                         - Greenspace areas                            glazing, premise area greater than 25 m2,
                                                                       bedroom count greater than 2
                         - Priority GSHP                               - Suitable for GSHP, basement or main fuel
                         - Suitability for ASHP                        electricity
                         - Priority ASHP                               - Insulated dwellings, double glazing
                                                                       - Suitable for ASHP, main fuel electricity

 EV chargers             - Suitable for EV charger                     - Suitable for PVs and batteries, off-street parking
PVs + batteries - Suitable for PV and battery - Suitable for PV
- Priority battery - Suitable for PV and have basement
PVs + batteries + heat - Suitable for battery and GSHP - Suitable for GSHP, suitable for PVs and
pumps - Suitable for battery and ASHP batteries
- Green space areas - Suitable for ASHP, suitable for PVs and
batteries
PVs + batteries + heat - Dwellings suitable for battery, heat pump - Suitable for GSHP or ASHP, suitable for PVs
pumps + EV chargers (any) and EV charger (time-of-use tariff) and batteries, suitable for EV charger
* General assumptions: only dwelling used for residential purposes were analysed; rented (private and social) properties will not install
LCTs; listed buildings are not suitable for LCTs; flats are not suitable for LCTs; all roofs have a suitable orientation for a solar panel.
The Forecasting element presented maps and energy profiles of mean daily electricity consumption demand for
each of the six LCT scenarios at the postcode level. The maps and energy profiles were generated from CREST
calculations and filtered by postcode and LCT scenarios. For the first time, users could see how daily energy
profiles would vary with the deployment of different types of LCTs, singularly and in combination, and how time-
of-use-tariffs would affect the operational timing of these technologies.
Engagement elements
A key aspect of the engagement side of LEMAP was the participatory mapping element that allowed residents in
the case study neighbourhood to provide data about their dwelling using an online survey and obtain mean daily
energy profiles based on their survey inputs, as well as visualise their dwelling’s annual energy consumption on a
map. Using the principle of crowd-sourcing, accurate and latest data about the physical and household
characteristics was gathered from residents through an online survey. The data provided was used for selecting the
appropriate energy profile (archetype) to help residents understand benchmark electricity and gas consumption
against national averages and see how their energy profile changed with the deployment of LCTs and TOU tariff
(Figure 3).
Figure 3. Participatory mapping survey (left) and participatory mapping interface showing results mapped and corresponding
energy profile archetype and national benchmarking (right).
The mean daily energy profiles showed hourly energy demand in colour tagged bars since it is easier for residents
to read and relate it to their daily schedule (Valor et al., 2019; Escudero et al., 2020). In the 'benchmarking' mode,
energy profiles were overlapped with grid carbon intensity, typical energy demand profile and TOU tariff'(Octopus flexible tariff). For the case study area, about 54 archetypal profiles were generated to fit all possible
user input combinations based on their survey answers, as specified in Table 4.
Table 4. Variables characterising archetypal profiles in participatory mapping
CREST parameters CREST Archetype input Survey answer
Number of residents - 1.5 - '1 or 2'
(3 variables) - 3.5 - '3 or 4'
-5 - '5 or more'
Building- dwelling - improved detached - ‘detached’ + insulation*
type - detached - ‘detached’ + no insulation**
(6 variables) - improved semi-detached - ‘semi-detached’ + insulation*
- semi-detached - ‘semi-detached’ + no insulation**
- improved terraced - ‘terraced’ + insulation*
- terraced - ‘terraced’ + no insulation**
Appliance - no: chest/upright freezer, TV2, dishwasher, tumble - low - '1 or none'
configuration dryer, washer-dryer; 0.2 electric shower
(3 variable - default - medium - 'between 2 and 4'
configurations) - yes: chest/upright freezer, TV2, dishwasher; 0.5 - high - '5 or more'
tumble dryer, 0.5 washer-dryer
*answered 'yes' to all insulation and double-glazing questions; **answered 'no' to any insulation or double-glazing questions.
The Storymap element consisted of a blogging platform in which users such as SFN project managers could
visually summarise the key findings from applying LEMAP to a local area. The story map consisted of linked
spatial maps, text, images, videos and links to external references. The story map could serve as a visual platform
for those planning local energy initiatives to communicate information derived from the technical elements with
the residents of the local area. This could help to bring inclusiveness and transparency of information flow, which
was found to be lacking in the review of tools undertaken.
The forum element was designed to be non-mapping in nature and was included primarily to stimulate
communication between LEMAP administrators and users, project delivery teams and residents, as well as
amongst residents of the local area. It included a forum functionality and chat platform open to the users who could
contribute through entries, likes and comments. The forum and chat could also be used for sharing feedback about
the tool - the different ways in which LEMAP was used, any pitfalls encountered, and insights developed.
LEMAP trial: user feedback and refinement
Three sessions were run with the SFN project managers of a community interest company who were responsible
for planning smart local energy (SLE) initiatives in different neighbourhoods in Oxfordshire as part of Project
LEO. Alongside demonstration of the tool in the sessions, a visual user guide was shared to provide step-by-step
guidance into using LEMAP. Following the training and trial sessions, an online survey was completed by the
SFN project managers. This was followed by an open discussion between the authors and SFN project managers
to provide feedback about the functionality and usefulness of the tool. The key findings of the feedback were as
follows:
SFN project managers were highly receptive to the tool's usefulness. The majority of them (n: 83%)
agreed or strongly agreed that LEMAP would help in the planning and delivery of the smart and fair
neighbourhoods.
The majority of the project managers (n: 67%) found LEMAP easy to understand and navigate.
All six project managers valued the transparency of the tool in terms of the details about the underpinning
data layers and their sources along with the filters used to select suitable areas and dwellings for the
deployment of LCTs.
The organisation of LEMAP in terms of the six constituent elements (baselining, targeting, forecasting,
participatory mapping, storymap and forum) was found to be logical by 83% of the project managers. The targeting, forecasting, and participatory mapping functions were found to be the most useful planning
of SFNs.
The overall majority of the managers (n: 83%) found the LEMAP approach innovative in providing
spatial intelligence about local areas.
The SFN project managers proposed the following changes to the functionality of the tool. These were grouped
as:
Immediate changes - minor improvements addressing debugging issues, such as use of terminology and
size of display screen.
Structural changes - addition of spatial data layers such as information about socio-demographics of the
local area.
Future changes - addition of third-party data by users and roll-out of the tool at the county level.
Subsequently, an updated version of LEMAP (version 2.0) was created based on the feedback received from the
trial with SFN project managers. The debugging issues were addressed. Special attention was paid to improve user
experience; maps were set to be responsive to screen size, and the user interface was further simplified. Baselining
element was enriched with time-series data related to historical trends in gas and electricity consumption at LSOA
level. Additional private databases were added, such as consumer classification database for showing socio-
economic characteristics of the local area to help project teams design customised smart energy offers for residents.
Discussion
Overall, the spatial-temporal mapping approach of LEMAP was found to be innovative and useful for extracting
local intelligence rapidly and accurately. The tool allowed users to systematically move from baselining to
targeting and then forecasting while also enhancing community engagement through participatory mapping. The
trial feedback showed that SFN managers considered these functionalities of LEMAP vital for the planning of
smart local energy initiatives. The modular nature of the tool in terms of the six underpinning elements brought
flexibility and adaptability to the tool in terms of what elements to customise for which neighbourhood, based on
the low carbon aspirations of the area and the scope of the planned SLE initiative.
Visualisation of spatial and temporal aspects of local energy, as well as the balance between technical and
engagement aspects, was a novel feature of the LEMAP tool. The literature review showed that these capabilities
were not present in any tool to date. For example, the display of energy profiles in conjunction with carbon
intensity and TOU electricity tariffs can help to stimulate action amongst resident to shift the timing of energy
demand away from off-peak hours (grid balancing), whether for saving money, carbon or generating a positive
environmental impact.
LEMAP brought together disparate sources of data from public and private sources at the dwelling level, which
required sensitivity in handling data to maintain data privacy. This is why ethical arrangements were put in place
in terms of seeking permissions and informed consent from residents before any data provided by them through
online surveys was visualised. This is why LEMAP was designed to aggregate data at different spatial resolutions
such as postcode and LSOA. Aggregation of data at these spatial scales was considered acceptable by most SFN
project managers, although a few suggested having more detailed granularity, raising the questions of, what spatial
scale works for whom? And, how to provide high-resolution data without affecting data privacy? Also, given the
variety of data layers underpinning LEMAP, to maintain data quality, the tool was designed to provide the data
source and year of data collection for each data layer to highlight any mismatch in dates for different datasets.
The crowd-sourcing of data through residents was found to increase the accuracy of the tool with more local data.
It was also realised that local interpretation and validation of the nationally gathered data (public and private) was
necessary to identify errors and give confidence to local communities. Therefore, community engagement was
seen to be vital for the tool's success since it helped to improve the accuracy and richness of the data. The citizen
science-based participatory mapping approach could also provide the means to engage with local residents through
the means of a map. The storymap and forum elements would also enhance communication between the users of
the tool and the wider community. Despite these strengths and benefits, since LEMAP was designed as an online
tool, it could ignore the residents that were not internet savvy, raising the question of how to include users who
are not or cannot be digitally active? For the inclusion of such users, the capability to rapidly create traditional
reports from the LEMAP analysis of neighbourhoods may need to be considered.Conclusion
Geospatial mapping tools have the capability to provide spatial intelligence and engage local communities if they
moved beyond a one-way flow of representing local energy flows to two-way interaction with local communities.
This paper has described the development and trial of an online and interactive spatial-temporal community
engagement tool called LEMAP for planning smart local energy neighbourhoods in Oxfordshire (UK). The review
of existing local energy mapping tools and approaches confirmed the absence of such tools in the local energy
sector. LEMAP was designed to engage with community groups, community interest companies, local authorities
and residents. It was applied to Rose Hill, a socially-deprived but data-rich neighbourhood in Oxford.
The tool brought together public, private and crowd-sourced data on energy demand, energy resources, building
attributes, socio-demographics, fuel poverty and electricity networks within the ESRI ArcGIS platform. Postcode
and dwelling level energy demand profiles were generated using the CREST energy demand model. The tool was
organised around three technical and three engagement elements that include baselining, targeting, forecasting,
Participatory mapping, Storymap and Forum. Project managers in a community enterprise organisation in
Oxfordshire were trained online to use LEMAP to plan for energy management at the neighbourhood level.
Participatory mapping was found to enrich the tool and engage communities to provide local data through online
surveys and highlight any discrepancies in the public and private data through local data interpretation.
The trial and feedback from the user group emphasised the need for LEMAP to be scaled up to the county level
and rolled out to other communities for planning and delivering SLE initiatives. In future, LEMAP will be
deployed in a variety of SFN neighbourhoods that aim to install low carbon heating with TOU Tariffs, EV chargers,
and rooftop solar with batteries. Using a capability lens approach developed by the Centre for Sustainable Energy
(Roberts et al., 2020), households based on their socioeconomic characteristics will be identified in terms of who
are likely to adopt different LCTs and those who could be left behind. The tool could also help District Network
Operators (DNOs) to overlay network constrained areas with areas that have the potential for deploying distributed
energy resources to support local grid balancing.
References
Amado, M., Poggi, F., Ribeiro Amado, A. and Breu, S., 2018. E-city web platform: A tool for energy
efficiency at urban level. Energies, 11(7), p.1857.
Aunedi, M., and Green, T., 2020. Early insights into system impacts of Smart Local Energy Systems.
EnergyREV project, May 2020.
Department for Business, Energy and Industrial Strategy (BEIS), UK, 2018. Clean growth strategy: Leading
the way to a low carbon future. London: HM Government.
Buchanan, K., Staddon, S., van der Horst, D., 2018. Feedback in energy-demand reduction, Building
Research & Information, BRI, 46:3, 231-237
Camporeale, P.E. and Mercader-Moyano, P., 2021. A GIS-based methodology to increase energy flexibility
in building clusters through deep renovation: A neighborhood in Seville. Energy and Buildings, 231, p.110573.
Castellanos, S., Sunter, D.A. and Kammen, D.M., 2017. Rooftop solar photovoltaic potential in cities: how
scalable are assessment approaches?. Environmental Research Letters, 12(12), p.125005.
Chiang, T., Natarajan, S. and Walker, I., 2012. A laboratory test of the efficacy of energy display interface
design. Energy and Buildings, 55, pp.471-480.
D’Oca, S., Corgnati, S.P. and Buso, T., 2014. Smart meters and energy savings in Italy: Determining the
effectiveness of persuasive communication in dwellings. Energy Research & Social Science, 3, pp.131-142.
Department of Energy & Climate Change (DECC) UK, 2014. Community Energy Strategy: Full Report;
London: DECC HM government.
Department of Energy and Climate Change (DECC) UK, 2011. The carbon plan: Delivering our low carbon
future. London: DECC HM government.
Escudero Guirado, C., Labajo,V., Valor, C., Bögel, P., Giersiepen, A., Koronen, C., Mäkivierikko, A.,
Nilsson, A., Shahrokni, H., 2020. InteGrid. Demonstration of smart grid, storage and system integration
technologies with increasing share of renewables: distribution system. D1.4 Consumer’s Engagement Strategies.
European Commission, Horizon 2020.
Flacke, J. and De Boer, C., 2017. An interactive planning support tool for addressing social acceptance of
renewable energy projects in the Netherlands. ISPRS international journal of geo-information, 6(10), p.313.
Fonseca, J.A., Schlueter, A., 2015. Integrated model for characterisation of spatiotemporal building energy
consumption patterns in neighborhoods and city districts. Applied Energy, 142, pp.247-265.
Ford, R., Maidment, C., Vigurs, C., Fell, M.J. and Morris, M., 2019. Smart Local Energy Systems (SLES):
A conceptual review and exploration.
Gummer, J., King J., Bell, K., Chater, N., Foster, P., Heaton, R., Johnson, P., and Le Quere, C., 2020a. The
Sixth Carbon Budget: The UK's path to Net Zero, Committee on Climate Change (CCC), December 2020.Gummer, J., King J., Bell, K., Chater, N., Foster, P., Heaton, R., Johnson, P., and Le Quere, C., 2020b.
Reducing UK emissions: Progress Report to Parliament, Committee on Climate Change (CCC), June 2020.
Gupta, R. and Bruce-Konuah, A., 2017a. Evaluating the integration of solar photovoltaic and smart battery
storage systems across a cluster of dwellings in a socially-disadvantaged community. Proceedings of BEHAVE
Conference, Portugal, September 2017.
Gupta, R. and Bruce-Konuah, A., 2017b. Using smart energy storage to increase self-consumption of solar-
generated electricity and reduce peak grid load at household and community level. Proceedings of ECEEE
Conference, France, May 2017.
Gupta, R. and Zahiri, S., 2020a. July. Evaluation of user engagement in smart local energy system projects
in the UK. Energy Evaluation. Accelerating the energy transition for all: Evaluation’s role in effective policy.
London.
Gupta, R. and Zahiri, S., 2020b. November. Meta-study of smart and local energy system demonstrators in
the UK: technologies, leadership and user engagement. In IOP Conference Series: Earth and Environmental
Science (Vol. 588, No. 2, p. 022049). IOP Publishing.
Hampton, S., Fawcett, T., 2020. Can energy projects be over evaluated?, Energy evaluation Europe. July
2020f
Love, J., Smith, A.Z., Watson, S., Oikonomou, E., Summerfield, A., Gleeson, C., Biddulph, P., Chiu, L.F.,
Wingfield, J., Martin, C. and Stone, A., 2017. The addition of heat pump electricity load profiles to GB electricity
demand: Evidence from a heat pump field trial. Applied Energy, 204, pp.332-342.
McKenna, E. and Thomson, M., 2016. High-resolution stochastic integrated thermal–electrical domestic
demand model. Applied Energy, 165, pp.445-461.
Morstyn, T., Farrell, N., Darby, S.J. and McCulloch, M.D., 2018. Using peer-to-peer energy-trading
platforms to incentivise prosumers to form federated power plants. Nature Energy, 3(2), pp.94-101.
Owens, S., Driffill, L., 2008. How to change attitudes and behaviours in context of energy, Energy Policy
36, 4412-4418
Pianosi F., Beven, K., Freer, J., Hall J., Rougier, J., Stephenson, D., Wagener, T., 2016. Sensitivity analysis
of environmental models: A systematic review with practical workflow. Environmental Modelling and Software,
79, pp. 214-232.
Pimm, A.J., Cockerill, T.T. and Taylor, P.G., 2018. The potential for peak shaving on low voltage distribution
networks using electricity storage. Journal of Energy Storage, 16, pp.231-242.
Regen 2021 Environmental Audit Committee call for evidence: Community Energy; Written evidence
submitted by Regen (19 March 2021)
Richardson, I., Thomson, M., Infield, D. and Clifford, C., 2010. Domestic electricity use: A high-resolution
energy demand model. Energy and buildings, 42(10), pp.1878-1887.
Roberts, S., Bridgeman, T., Broman, D., Hodges, N., Sage, C., 2020. smart and fair? Exploring social justice
in the future energy system, Centre for sustainable energy (CSE) 2020.
UK Research and Innovation (UKRI), 2019. Unlocking the potential of intelligent local energy systems for
the UK. Prospering from the energy revolution. May 2019.
Valor, C., Escudero, C., Labajo, V. and Cossent, R., 2019. Effective design of domestic energy efficiency
displays: A proposed architecture based on empirical evidence. Renewable and Sustainable Energy Reviews, 114,
p.109301.
Wate, P. and Coors, V., 2015. 3D data models for urban energy simulation. Energy Procedia, 78, pp.3372-
3377.
Acknowledgement
The study is financially supported by the EPSRC funded EnergyREV Plus project on User influence tools
(EP/S03188X/1), EnergyRev-Core project (EP/S031723/1) and Innovate UK funded Project LEO (Project ref:
104781). We are grateful to the Low Carbon Hub for their feedback in trialling the LEMAP tool.You can also read