Electricity and renewable gas energy system alternatives for fossil fuel substitution in British Columbia
←
→
Page content transcription
If your browser does not render page correctly, please read the page content below
Electricity and renewable gas energy system
   alternatives for fossil fuel substitution in British
                       Columbia

                          A report to the Energy Modelling Initiative

Prepared by

Kevin Palmer-Wilson, Andrew Rowe, Peter Wild

Corresponding author: kevinpw@uvic.ca

Institute for Integrated Energy Systems
Department of Mechanical Engineering
University of Victoria
3800 Finnerty Road
Victoria BC V8W 2Y2
Canada

                                                                        19 March 2021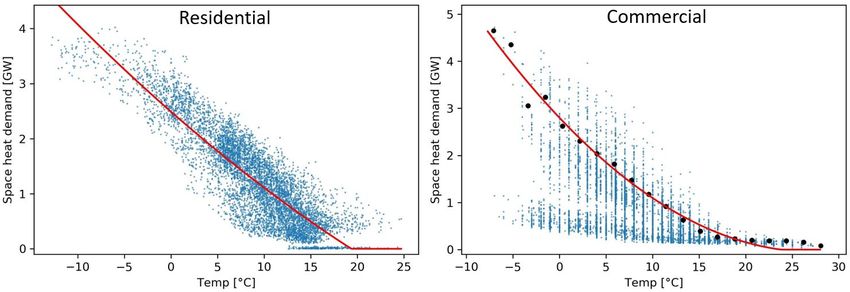
Abstract (English)
This report documents model development and data availability to investigate emission
reductions in the residential and commercial space and water heating sectors of Metro
Vancouver, British Columbia. Two transition pathways quantify electricity and gas system
requirements to eliminate natural gas combustion. In these pathways, a one-year hourly capacity
expansion and dispatch model substitutes natural gas with either renewable electricity, or biogas
and electrolytic hydrogen. Historic secondary energy demand and heating system efficiency data
inform on the effects of heating technology improvements. Cost-minimization reveals optimal
electricity generation, gas production, and storage capacities able to supply energy demands.
Results show both pathways to reduce emissions by ~ 80%, but capacity requirements are
sensitive to ambient temperature profiles, and available biogas resources. Electrification is 52%
lower cost than renewable gas transition when heat demand is low; renewable gas transition is
35% lower cost when biogas availability includes wood gasification.

   Résumé (Français)
Ce rapport documente l'élaboration de modèles et la disponibilité des données pour étudier
d'émissions dans les secteurs résidentiels et commerciaux et du chauffage de l'eau de la région
métropolitaine de Vancouver, en Colombie-Britannique. Deux voies de transition quantifient les
exigences des systèmes d'électricité et de gaz pour éliminer la combustion du gaz naturel. Dans
ces voies, un modèle d'expansion et de répartition de la capacité horaire sur un an remplace le
gaz naturel par de l'électricité renouvelable ou du biogaz et de l'hydrogène électrolytique. Les
données historiques sur la demande d'énergie secondaire et l'efficacité du système de chauffage
informent sur les effets des améliorations de la technologie de chauffage. La minimisation des
coûts révèle des capacités optimales de production d'électricité, de production de gaz et de
stockage capables de répondre à la demande énergétique. Les résultats montrent que les deux
voies permettent de réduire les émissions d'environ 80%, mais les exigences de capacité sont
sensibles aux profils de température ambiante et aux ressources de biogaz disponibles.
L'électrification coûte 52% moins cher que la transition au gaz renouvelable lorsque la demande

                                               2
de chaleur est faible; la transition au gaz renouvelable est 35% moins coûteuse lorsque la
disponibilité du biogaz comprend la gazéification du bois.

Contents
Abstract (English) ............................................................................................................................ 2

Résumé (Français) ........................................................................................................................... 2

List of tables .................................................................................................................................... 5

List of figures ................................................................................................................................... 5

List of symbols and abbreviations .................................................................................................. 7

1.     Introduction ............................................................................................................................. 8

2.     Data availability ....................................................................................................................... 9

     2.1.     Electricity demand and generation capacity.................................................................... 9

     2.2.     Space and water heat demand data .............................................................................. 11

3.     Methods................................................................................................................................. 12

     3.1.     Energy system model ..................................................................................................... 13

     3.2.     Model modifications ...................................................................................................... 14

     3.3.     Energy demands ............................................................................................................. 15

     3.4.     Space heat demand under low temperature conditions ............................................... 16

     3.5.     Energy production .......................................................................................................... 17

     3.6.     Energy storage................................................................................................................ 19

     3.7.     Scenarios ........................................................................................................................ 19

4.     Results.................................................................................................................................... 20

     4.1.     Greenhouse gas emissions ............................................................................................. 20

     4.1.     Electricity generation and storage capacity ................................................................... 21

     4.2.     Pathway costs................................................................................................................. 23

                                                                         3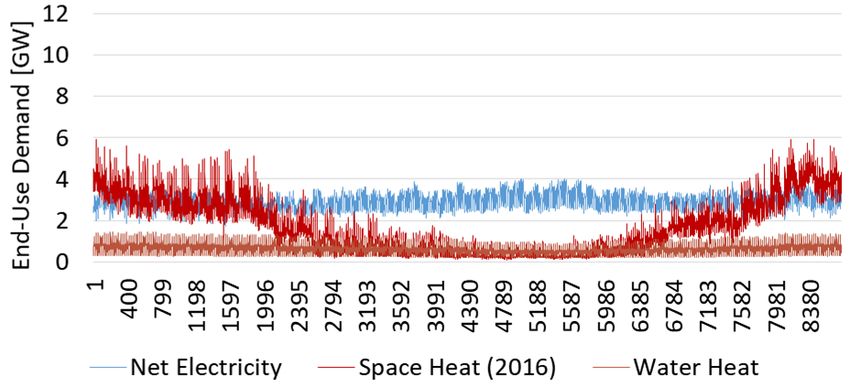
5.     Discussion .............................................................................................................................. 23

     5.1.    Policy implications .......................................................................................................... 23

     5.2.    The Open Source Energy System Model OSeMOSYS ..................................................... 24

     5.1.    Model and data availability ............................................................................................ 25

     5.2.    Model usability for policy design ................................................................................... 26

     5.3.    Future work .................................................................................................................... 27

     5.4.    Data availability constraints ........................................................................................... 28

6.     Conclusion ............................................................................................................................. 28

7.     References ............................................................................................................................. 30

                                                                        4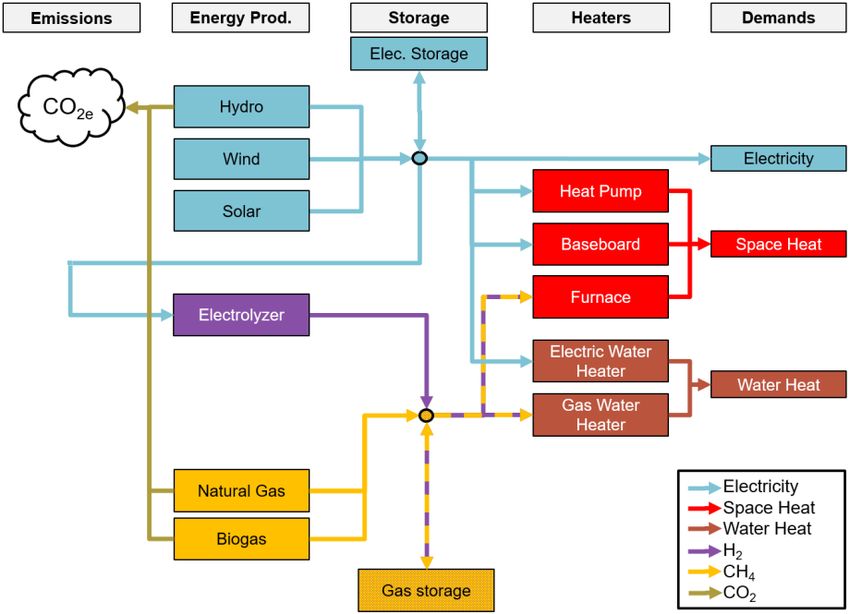
List of tables
Table 1. Three scenarios determine low-carbon energy system costs and capacity
requirements for a range of future energy demand, and renewable energy resource potentials.
....................................................................................................................................................... 20
List of figures
Figure 1. Comparison of electric load, cross-border trade, and load-carrying capability in
British Columbia highlights the capacity constraint in winter peak-demand periods. The red
straight line shows BC Hydro’s 2018 Effective Load Carrying Capability of 11,315 MW (BC Hydro,
2016, Ch. 3, Table 3-9). The green line shows all-time peak load between 2007 and 2018 as
recorded by the Balancing Authority’s “Telemetred Load” (BC Balancing Authority, 2021).
Boxplots of telemetered load in yellow and electricity net import/export in blue (BC Hydro, 2021)
show the variability of weekly means between 2007 and 2018. Imports/exports show the sum of
flows across BC-US and BC-AB tie lines. ....................................................................................... 11
Figure 2. Energy system model used to investigate electrification and renewable gas
pathways for Metro Vancouver. In the electrification pathway furnaces and gas water heaters
are replaced by electric heat pumps and electric water heaters. In the renewable gas pathway,
natural gas is replaced by biogas and electrolyzed hydrogen. ..................................................... 14
Figure 3. Estimated hourly end-use energy demands for Metro Vancouver are the product
of annual secondary energy demand records, heater efficiencies, and normalized hourly demand
profiles. ......................................................................................................................................... 15
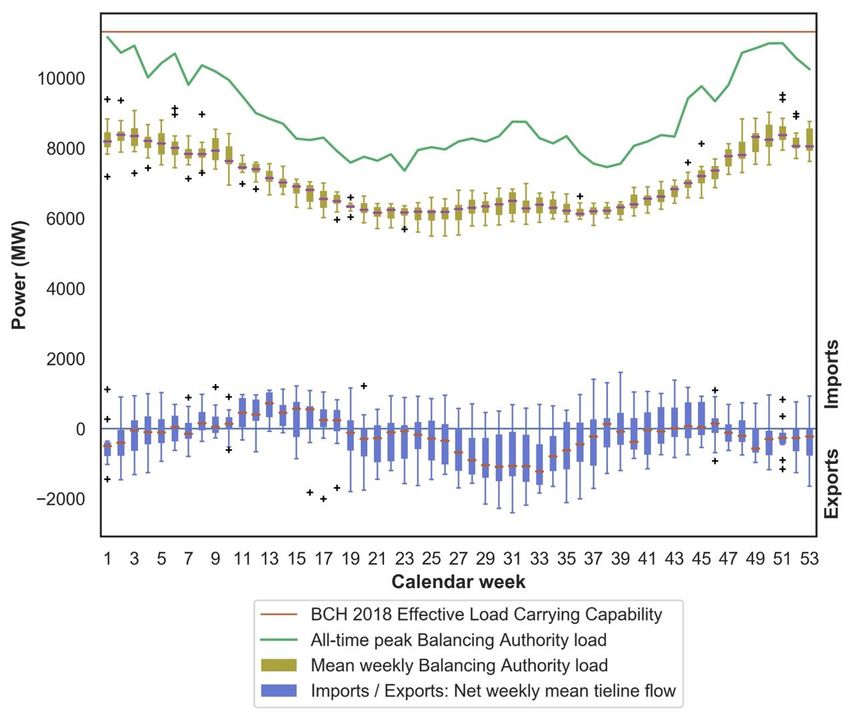
Figure 4. End-use space heat demand versus temperature in the residential and
commercial sectors. The red curve shows the second-degree polynomial equation of best fit. The
residential equation is fitted directly onto the temperature data and results in a Coefficient of
Determination R² = 0.84. The commercial equation is fitted onto the 90 th percentiles (black dots
in right graph) of 20 temperature bins of equal width to better capture peak space heat demand
during low temperature events. ................................................................................................... 17
5Figure 5. Estimated monthly minimum capacity factors define the profile shape of ~ 41
TWh generated by British Columbia’s hydroelectric power stations on a pre-determined schedule
(BC Hydro, 2017). Generation peaks in June and July when snowmelt-freshet inflows dominate.
....................................................................................................................................................... 18
Figure 6. Reference scenario greenhouse gas emissions from electricity generation and
gas combustion in Metro Vancouver's building heating sector. Horizontal axes show natural gas
substitution rates ranging from 0% to 100% in 10% increments. Whiskers denote emissions
observed across all scenarios in the electrification pathway (Elec) on the left, and in the
renewable gas pathway (RNG) on the right. ................................................................................ 21
Figure 7. Reference scenario energy system transition in the electrification (Elec) and
renewable gas (RNG) pathways. Horizontal axes show natural gas substitution rates ranging from
0% to 100%. The top row shows electricity generation and potential surplus for the one-year
modelling period. The center row shows installed electric power generation capacities. The
bottom row shows electric energy storage capacity on the left, and gas storage energy capacity
on the right. Gas storage capacity reaches ~ 1000 GWh; the axis range highlights the electric
energy storage capacity because gas storage is effectively unconstrained in British Columbia.
Error bars show minimum and maximum energy storage capacities observed across all scenarios.
....................................................................................................................................................... 22
Figure 8. Percentage cost difference between electrification and renewable gas pathways
at 100% natural gas substitution across all scenarios. ................................................................. 23
6List of symbols and abbreviations
AB Alberta
BA British Columbia Balancing Authority
BC British Columbia
Elec Electrification pathway
GW Giga Watt
OSeMOSYS Open Source Energy System Model
PJ Peta Joule
RNG Renewable gas pathway
TWh Terra Watt Hours
US United States of America
71. Introduction
Mitigating climate change and limiting global warming to below 2 °C by 2100 will require reducing
global greenhouse gas emissions to net-zero by mid-century. The Canadian province of British
Columbia (BC) has committed to reducing its annual emissions from 2007-levels by at least 80%
by 2050. Achieving these targets necessitates the elimination of fossil fuel combustion as an
energy source.
Replacing fossil fuels with low-carbon electricity has been identified as among the lowest-cost
strategies to mitigating climate change (Trottier Energy Futures Project, 2016). BC generates 98%
of its electricity from renewable sources; hydro power contributes the largest share at 91%,
biomass and wind provide another 6% and 1%, respectively (Canada Energy Regulator, 2021).
This low-carbon electricity offers immediate emission reduction potential via electrification, but
the available energy and power generation capacity cannot replace the vast quantity of fossil fuel
consumed in all other sectors. Operating constraints limit the share of flexibly dispatchable
hydroelectric energy to about one third of annual supply. Constraints include minimum water
discharge rates, flood control, and the large snowmelt-driven water inflows that occur in early
summer when electricity demand is low (BC Hydro, 2017a). Electrification of the heating sector
and transportation sectors would increase winter peak electricity demand beyond the province’s
load-carrying capability of approximately 13 GW and require additional dispatchable generation
capacity (Palmer-Wilson, 2020).
In the residential and commercial building sectors of British Columbia, natural gas provided 68%
of space and water heating in 2016 (Natural Resources Canada, 2020). Replacing natural gas with
biogas or electrolytic hydrogen offers an alternative to direct electrification and does not increase
winter-peak electricity demand. Power-to-gas technologies facilitate use of low-cost gas storage
capacity to indirectly store electricity from variable renewable sources, reducing electricity
storage requirements, retaining gas infrastructure to avoid stranded assets, and increasing
resilience to energy demand and supply variability.
This report describes the investigation of substituting natural gas in the building heating sector
of the Metro Vancouver Regional District in British Columbia, Canada. Two distinct transition
8pathways compare electrification and renewable gas alternatives. A combined electricity and gas
system model reveals system costs, emission reductions, and electricity and gas production and
storage capacity requirements. Along each transition pathway, three scenarios vary energy
demand and renewable energy resource availability to delineate probable upper and lower
energy system bounds for a range of potential futures. The description in this report discusses
available data and their limitations, the system model development and its accessibility, the
scenario assumptions and their impact on modelling results, and concludes with policy
implications and recommendations for future research. The following questions guide the
investigation:
1) What are the end-use energy demands for space heat, water heat and electricity in Metro
Vancouver, and what are their temporal profiles?
2) How much additional energy production and storage capacity must be installed to meet those
energy demands?
3) To what extent can fossil fuel substitution reduce Metro Vancouver’s heating sector
emissions?
4) What are the energy system costs of fossil fuel substitution?
2. Data availability
2.1. Electricity demand and generation capacity
British Columbia’s hydropower-dominated electricity system produces surplus energy and can,
potentially, accommodate some electrification of fossil fuel sectors. However, publicly available
electricity system data lacks clear delineation of system boundaries and data collection
procedures. This lack of documentation introduces uncertainty when comparing data across
different sources to estimate the electric energy and capacity available for fuel substitution.
Comparison of hourly electricity demand, cross-border trade, and load-carrying capability using
public data exemplifies this uncertainty. In its role as Balancing Authority (BA), BC Hydro controls
real-time electric load and generation on British Columbia’s integrated transmission system. In
9this role, BC Hydro publishes “telemetered load” (BC Balancing Authority, 2021). Due to lack of
documentation, it is unclear whether the data includes a) transmission losses, b) trade with
Washington and Alberta, and c) behind-the-fence prosumers such as Rio Tinto Alcan. In its role
as an electricity provider, BC Hydro supplies most, but not all electricity consumers connected to
the integrated transmission system. Figure 1 shows that the BA’s all-time peak hourly load
between 2007 and 2018 approached BC Hydro’s 2018 load carrying capability. That figure
suggests that British Columbia’s installed electricity generation capacity is constrained in peak
demand hours with little surplus to accommodate additional winter peak load resulting from
electrified heating. However, BA loads are likely not equivalent to loads “carried” exclusively by
BC Hydro in its electricity supplier role. British Columbia’s electricity system may be able to
accommodate a larger additional peak load than this analysis suggests.
Additionally, the uncertainty regarding electricity trade affects this analysis of available energy.
The annual sum of telemetered load differs from the sum of electricity generation published by
the Canada Energy Regulator (Canada Energy Regulator, 2021), and also differs from the sum of
electricity generation published by BC Hydro and Fortis BC, the two largest utilities in British
Columbia.
10Figure 1. Comparison of electric load, cross-border trade, and load-carrying capability in British Columbia highlights the
capacity constraint in winter peak-demand periods. The red straight line shows BC Hydro’s 2018 Effective Load
Carrying Capability of 11,315 MW (BC Hydro, 2016, Ch. 3, Table 3-9). The green line shows all-time peak load between
2007 and 2018 as recorded by the Balancing Authority’s “Telemetred Load” (BC Balancing Authority, 2021). Boxplots
of telemetered load in yellow and electricity net import/export in blue (BC Hydro, 2021) show the variability of weekly
means between 2007 and 2018. Imports/exports show the sum of flows across BC-US and BC-AB tie lines.
2.2. Space and water heat demand data
In British Columbia, the natural gas system delivers more energy and power to buildings than the
electricity system. Modelling the transition from fossil fuels to renewable energy sources requires
detailed energy demand and supply data. To investigate the impacts of fuel substitution on the
electrical system, fuel consumption data would ideally be available at high temporal and spatial
resolution, and distinguish between types of consumers. Unfortunately, high temporal resolution
natural gas consumption data is not available in British Columbia. Most natural gas consumed by
11residential, commercial, and institutional customers is metered for billing proposes in monthly
intervals. Only select industrial consumers are metred at higher frequencies.
Two sources provide fuel consumption data at annual resolution. First, the Comprehensive
Energy Use Database contains sector-specific data for each of Canada’s provinces and territories
(Natural Resources Canada, 2020). In this database, detailed historic records for residential,
commercial, industrial, agricultural, and transportation sectors span 2000 to 2018. Data includes
secondary energy consumption by fuel type and end-use, greenhouse gas emissions, and
technology efficiencies. Second, the Community and Emissions Data Inventory provides
municipal and utility-specific data for British Columbia between 2007 and 2017 (Ministry of
Environment and Climate Change Strategy, 2021). This inventory contains historic records that
distinguish between several fuel types and 1) residential and 2) commercial, and small and
medium industrial consumers.
The lack of high temporal resolution data, and the aggregation of commercial and industrial
consumers at the municipal level are barriers to investigating the electricity system’s ability to
accommodate electrification of natural gas consuming services. Estimating additional demand
during peak demand events is critical to quantifying necessary but high-cost expansion of
dispatchable and low-carbon generation capacity. To overcome the limited data availability, this
study derives residential hourly heat demand from proprietary electricity consumption records
provided by BC Hydro, and applies bottom-up building model data to derive hourly heat demand
for commercial consumers. Improving data availability for British Columbia would reduce the
uncertainty introduced by those estimation techniques.
3. Methods
The study presented in this report cost-optimizes a combined electricity and gas system model
of the Metro Vancouver Regional District in British Columbia, Canada. In two distinct pathways,
renewable gas or electricity substitute for natural gas that serves the Metro Vancouver
residential and commercial building sectors. Along each pathway, three scenarios capture a
range of energy demand and renewable energy resource availability. These scenarios delineate
12probable upper and lower bounds of overall system costs, emission reductions, and electricity
and gas production and storage capacity requirements.
Energy demands include space heat, water heat, and net electricity that excludes space and
water heating. To overcome limited data availability, annual end-use energy demands are
calculated from historic secondary energy consumption records. Next, hourly demands are
constructed by estimating normalized profiles and scaling these profiles to match annual
demands (Section 3.3). Residential profiles are derived from proprietary electricity consumption
data recorded at the household level. Commercial and institutional profiles are derived from
building models. Correlating temperature records and space heat demand produces a profile for
low-temperature conditions (Section 3.4). The resulting hourly data enables the investigation of
supplying demand with variable renewables like wind and solar power, and related storage
requirements.
3.1. Energy system model
This study applies the Open Source Energy System Model OSeMOSYS (Howells et al., 2011) to
optimize the energy system transition of Metro Vancouver. This linear programming framework
expands and dispatches energy production and storage capacities to supply energy demands
while minimizing total annualized costs (Figure 2). The model determines the necessary
capacities for natural gas substitution rates from 0 to 100% for a one-year period with hourly
resolution. To limit the computational complexity of hourly time steps, the substitution occurs
“overnight” at the beginning of the modelling period. No long-term evolution occurs because the
model separately optimizes the energy system for each substitution rate. In the electrification
pathway, air-source heat pumps and electric resistance water heaters exogenously replace
natural gas-consuming space and water heaters. In the renewable gas pathway, biogas and
hydrogen replace natural gas via exogenously mandated renewable gas consumption shares.
Iterating over the same one-year model period with varying electrification and renewable gas
shares reveals energy system expansion trends.
13Energy demands include water heat, space heat, and net electricity that serves non-heating
loads. Air-source heat pumps and baseboard resistance heaters consume electricity, and
furnaces consume gas to provide space heat. Electric and gas water heaters provide hot water.
The model uses existing hydro electricity and natural gas production to supply demands at the
zero substitution rate. As necessary to meet demand at higher substitution rates, the model can
choose to expand wind and solar electricity generation, biogas production, electricity and gas
storage, and hydrogen production via electrolysis. This substitution reduces greenhouse gas
emissions endogenously.
Figure 2. Energy system model used to investigate electrification and renewable gas pathways for Metro Vancouver.
In the electrification pathway furnaces and gas water heaters are replaced by electric heat pumps and electric water
heaters. In the renewable gas pathway, natural gas is replaced by biogas and electrolyzed hydrogen.
3.2. Model modifications
The model used in this study is based on the linear programming model OSeMOSYS (Howells et
al., 2011). This model is well suited to investigate supply-side capacity expansion and dispatch.
For the investigation described in this report the OSeMOSYS model is modified in in two ways.
First, an added simultaneity constraint allows simultaneous dispatch of more than one heating
technology. This modification ensures that each heating technology provides heat in every hour
of the year in accordance with its market share. The modification prevents a single technology
14from providing all heat demand. A building that uses gas heating cannot provide heat to an
electrically heated building when unavailable wind and solar power limits electricity supply.
Second, the storage module contained in the original OSeMOSYS is simplified to reduce
computational complexity. The original code distinguishes between charging and discharging of
storage technologies by two separate modes of operation. These two modes increase the
solution space of the optimization in comparison to single mode optimization. The altered code
removes additional modes of operation by allowing storage technologies to operate in reverse.
3.3. Energy demands
The space heat, water heat, and net electricity demands shown in Figure 3 are each constructed
from an annual demand and a normalized profile. The total annual space and water heat
demands are population-scaled from provincial secondary energy consumption records for the
year 2016 (Natural Resources Canada, 2020). Space heat and water heat include natural gas and
electricity consumed in the residential and commercial sectors. Annual electricity demand is
based on the BC Hydro fiscal 2016 total electricity supply (BC Hydro, 2016). Net electricity
excludes electric heating. Space heater efficiencies (Natural Resources Canada, 2020) and water
heater efficiencies (NRCan, 2012) are used to estimate end-use energy demands from the
available secondary energy consumption data.
Figure 3. Estimated hourly end-use energy demands for Metro Vancouver are the product of annual secondary energy
demand records, heater efficiencies, and normalized hourly demand profiles.
The energy demand profiles determine the fraction of annual energy demand that the model
must provide in each hour of the year. The commercial space and water heat demand profiles
15are based on 15 commercial reference building models that represent ~ 70% of the commercial
building stock in the United States of America (NREL, 2011). The residential water heat demand
profile is based on data provided by Ontario’s Independent Electricity System Operator (IESO,
2019). The residential space heat demand profile is derived from proprietary residential
electricity demand data provided by the utility BC Hydro, as described in Palmer-Wilson (2020).
The net electricity demand profile is the difference between the provincial electricity demand
profile (BC Balancing Authority, 2021) and the space and water heat demands served by
electricity.
3.4. Space heat demand under low temperature conditions
Based on 2016 residential demand and typical mean year commercial demand, the estimated
hourly end-use space heat energy demand in Metro Vancouver peaks at 5.9 GW. That demand
may underestimate the peak demand under low temperature conditions. Personal
correspondence between the authors of this report and FortisBC Inc. revealed that natural gas
delivery in British Columbia reached ~20 GW above baseload during a minimum temperature
weather event in 2020.
To quantify energy system requirements for low-temperature demand peaks, a regression
analysis between space heat demand and ambient temperature was performed. Between 1995
and 2019, the Pitt Meadows Climate Station recorded the lowest temperature of -16 °C in 1996.
The 3197 heating degree days in that year are the third highest on record. For comparison, the
lowest temperature in 2016 was -12.8 °C with 2568 heating degree days.
To hind cast a low-temperature demand profile, a second-degree polynomial equation was fit to
minimize square errors between hourly end-use space heat demand and ambient temperature
for temperatures below the chosen heating degree day threshold of 18 °C (Figure 4). For the
residential sector, the equation was fitted directly onto the temperature data. For the
commercial sector, the equation was fitted onto the 90th percentiles of 20 temperature bins of
equal width to better capture peak space heat demand during low temperature events. Next, the
residential and commercial equations of best fit each hind cast respective hourly space heat
demand profiles for all temperature profiles recorded between 1995 and 2019 using the hourly
16ambient temperature records for the Pitt Meadows Climate Station. The sum of the resulting
demand profiles peak at 12 GW for the temperature profile recorded in 1996.
Figure 4. End-use space heat demand versus temperature in the residential and commercial sectors. The red curve
shows the second-degree polynomial equation of best fit. The residential equation is fitted directly onto the temperature
data and results in a Coefficient of Determination R² = 0.84. The commercial equation is fitted onto the 90th percentiles
(black dots in right graph) of 20 temperature bins of equal width to better capture peak space heat demand during low
temperature events.
3.5. Energy production
Hydro power generation capacity (12.9 GW) and annually available energy (60 TWh) are based
on the BC Hydro Load-Resource Balance for fiscal year 2015 (BC Hydro, 2013, Tables 2 - 3).
Available energy and power are population-scaled Metro Vancouver. Hydro power capacity is
fixed. The available energy is dispatched on a partially flexible, partially pre-determined profile
(Figure 5) to simplify the complex operating constraints observed by British Columbia’s large
hydro and run-of-river power stations. These constraints include snowmelt-driven water inflows,
minimum water discharge rates, or flood control. This study estimates that approximately 41
TWh are dispatched to meet operating constraints; approximately 19 TWh are dispatchable at
any time of the year (BC Hydro, 2017b). The cost and emissions of hydroelectric energy are 60
$/MWh and 29.9 gCO2_eq./kWh (Government of British Columbia, 2019).
17Figure 5. Estimated monthly minimum capacity factors define the profile shape of ~ 41 TWh generated by British
Columbia’s hydroelectric power stations on a pre-determined schedule (BC Hydro, 2017). Generation peaks in June
and July when snowmelt-freshet inflows dominate.
The model installs wind power capacity at scenario-dependant costs between 1219 and 2395
$/kW. The exogenous wind generation profile is based on the hourly mean capacity factor of 30
potential sites located in southern, central, coastal, and eastern British Columbia (GE Energy
Consulting, 2016). The annual mean capacity factor is 33.2%.
The model chooses to install solar power capacity at scenario-dependant costs between 669 and
2021 $/kW. The exogenous solar generation profile is based single-axis tracking potential in
Vancouver and provided by NREL’s PV Watts (National Renewable Energy Laboratory, 2013). The
annual mean capacity factor is 24.3%.
Gas production includes natural gas, biogas, and hydrogen produced from electrolysis. In this
study, biogas and hydrogen substitute natural gas on an energy-equivalent basis. Natural gas
costs 1.19 $/GJ (U.S. Energy Information Administration, 2020) and emits 50.3 gCO2/MJ (U.S.
Energy Information Administration, 2011). FortisBC plans to procure 30 GJ of biogas that emit 11
gCO2/MJ to meet renewable gas and emission reduction targets by 2030. Costs of biogas were
estimated at 23 $/GJ by the authors. Specific costs are confidential, but FortisBC confirmed that
this estimate reasonably aligns with their portfolio average. Beyond the 30 GJ of biogas, the
energy system model can choose to produce hydrogen by installing electrolyzer capacity at a
scenario-dependant cost of 1400 $/kW (ZEN, 2019) or 500 $/kW (Thema et al., 2019) and an
assumed efficiency of 78%.
183.6. Energy storage
Electricity and gas storage technologies provide flexibility to balance supply and demand. Storage
technologies can store energy up to their installed energy capacity. Storage technologies can
provide power to supply demand, or demand power to increase stored energy, up to the installed
power and energy capacities, respectively. The model determines energy and power capacities
independently of each other.
The model can choose to install electricity and gas storage technologies. Electricity storage has a
round-trip efficiency of 86%. Installation costs are scenario dependant to reflect 2030 or 2050
battery storage as forecast by Schmidt et al. (2019). Gas storage capital costs (1 $/kW and 0.1
$/kWh) are consistently low across all scenarios, with assumed operating costs being nil. Gas
storage has an assumed round-trip efficiency of 100%.
3.7. Scenarios
Three scenarios investigate energy system costs and capacity requirements across a range of
possible futures. Technology costs, technology performance, energy demand, or renewable
energy supply varies between each scenario. Table 1 summarizes the defining variation of each
scenario.
The Reference scenario applies 2030 lithium-ion battery storage costs, and present wind and solar
costs determined by the latest resource options report performed by BC Hydro. FortisBC’s
provincial biogas target of 30 PJ is scaled to Metro Vancouver by population. The space heat
demand is based on historic temperature correlation and hind cast for the 1996 temperature
profile.
The MuchBiogas scenario applies a large availability of biogas resources. The 93 PJ include
estimated wood gasification supplies in British Columbia.
The LowHeatDemand scenario applies 2016 space heat demand data. That data has a lower peak
and lower overall energy demand than the hind cast 1996 demand applied in all other scenarios.
19Table 1. Three scenarios determine low-carbon energy system costs and capacity requirements for a range of future
energy demand, and renewable energy resource potentials.
Scenario Description Rationale
Reference a) 2030 Li-Ion battery cost a) (Schmidt et al., 2019)
b) BC Hydro Wind/Solar cost b) (BC Hydro, 2020)
c) Biogas target 2030 (30 PJ x 53%) c) Personal
d) 1996 temperature profile (high heat correspondence with
demand) FortisBC Inc.
d) Section 3.4
MuchBiogas High biogas availability, including wood (Hallbar Consulting, 2017)
gasification (93.6 PJ x 53%)
LowHeatDemand 2016 temperature profile (low heat demand) Section 3.3
4. Results
4.1. Greenhouse gas emissions
In both pathways, substituting natural gas with electricity or renewable gas reduces greenhouse
gas emissions by approximately 80%. That reduction aligns with British Columbia’s 2050 target,
but the model includes only a fraction of overall emission sources. The 80% reduction includes
all electricity generation, and the share of natural gas combusted for space and water heating in
Metro Vancouver’s residential, commercial and institutional building sectors.
Figure 6 shows emission reductions in the Reference scenario as natural gas substitution rates
increase from 0 to 100% in the electrification pathway (Elec) on the left, and the renewable gas
pathway (RNG) on the right. The whiskers delineate the range of emissions observed across all
scenarios. At a natural gas substitution rate of 100%, the remaining emissions result from hydro
power and, in the renewable gas pathway, from biogas. The MuchBiogas scenario retains the
largest emissions (top whiskers) because the larger biogas resource availability enables larger
emissions. The LowHeatDemand scenario retains the lowest emissions (bottom whiskers)
because lower overall energy production leads to lower emissions.
20Figure 6. Reference scenario greenhouse gas emissions from electricity generation and gas combustion in Metro
Vancouver's building heating sector. Horizontal axes show natural gas substitution rates ranging from 0% to 100% in
10% increments. Whiskers denote emissions observed across all scenarios in the electrification pathway (Elec) on
the left, and in the renewable gas pathway (RNG) on the right.
4.1. Electricity generation and storage capacity
Figure 7 shows the energy system expansion in the Reference scenario. Electricity (left column)
or renewable gas (right column) gradually replace natural gas in 10% increments. Wind and solar
supplement hydro electricity generation (top row) in both pathways. The installed electricity
generation capacity (center row) in the electrification pathway exceeds installation in the
renewable gas pathway. That larger capacity installation is driven by a peak space heat demand
event during a five-day cold period in February, and leads to large surplus electricity generation
in the remaining year. The energy storage capacity (bottom row) reaches 80 GWh of electric, and
~1000 GWh of gas storage capacity.
21Figure 7. Reference scenario energy system transition in the electrification (Elec) and renewable gas (RNG) pathways.
Horizontal axes show natural gas substitution rates ranging from 0% to 100%. The top row shows electricity generation
and potential surplus for the one-year modelling period. The center row shows installed electric power generation
capacities. The bottom row shows electric energy storage capacity on the left, and gas storage energy capacity on the
right. Gas storage capacity reaches ~ 1000 GWh; the axis range highlights the electric energy storage capacity because
gas storage is effectively unconstrained in British Columbia. Error bars show minimum and maximum energy storage
capacities observed across all scenarios.
Scenario analysis reveals that energy storage capacity requirements and resulting total system
costs are sensitive to biogas supply and energy demand. The error bars in Figure 7 show minimum
and maximum energy storage capacities observed across all scenarios. The Reference scenario
results in the largest electric energy storage capacity of 80 GWh. The LowHeatDemand scenario
requires only 4 GWh of electric energy storage capacity.
224.2. Pathway costs
The large range of electric storage capacity installation leads to significant system cost
differences between the electrification and the renewable gas pathways. Either pathway can
result in lower overall costs, but the range of costs is more narrow in the renewable gas pathway.
The Reference scenario reveals that peak electricity demand that exceeds present-day
dispatchable generation capacity is the largest cost driver in the electrification pathway. The
MuchBiogas scenario reveals that limited biogas supply is the largest cost driver in the renewable
gas pathway because higher-cost hydrogen production requires expansion of electrolyzers,
additional electricity generation capacity, and gas storage.
The cost differences between electrification and renewable gas pathways range from -52% to
+35% across all sensitivity scenarios (Figure 8). The electrification pathway is most cost-
favourable (-52%) in the LowHeatDemand scenario where electricity demand peaks at 5.9 GW,
as opposed to 12.3 GW in the Reference scenario. The renewable gas pathway is most cost-
favourable (+35%) in the MuchBiogas scenario.
Figure 8. Percentage cost difference between electrification and renewable gas pathways at 100% natural gas
substitution across all scenarios.
5. Discussion
5.1. Policy implications
The electrification and the renewable gas pathway both reduce emissions by ~80%, but costs are
sensitive to energy demand and biogas supply. In the electrification pathway, total system costs
increase significantly when peak electricity demand exceeds the dispatchable electricity
generation capacity. New renewable and dispatchable generation capacity must supply any
23electricity demand that exceeds present load-carrying capability. In British Columbia,
dispatchable generation is limited to large hydro power stations, and to a smaller extent biomass
and natural gas fired power stations that are not included in this study. The high cost of meeting
peak electricity demand with storage technologies warrants support to develop and deploy
renewable dispatchable generation technology like geothermal power stations, or expanding the
capacity of existing hydroelectric dams. Conversely, the high value of avoiding an increase in peak
electricity demand warrants support for building-efficiency improvements, heat-pump adoption,
and demand side measures.
Relying on storage to provide electricity during extended peak demand events may not be
feasible. The 80 GWh of electric storage capacity observed in the reference scenario is equivalent
to ~ 8 pumped storage facilities of typical size. For comparison, the existing Aitken Creek gas
storage facility in northeastern BC can store 80,000 GWh of natural gas. Installing 8 pumped
storage facilities to decarbonize a relatively small economic segment (residential and commercial
heating in Metro Vancouver) does not appear feasible in light of environmental impacts and
public opposition these facilities face. Further research is required to identify economic segments
where electrification provides the best cost-benefit.
5.2. The Open Source Energy System Model OSeMOSYS
The Open Source Energy System Model applied in this study is developed and maintained at the
Swedish Royal Institute of Technology KTH. OSeMOSYS is available in the GAMS, MATHPROG, or
Python programming languages (GitHub, 2021). An active community of energy specialists
provide support for new and experienced users to facilitate adoption (Google Groups, 2021).
OSeMOSYS has been used to investigate a wide variety of energy transitions because the open
source code is adaptable to a wide range of regional scales and energy systems. More than 60
publications study regions across four continents (osemosys.org, 2021). Examples include
residential building decarbonization at municipal scale (Leibowicz et al., 2018), inter-provincial
electricity transmission expansion (English et al., 2017), and game-theory application to
international electricity trade (de Moura et al., 2018). The user can define different energy
demands, production, and storage technologies. In this study, the model must satisfy Metro
24Vancouver’s electricity and gas demands by optimizing several electricity and gas production and
storage technologies. The model is ideal to represent a custom subsection of the energy system,
and provides opportunity to investigate the interactivity of the gas and electricity system.
OSeMOSYS provides flexible implementation of temporal resolution to control computational
complexity. For long-term planning, variable-length representative time slices enable multi-
decadal capacity expansion to avoid computationally expensive higher-resolution time steps.
Without requiring modifications to the model code, the investigation described in this report
applies hourly time steps that provide detailed analysis of balancing demand with variable
renewable energy sources. This temporal detail is crucial to comparing the infrastructure
requirements of electrification and renewable gas pathways in British Columbia because 1) fossil
fuel substitution will increase low-carbon electricity demand, 2) British Columbia commits to a
minimum renewable electricity share of 93%, and 3) variable wind and solar power are the most
abundant renewable energy sources.
The integration of the OSeMOSYS energy system model and its derivatives would benefit the
national modelling platform. Making all Canadian energy system models available in a single
national platform increases the potential of that platform to become the predominant
repository.
5.1. Model and data availability
This report’s energy system model, parameter inputs, and resulting output files are available for
download via the GitHub repository located at:
https://github.com/ResearchAtPlay/MetroVanRNG
Energy demand and supply data are taken from publicly available sources. The model and
parameter files are human-readable. A third-party modeller can solve the optimization problem
and reproduce the results presented in this report using the freely available open source GNU
Linear Programming Kit GLPK (Makhorin, 2000). However, the published repository does not
allow recreating of the entire workflow from raw public data to optimization results. Model
development is an iterative process with prototypical workflow design. The files in the published
repository are a subset of the larger workflow. This workflow incudes:
251. Retrieving, cleaning, and formatting several energy supply and demand datasets using the
Excel software package and python scripts.
2. Processing energy supply and demand datasets to create scenario-specific data using the Excel
software package and python scripts.
3. Compiling scenario-specific datasets into comprehensive model parameter files using python
scripts.
4. Executing the optimization to solve the computational problem defined in the model and
parameter files. This step is performed on a high-performance computer cluster using layered
python and bash scripts that interface Windows and Linux operating systems.
5. Retrieving and processing the optimization results to produce succinct result tables and
visualizations using python scripts.
The complexity of this workflow design and the dependency on a range of software and hardware
environments makes recreation of the entire workflow challenging. Even if all scripts and data
are publicly available, a third party modeller would need to adapt these scripts to their own
computing environment and matching folder structure. New modelling tools like the Spine
Toolbox are in development to solve the workflow design problem and enable more complete
model, data, and workflow sharing (spine-model.org, 2021).
5.2. Model usability for policy design
Achieving net-zero emissions by 2050 – only 29 years from the writing of this report – requires
1) vast low-carbon infrastructure expansion to eliminate fossil fuel combustion via fuel
substitution, 2) reduce energy demand through energy efficiency measures, and 3) create
greenhouse gas sinks to balance emissions from difficult-to-decarbonize sectors. Public support
for this transition is crucial to avoid delays in mitigating the global climate change. Results from
this model can help quantify those infrastructure requirements and then transparently
communicate the global scale and unprecedented pace of the low-carbon energy transition.
Cost-effective policy design can help expedite the emission reductions. Scenario analysis captures
uncertainties regarding cost forecasts, energy demands, and renewable energy availability.
26Comparison of the range of total costs for renewable gas and electrification pathways reveals
that the range of costs is more narrow in the renewable gas pathway. Considering this
uncertainty in energy policy design may mitigate the risk of incurring excessive costs.
5.3. Future work
The investigation described in this report revealed possible emission reductions of ~ 80% in the
combined building heating and electricity sector for both pathways. The relatively small but still
significant greenhouse gases emitted by hydropower and biogas will ultimately need to be
eliminated. Negative emission services like direct air capture with carbon sequestration may be
necessary to mitigate the global climate change. Additional study is required to understand the
overall costs and energy system impacts of integrating such negative emission technologies.
This report’s investigation is limited to net electricity demand, and space and water heat demand.
To better understand the energy system impacts of electrifying several economic sectors
simultaneously, and to determine which sectors the existing electricity system can best
accommodate, fuel substitution in other sectors need to be integrated. The “overnight”
substitution of natural gas in this study does not include future changes in energy demand. A
gradual transition of the energy system from a present state to a future state could account for
efficiency measures, economic development, or population growth.
Further research is required to assess operational feasibility and resilience of the energy system
capacities determined in this report. Operational feasibility means ensuring that the energy
system provides sufficient dispatchable capacity, flexibility and energy to meet all demands.
Investigating snapshots of the energy system using high temporal and spatial resolution will
reveal resilience under varying energy demand and supply scenarios.
Demand side variations may include:
varying penetrations of distributed generation technologies that reduce net load, e.g.
rooftop photovoltaics
weather and climate variability that impact building heating and cooling demands
transportation demand profile dynamics
27Supply-side variation may include:
low-water inflow to the hydroelectric dams
extended time periods without wind or solar availability
Linking the results reported here with the production cost model SILVER (McPherson and Karney,
2017) lends itself to investigating these variations. SILVER combines scenario planning, network-
constrained dispatch, unit commitment, and power flow analyses frameworks, and is presently
being adapted to include the cascaded hydroelectric system of British Columbia. Combining the
application of OSeMOSYS and SILVER will reveal comprehensive insight into feasible emission
reduction pathways for British Columbia.
5.4. Data availability constraints
Data availability determines the ability to design decarbonization research. The data available for
British Columbia presents a barrier to improve investigations of uncertainty regarding the
balancing of energy demand and supply, as described in Section 2. Matching supply and demand
is a stochastic process. Ideally, variable renewable energy production data at high temporal and
spatial resolution would be available for multiple years across Canada. Modelling stochasticity
would improve uncertainty estimates.
This study focuses on the largest population center, Metro Vancouver Regional District, rather
than all of British Columbia because of limited demand data availability. Since Metro Vancouver
houses 53% of BC’s population and plans to achieve carbon neutrality by the same year as the
province, eliminating fossil fuel combustion in Metro Vancouver is a significant step towards
overall emission reductions.
6. Conclusion
This report investigates greenhouse gas emission reduction options in the building heating sector
of Metro Vancouver, British Columbia. Two transition pathways compare substitution of fossil
fuels with electricity or gas produced from renewable sources. An energy system model
28determines energy production and storage capacities able to supply space heat, water heat, and
electricity for a one-year period. The hourly resolution of this model enables investigation of
supplying those energy demands with variable wind and solar power.
The existing low-carbon electricity system in British Columbia can substitute some fossil fuels at
relatively low cost, but the available energy and power capacities limit this substitution.
Electrification of large energy-consuming sectors result in additional electricity storage
infrastructure requirements that lead to high overall costs. The completed study shows that
electricity or renewable gas substitution of fossil fuels can both reduce greenhouse gas
emissions, but costs and capacity requirements of either pathway are sensitive to energy demand
and available resources. Peak electricity demand is the largest cost driver in the electrification
pathway – this finding shows the value of using both electrification and renewable gas transitions
in combination. The overall goal of quantifying energy system impacts of both pathways is
achieved by analyzing a range of scenarios. This analysis results in upper and lower bounds of
possible pathway trajectories.
297. References
BC Balancing Authority, 2021. Historical Transmission Data - Gross Telemetred Load: British
Columbia.
BC Hydro, 2021. Historical Data - Net Actual Flow [WWW Document]. URL
https://www.bchydro.com/energy-in-bc/operations/transmission/transmission-
system/actual-flow-data/historical-data.html (accessed 3.10.21).
BC Hydro, 2020. Generation Supply-Side Options - Resource Options Update.
BC Hydro, 2017a. Transmission Service Freshet Rate. Preliminary Evaluation Report for Year 1.
Appendix D. BC Hydro System Conditions during Freshet and Associated Management
Strategies.
BC Hydro, 2017b. Transmission Service Freshet Rate. Preliminary Evaluation Report for Year 1.
Appendix D. BC Hydro System Conditions during Freshet and Associated Management
Strategies.
BC Hydro, 2016. Fiscal 2017 to Fiscal 2019 Revenue Requirements Application.
BC Hydro, 2013. Integrated Resource Plan. Appendix 9A. Base Resource Plans and Contingency
Resource Plans.
Canada Energy Regulator, 2021. Provincial and Territorial Energy Profiles – British Columbia
[WWW Document]. URL https://www.cer-rec.gc.ca/en/data-analysis/energy-
markets/provincial-territorial-energy-profiles/provincial-territorial-energy-profiles-
british-columbia.html (accessed 2.1.21).
de Moura, G.N.P., Legey, L.F.L., Howells, M., 2018. A Brazilian perspective of power systems
integration using OSeMOSYS SAMBA – South America Model Base – and the bargaining
power of neighbouring countries: A cooperative games approach. Energy Policy 115,
470–485. https://doi.org/10.1016/j.enpol.2018.01.045
English, J., Niet, T., Lyseng, B., Palmer-Wilson, K., Keller, V., Moazzen, I., Pitt, L., Wild, P., Rowe,
A., 2017. Impact of electrical intertie capacity on carbon policy effectiveness. Energy
Policy 101, 571–581. https://doi.org/10.1016/j.enpol.2016.10.026
GE Energy Consulting, 2016. Pan-Canadian Wind Integration Study.
GitHub, 2021. OSeMOSYS/OSeMOSYS. OSeMOSYS.
Google Groups, 2021. OSeMOSYS - Google Groups [WWW Document]. URL
https://groups.google.com/g/osemosys (accessed 3.10.21).
Government of British Columbia, 2019. Electricity Emission Intensity Factors for Grid-Connected
Entities - Province of British Columbia [WWW Document]. URL
https://www2.gov.bc.ca/gov/content/environment/climate-
change/industry/reporting/quantify/electricity (accessed 1.26.21).
Hallbar Consulting, 2017. Resource Supply Potential for Renewable Natural Gas in B.C.
Howells, M., Rogner, H., Strachan, N., Heaps, C., Huntington, H., Kypreos, S., Hughes, A.,
Silveira, S., DeCarolis, J., Bazillian, M., Roehrl, A., 2011. OSeMOSYS: The Open Source
Energy Modeling System. Energy Policy 39, 5850–5870.
https://doi.org/10.1016/j.enpol.2011.06.033
IESO, 2019. Conservation and Demand Management Cost-Effectiveness Tool User Guide - Tool
V7.
30Leibowicz, B.D., Lanham, C.M., Brozynski, M.T., Vázquez-Canteli, J.R., Castejón, N.C., Nagy, Z.,
2018. Optimal decarbonization pathways for urban residential building energy services.
Applied Energy 230, 1311–1325. https://doi.org/10.1016/j.apenergy.2018.09.046
Makhorin, A., 2000. GLPK (GNU Linear Programming Kit) [WWW Document]. URL
https://www.gnu.org/software/glpk/ (accessed 3.10.21).
McPherson, M., Karney, B., 2017. A scenario based approach to designing electricity grids with
high variable renewable energy penetrations in Ontario, Canada: Development and
application of the SILVER model. Energy 138, 185–196.
https://doi.org/10.1016/j.energy.2017.07.027
Ministry of Environment and Climate Change Strategy, 2021. Community energy and emissions
data [WWW Document]. URL
https://www2.gov.bc.ca/gov/content/environment/climate-change/data/provincial-
inventory (accessed 3.10.21).
National Renewable Energy Laboratory, 2013. PVWatts.
Natural Resources Canada, 2020. Comprehensive Energy Use Database.
NRCan, 2012. Water Heater Guide, Cat. No. M144-243/2012E-PDF. ed.
NREL, 2011. U.S. Department of Energy Commercial Reference Building Models of the National
Building Stock (No. NREL/TP-5500-46861).
osemosys.org, 2021. OSeMOSYS Publications [WWW Document]. OSeMOSYS. URL
http://www.osemosys.org/publications1.html (accessed 2.25.21).
Palmer-Wilson, K., 2020. How do we power decarbonization? Land and other resources in
Canada’s West. University of Victoria, Canada.
Schmidt, O., Melchior, S., Hawkes, A., Staffell, I., 2019. Projecting the Future Levelized Cost of
Electricity Storage Technologies. Joule 3, 81–100.
https://doi.org/10.1016/j.joule.2018.12.008
spine-model.org, 2021. Project Spine [WWW Document]. URL http://www.spine-
model.org/spine_toolbox.htm (accessed 3.10.21).
Trottier Energy Futures Project, 2016. Canada’s Challenge & Opportunity - Transformations for
major reductions in GHG emissions - Full technical report and modelling results.
U.S. Energy Information Administration, 2020. Annual Energy Outlook 2020 [WWW Document].
URL https://www.eia.gov/outlooks/aeo/data/browser/#/?id=3-AEO2020®ion=1-
8&cases=ref2020&start=2018&end=2050&f=A&linechart=~~~~~ref2020-d112119a.12-
3-AEO2020.1-8~ref2020-d112119a.5-3-AEO2020.1-8~ref2020-d112119a.38-3-
AEO2020.1-8&map=ref2020-d112119a.4-3-AEO2020.1-
8&ctype=linechart&chartindexed=0&sid=ref2020-d112119a.12-3-AEO2020.1-
8~ref2020-d112119a.5-3-AEO2020.1-8~ref2020-d112119a.38-3-AEO2020.1-
8&sourcekey=0 (accessed 1.26.21).
U.S. Energy Information Administration, 2011. Voluntary Reporting of Greenhouse Gases
Program - Electricity Factors [WWW Document]. URL
https://web.archive.org/web/20110520212955/http://www.eia.gov/oiaf/1605/coefficie
nts.html (accessed 1.26.21).
ZEN, 2019. British Columbia Hydrogen Study.
31You can also read