UK ENERGY IN BRIEF 2021 - GOV.UK
←
→
Page content transcription
If your browser does not render page correctly, please read the page content below
UK ENERGY IN BRIEF 2021
This publication is available from: www.gov.uk/government/statistics/uk-energy-in-brief-2021

If you need a version of this document in a more accessible format, please email
enquiries@beis.gov.uk. Please tell us what format you need. It will help us if you say what
assistive technology you use.

This is a National Statistics publication

The United Kingdom Statistics Authority has designated these statistics as National Statistics,
in accordance with the Statistics and Registration Service Act 2007 and signifying compliance
with the UK Statistics Authority: Code of Practice for Statistics.

The continued designation of these statistics as National Statistics was confirmed in
September 2018 following a compliance check by the Office for Statistics Regulation. The
statistics last underwent a full assessment against the Code of Practice in June 2014.

Designation can be broadly interpreted to mean that the statistics:

   •   meet identified user needs

   •   are well explained and readily accessible

   •   are produced according to sound methods, and

   •   are managed impartially and objectively in the public interest
Once statistics have been designated as National Statistics it is a statutory requirement that
the Code of Practice shall continue to be observed.
UK ENERGY IN BRIEF 2021
This booklet summarises the latest statistics on energy production,
consumption, prices and climate change in the United Kingdom. Figures
are primarily taken from the 2021 edition of the “Digest of UK Energy
Statistics”, published on 29 July 2021. Details of the Digest and other
Department for Business, Energy and Industrial Strategy (BEIS) statistical
publications on energy and climate change can be found on pages 47
and 48 of this booklet and are available at:
www.gov.uk/government/organisations/department-for-business-energy-
and-industrial-strategy/about/statistics

                                    1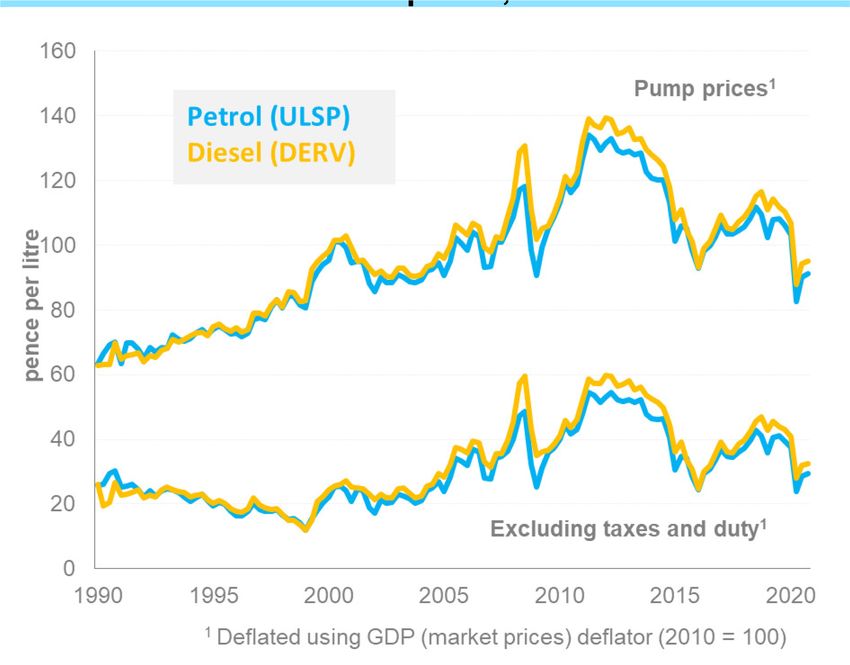
CONTENTS

INTRODUCTION TO THE CHARTS AND TABLES                                      4

ENERGY IN THE ECONOMY
  The energy industries’ contribution to the UK economy                    5
  Contribution to GVA                                                      5
  Trends in employment                                                     6
  Investment                                                               7

OVERALL ENERGY
  Production of primary fuels                                              8
  Inland energy consumption                                                9
  Final energy consumption                                                10
  Import dependency                                                       11
  Key sources of imports                                                  12
  Proportion of UK energy supplied from low carbon sources                13
  Energy and carbon ratios                                                14

CLIMATE CHANGE
  Territorial greenhouse gas emissions by gas                             15
  Territorial greenhouse gas emissions by National Communication sector   16

SECURITY OF SUPPLY
  Reliability                                                             17

COAL
  Production and imports                                                  18
  Consumption                                                             19

PETROLEUM
  Foreign trade in crude oil and petroleum products                       20
  Demand by product                                                       21
  Demand for road fuels                                                   22
  Road fuel demand during the Covid-19 pandemic                           23

OIL AND GAS PRODUCTION
  UK Continental Shelf production                                         24
  Oil and gas production and reserves                                     25

NATURAL GAS
  Demand                                                                  26
  Trade                                                                   27

ELECTRICITY
  Generated                                                               28
  Supplied                                                                29
  Capacity                                                                30
  Microgeneration capacity                                                31

                                            2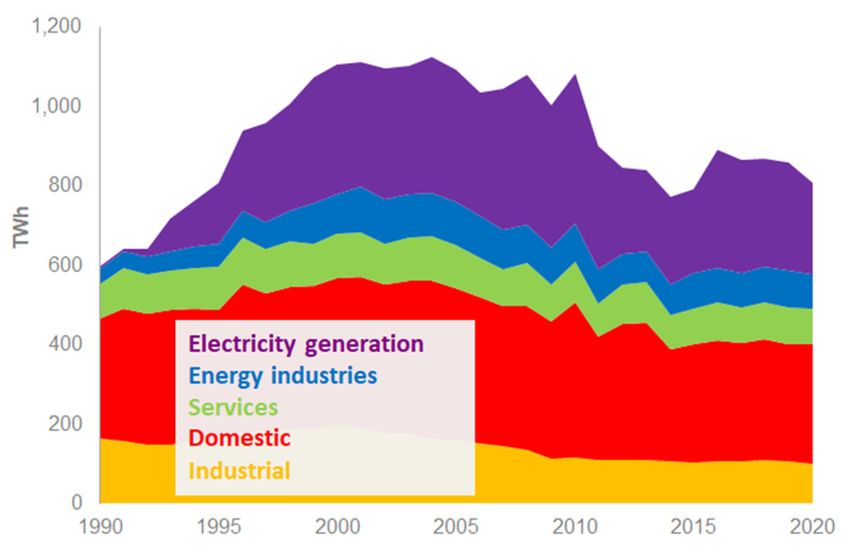
CONTENTS

RENEWABLES
  Energy sources                                     32
  Electricity generation from renewable sources      33
  UK onshore and offshore wind capacity map          34

COMBINED HEAT AND POWER                              35

ENERGY EFFICIENCY
  Energy intensity                                   36
  Number of homes with energy efficiency measures    37
  Smart meters                                       38

FUEL POVERTY
  Households in fuel poverty                         39
  Low income households by FPEER band                40

PRICES
  Fuel price indices for the industrial sector       41
  Fuel price indices for the domestic sector         42
  Petrol and diesel prices                           43

EXPENDITURE
  Fuel expenditure of households                     44

CONTACTS                                             45

CONVERSION FACTORS AND DEFINITIONS                   46

REFERENCES                                           47

                                                 3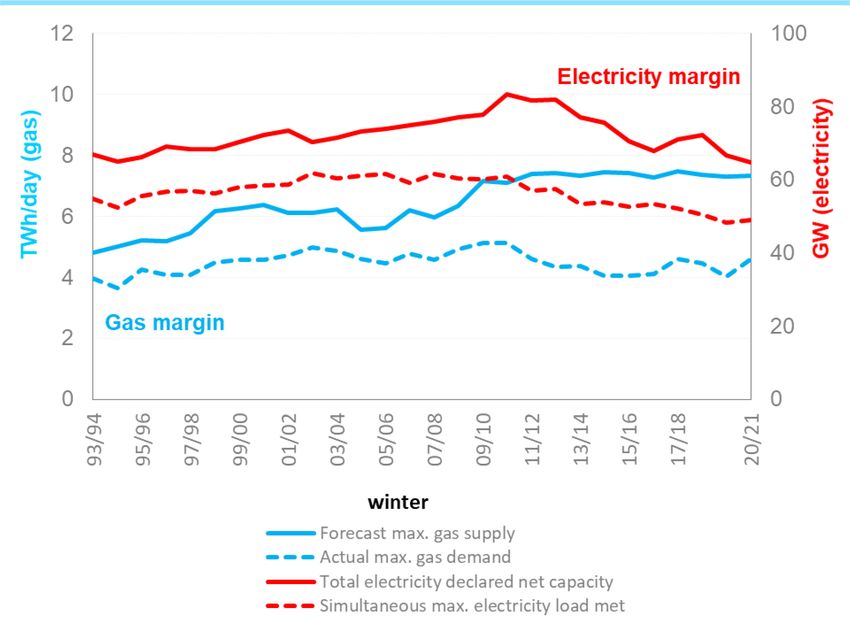
INTRODUCTION TO THE CHARTS AND TABLES
UK Energy in Brief aims to provide a summary of some of the key developments in the UK
energy system: how energy is produced and used and the way in which energy use
influences greenhouse gas emissions. It takes data from the main Department for
Business, Energy and Industrial Strategy (BEIS) energy and climate change statistical
publications, the Digest of UK Energy Statistics, Energy Trends, Energy Prices, Energy
Consumption in the UK, the annual Fuel Poverty statistics report and the quarterly Smart
Meters report and statistical releases on emissions, and combines these with data
produced by the Office for National Statistics and other Government Departments.

The booklet contains separate sections on the economics of the energy industry, overall
energy production and consumption and trends in production and consumption of the
major fuel sources, climate change and fuel poverty. Also discussed are developments in
combined heat and power and renewable energy. Information is also given on energy
efficiency, energy prices and energy expenditure.

The detailed background data on energy production and consumption can be found in the
Digest of UK Energy Statistics 2021 available at:
www.gov.uk/government/collections/digest-of-uk-energy-statistics-dukes

Other statistical outputs produced by BEIS and drawn on in this publication are listed on
pages 47 and 48.

                                           4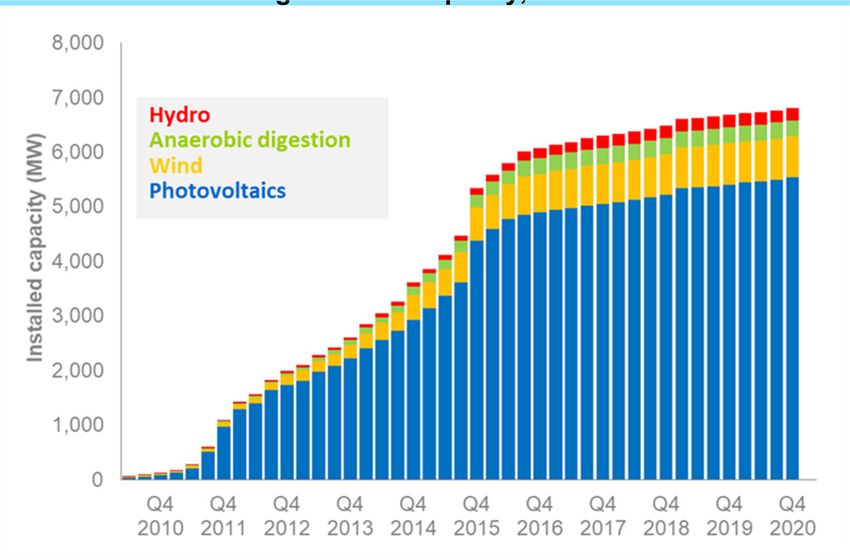
ENERGY IN THE ECONOMY

        THE ENERGY INDUSTRIES’ CONTRIBUTION TO THE UK ECONOMY IN 2020
          • 2.1% of GVA (Gross Value Added).

          • 7.3% of total investment.

          • 26.4% of industrial investment.

          • 1.2% of annual business expenditure on research and development in 2019.

          • 181,000 people directly employed (6.4% of industrial employment) and more
            indirectly (e.g. in support of UK Continental Shelf production).

                       Contribution to GVA by the energy industries, 1980 to 2020

                  12
                                                                              Gas
                                                                       Electricity
                  10                                     Nuclear fuel processing
                                                                         Refining
                                                          Oil and gas extraction
                  8                                              Coal extraction
Per cent of GVA

                  6

                  4

                  2

                  0
                   1980     1985    1990      1995   2000   2005     2010    2015       2020p

Source: Office for National Statistics

The contribution to the UK economy by the energy industries peaked in 1982 at 10.4%. In
2020, the contribution by the energy industries to the UK economy was 2.1% of GVA, 0.3
percentage points lower than in 2019.

Despite its significant fall in 1986, oil and gas extraction has been the major energy
contributor to the UK economy (with its value dependent both on production and the price
of oil and gas) up until 2014 before falling below that of the electricity sector. In 2020,
production and prices both fell due to the impact on supply and demand of the Covid-19
pandemic, however the oil and gas sector remained the second largest contributor. Of the
energy total in 2020 electricity (including renewables) accounted for 56%, oil and gas
extraction accounted for 27%, and gas accounted for 11%.

                                                     5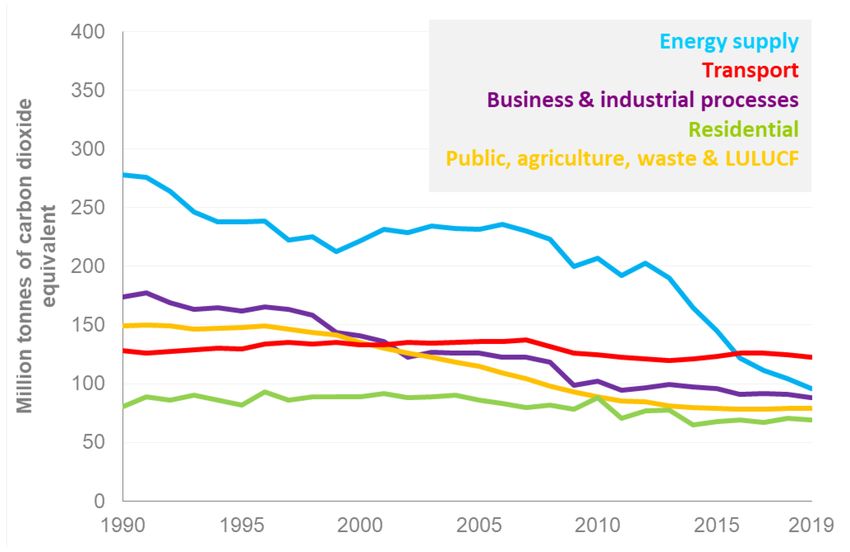
ENERGY IN THE ECONOMY
                       Trends in employment in the energy industries, 1980 to 2020

                       600

                                                                                     Gas
                       500
                                                                              Electricity
                                                                      Coke and Refining
                       400                                       Oil and gas extraction
 Thousands of people

                                                                 Solid fuels production
                       300

                       200

                       100

                         0
                          1980   1985   1990   1995       2000    2005       2010       2015        2020p

Source: Office for National Statistics (Data from 1996 onwards based on SIC 2007 classifications)

Employment in the energy production and supply industries fell rapidly throughout the
1980s and mid-1990s largely as a result of closures of coal mines. Between 1995 and mid-
2000s employment declined more slowly but since 2006 it has increased gradually, driven
largely by growth in the electricity and gas sectors. In 2020 employment in the energy
industries rose by 2.3% on the previous year to 181,000 which was 66% above the 2005
level and accounted for 6.4% of all industrial employment.

                                                      6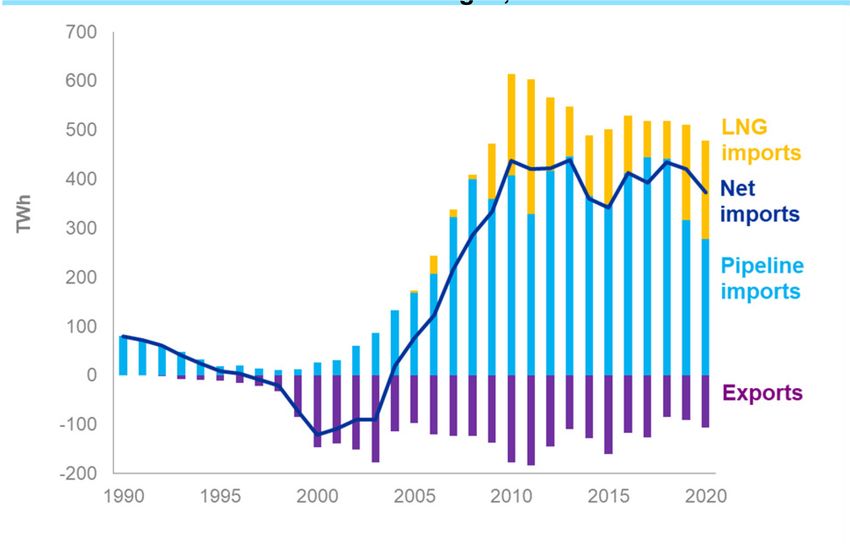
ENERGY IN THE ECONOMY
                                       Investment in the energy industries, 2005 to 2020
                               25    Coke, petroleum products
                                     Gas
                                     Electricity
                               20
                                     Oil and gas extraction
                                     (inc mining of coal)
  £ billion (current prices)

                               15

                               10

                               5

                               0
                                    2005   2007    2009   2011       2013   2015   2017    2020

Source: Office for National Statistics

In 2020 investment in the energy industries at £15.0 billion (at current prices) was 23%
lower than in 2019, and at the lowest level since 2010 due to the impact of the Covid-19
pandemic.

Of the total invested electricity contributed 66% (up 10 percentage points on 2019), oil and
gas extraction (including a small proportion of less than 0.01% for coal extraction)
contributed 18% (down 12 percentage points on 2019), gas contributed 13% (up 2
percentage points on 2019), with the remaining 4% in coke & refined petroleum products
industries (unchanged from 2019).

                                                                 7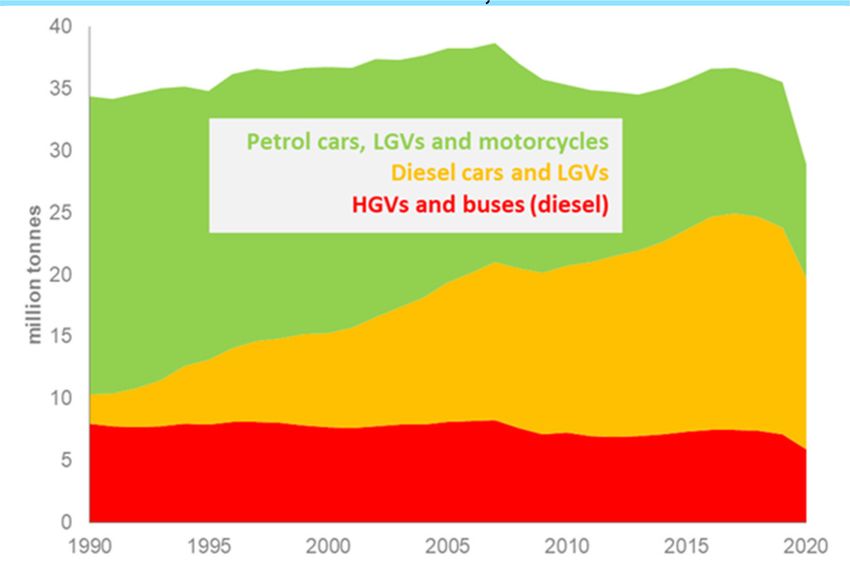
OVERALL ENERGY
                                               Production of primary fuels, 1990 to 2020
                                    140
                                                                                                        1990
                                                                                                        2000
 Million tonnes of oil equivalent

                                    120
                                                                                                        2010
                                    100
                                                                                                        2018
                                     80
                                                                                                        2019
                                                                                                        2020
                                     60

                                     40

                                     20

                                      0
                                          Primary oil    Natural gas       Coal         Primary      Bioenergy &
                                                                                       electricity      waste
                                                                                     Million tonnes of oil equivalent
                                                        1990       2000      2010          2018      2019        2020
Primary oil                                             100.1     138.3       69.0         56.0      57.4        53.6
Natural gas                                              45.5     108.4       55.3         38.8      37.4        37.7
Coal                                                     56.4      19.6       11.4          1.9        1.8        1.2
Primary electricity                                      16.7      20.2       15.1         20.5      19.2        18.9
Bioenergy & waste                                         0.7       2.3        5.8         12.0      12.3        12.7
Total                                                   219.4     288.7      156.7        129.3     128.2       124.1

Total production of primary fuels, when expressed in terms of their energy content, fell by
3.1% in 2020 compared to 2019. Growth in renewable sources (bioenergy & waste, wind,
solar & hydro) was offset by reduced fossil fuel and nuclear output, due to delayed North
Sea maintenance activities caused by the Covid-19 pandemic, and numerous outages at
UK nuclear power stations. Coal production fell to a record low level in 2020. Primary oil
(crude oil and Natural Gas Liquids) accounted for 43% of total production, natural gas
30%, primary electricity (consisting of nuclear, wind, solar and natural flow hydro) 15%,
bioenergy and waste 10%, while coal accounted for the remaining 1%.

Total production increased rapidly between 1990 and 2000, mainly due to the growth of oil
and gas. Production in 2000 was at record levels for natural gas, whilst in 1999 it was at
record levels for overall energy and petroleum. Production has since been on a general
decline, however production levels have increased since 2014 until the fall in 2019, as new
oil fields have opened, combined with the growth in output from bioenergy and waste and
the increased capacity of wind and solar technologies. Production is now 58% lower than
its peak in 1999. Since 2000, oil and gas production together have fallen by an average of
5.1% per year.

                                                                       8
OVERALL ENERGY
Inland energy consumption, 1990 and 2020
1990 Primary
electricity
Bioenergy 2020 Bioenergy
and waste
(mainly 0.3% and waste
nuclear) Primary 11.0%
8.3% Oil electricity Oil
36.1% (mainly 31.2%
nuclear)
12.5%
Coal Coal
31.3% 3.4%
Gas
Gas
41.9%
24.0%
Million tonnes of oil equivalent
1990 2000 2010 2018 2019 2020
Total inland primary
energy consumption1: 213.6 234.8 219.3 189.5 184.5 163.3
Conversion losses: 53.8 50.3 34.2 31.8 28.8
Distribution losses 66.4
and energy industry use: 20.7 18.0 14.7 14.7 13.7
Total final energy
consumption: 147.3 159.4 150.3 141.1 138.8 120.9
Final consumption of which:
Industry 38.7 35.5 27.0 23.1 22.4 21.0
Domestic sector 40.8 46.9 48.4 39.5 38.4 39.3
Transport 48.6 55.5 54.6 56.9 56.6 40.5
Services2 19.2 21.5 20.2 21.6 21.4 20.2
Temperature corrected total
inland consumption: 221.6 240.2 213.5 191.4 186.9 167.7
(1) Excludes non-energy use
(2) Includes agriculture, commercial, public administration and miscellaneous.
Primary energy consumption fell by 11% in 2020 compared to 2019, with the large fall due
to the impact of the Covid-19 pandemic on energy supply. The average temperature in
2020 was 0.3 degrees Celsius warmer than in 2019; on a temperature corrected basis,
primary energy consumption was 10% lower than in 2019, continuing the general fall seen
since 2005. In the last 31 years, consumption of natural gas and primary electricity has
risen considerably, whilst consumption of oil and coal have fallen. However, over the past
decade, consumption of bioenergy and waste has also grown.
9OVERALL ENERGY
Final energy consumption, 1990 to 2020
180
160
Million tonnes of oil equivalent
140
120 Domestic
100
Industry
80
60
Transport
40
20
Services (1)
0
1990 1995 2000 2005 2010 2015 2020
2020 Million tonnes of oil equivalent
Industry Domestic Transport Services1 Total
Coal & manufactured fuels 1.2 0.5 0.0 0.0 1.6
Gas 8.1 25.7 0.0 7.7 41.6
Oil 2.2 2.5 37.9 3.5 46.6
Electricity 7.2 9.3 0.4 7.2 24.1
Bioenergy and heat 2.4 1.3 1.6 1.7 7.0
Total 21.0 39.3 40.5 20.2 120.9
(1) Includes agriculture, commercial, public administration and miscellaneous.
Total final energy consumption (excluding non-energy use) was 13% lower in 2020
compared to 2019 due to the impact of the Covid-19 pandemic. It rose by 2.3% in the
domestic sector due to increased home working, but fell by 5.6% in the service sector, by
6.2% in the industry sector and by 29% in the transport sector. The falls in the service and
industry sectors were due to factories, shops, offices and schools all being forced to close
during lockdown, whilst the large fall in the transport sector was due to the travel
restrictions imposed with air consumption down by 60% due to the closure of international
travel corridors, and road consumption down by 18%. Overall final energy consumption,
when adjusted for temperature, was down by 11%, in 2020.
In terms of fuel types, final consumption of gas, the main fuel used for heating, fell by 2%.
Oil use also fell by 26%, whilst electricity consumption fell by 5%, however there was
increased use of bioenergy in all sectors except transport.
10OVERALL ENERGY
Import dependency, 1970 to 2020
60
50
Percentage of energy supply
40
30
20
10
0
-10
-20
-30
1970 1975 1980 1985 1990 1995 2000 2005 2010 2015 2020
Percentage
2000 2005 2010 2018 2019 2020
Coal 39% 71% 52% 78% 68% 47%
Gas -11% 7% 40% 50% 50% 47%
Oil -55% -3% 14% 29% 26% 10%
Total -17% 13% 29% 36% 35% 28%
In the 1970’s the UK was a net importer of energy. Following development of oil and gas
production in the North Sea, the UK became a net exporter of energy in 1981. Output fell
back in the late 1980’s following the Piper Alpha disaster, with the UK regaining a position
as a net exporter in the mid 1990’s. North Sea production peaked in 1999, and the UK
returned to being an energy importer in 2004. In 2013 imports of petroleum products
exceeded exports following the closure of the Coryton refinery; the UK is now a net
importer of all main fuel types, although in 2020 became a net exporter of primary oils for
the first time since 2004, as well as remaining a net exporter of some petroleum products
such as petrol and fuel oil. In 2020, 28% of energy used in the UK was imported, down
sharply from the 2019 level due to the impact of the Covid-19 pandemic as the UK
imported less fuel to meet reduced demand.
11OVERALL ENERGY
Key sources of imports, 1998 to 2020
200 Other
180 Natural gas
Coal
Million tonnes of oil equivalent
160 Petroleum products
Primary oil
140
120
100
80
60
40
20
0
1998 2000 2002 2004 2006 2008 2010 2012 2014 2016 2018 2020
Since 1999, when UK energy production peaked, there has been a sharp rise in imports.
Over this period imports doubled, reaching a peak in 2013, since when they have fallen
before rising again in 2017 and 2018, and then falling back in 2019 and 2020. In 2010
imports exceeded UK production, but because the UK still exports large volumes net
imports remain below production levels. However, in 2020 imports were less than UK
production as the UK imported less fuel to meet reduced demand during the Covid-19
pandemic.
In 2020 imports fell by 18%, with falls in imports of coal, primary oil, petroleum products,
gas and electricity, but a small rise in imports of bioenergy and waste.
Imports are sourced from a wide variety of countries.
Crude oil: The key source of imports has historically been Norway, but its share of UK
imports decreased from 38% in 2019 to 34% in 2020, whilst the share of US imports
continued to grow increasing from 26% in 2019 to 32% in 2020.
Petroleum products: The UK imports a wide variety of petroleum products, while
remaining a net exporter of certain fuels including petrol. Traditionally the Netherlands,
which acts as a major trading hub, has been the largest source of imports. As such, the
Netherlands is the largest supplier of transport fuels. Aviation turbine fuel is generally
sourced from the Middle East.
Gas: Norway accounted for 55% of UK gas imports in 2020, with pipelines from Belgium
and The Netherlands supplying 1% and 2% respectively. The remaining 42% arrived as
Liquefied Natural Gas (LNG), of which 48% was from Qatar. In 2020, Qatari, Russian and
US LNG imports accounted for 87% of all LNG imports, whilst LNG imports were received
from France for the first time.
12OVERALL ENERGY
Proportion of UK energy supplied from low carbon sources,
2000 to 2020
25%
20%
Percentage of energy supply
15%
10%
5%
0%
2000 2002 2004 2006 2008 2010 2012 2014 2016 2018 2020
Percentage
2000 2005 2010 2018 2019 2020
Nuclear 8.4% 7.8% 6.3% 7.4% 6.5% 6.6%
Wind 0.0% 0.1% 0.4% 2.6% 3.0% 4.0%
Solar 0.0% 0.0% 0.0% 0.6% 0.6% 0.7%
Hydro 0.2% 0.2% 0.1% 0.2% 0.3% 0.4%
Bioenergy 0.9% 1.6% 2.3% 6.1% 6.7% 7.8%
Transport fuels 0.0% 0.0% 0.6% 0.7% 0.9% 1.0%
Other 0.0% 0.0% 0.4% 0.8% 0.9% 1.0%
Total 9.4% 9.7% 10.1% 18.5% 18.9% 21.5%
In 2020 the UK obtained 21.5% of its primary energy from low carbon sources, with 37% of
this from bioenergy, 31% from nuclear, and 18% from wind.
Energy supply from biofuels increased by 3.9%, whilst solar was up by 4.4% reflecting
increased capacity. The supply of nuclear fell by 11% due to numerous outages at all 8 of
the UK’s power stations during 2020.
Energy supply from wind increased by 18% in 2020, with capacity up by 2.5% and with
wind speeds 0.8 knots higher than in 2019. Ten named storms affected the UK during
2020 which resulted in 2020 being the windiest year since 2015.
13OVERALL ENERGY
Energy and carbon ratios, 1990 to 2020
120
100
Index 1990=100
80
Energy ratio
60
40
20
Carbon ratio
0
1990 1995 2000 2005 2010 2015 2020
Index 1990=100
1990 2000 2010 2018 2019 2020
Primary energy consumption* 100 108.4 96.3 86.4 84.4 75.7
Carbon dioxide emissions 100 93.6 83.5 62.1 60.0 53.6
GDP 100 129.3 151.5 175.4 178.0 160.4
Energy ratio 100 83.8 63.6 49.2 47.4 47.2
Carbon ratio 100 72.4 55.1 35.4 33.7 33.4
* Temperature corrected primary energy consumption.
The energy ratio is calculated by dividing temperature corrected primary energy
consumption by GDP at constant prices, with the carbon ratio similarly calculated by
dividing carbon dioxide emissions by GDP. Both ratios have fallen steadily, with the energy
ratio declining by around 2½% per year and the carbon ratio declining at a faster pace of
just over 3½% per year.
The downward trends are due to a number of factors, with improvements in energy
efficiency and the decline in the relative importance of energy intensive industries affecting
both ratios. The carbon ratio has been improved further by the increased use of more
carbon efficient fuels and renewables.
The reduction in the carbon ratio in 2020 is primarily due to the large reduction in the use
of road transport during the Covid-19 pandemic lockdowns, with CO2 emissions from
transport falling 20% in 2020.
Latest International Energy Agency data for 2019 shows that the energy ratio is falling in
all G8 countries. The UK is estimated to have the lowest energy ratio in the G8.
14CLIMATE CHANGE
Territorial greenhouse gas emissions by gas, 1990 to 2020
Million tonnes of carbon dioxide equivalent
1990 2000 2010 2018 2019 2020p1
Net carbon dioxide (CO2)
608.3 569.4 508.0 377.7 365.1 326.1
emissions
Methane (CH4) 133.9 110.4 66.9 54.3 54.0 :
Nitrous oxide (N2O) 49.6 29.8 22.8 22.1 22.2 :
Hydrofluorocarbons (HFC) 14.4 7.8 11.8 13.1 12.5 :
Perfluorocarbons (PFC) 1.7 0.6 0.3 0.3 0.3 :
Sulphur hexafluoride (SF6) 1.3 1.9 0.7 0.6 0.6 :
Nitrogen trifluoride (NF3) 0.0 0.0 0.0 0.0 0.0 :
Non-CO2 provisional estimate : : : : : 88.0
Total greenhouse gas emissions 809.1 719.8 610.5 468.1 454.8 414.1
Source: BEIS (2019 final UK figures and 2020 provisional UK figures)
1 Provisional estimates are not made for individual non-CO2 gases separately.
: data not available.
Carbon dioxide (CO2) emissions in the UK are provisionally estimated to have fallen by
10.7% in 2020 from 2019, to 326.1 million tonnes (Mt), and total greenhouse gas
emissions by 8.9% to 414.1 million tonnes carbon dioxide equivalent (MtCO2e). Total
greenhouse gas emissions were 48.8% lower than they were in 1990.
In 2020 the coronavirus (COVID-19) pandemic and the resulting restrictions brought in
across the UK had a major impact on various aspects of society and the economy and this
has had a significant impact on greenhouse gas emissions in the UK over this period,
indicated by the decrease seen in the provisional emissions estimate in 2020.
15CLIMATE CHANGE
Territorial greenhouse gas emissions by National Communication
sector, 1990 to 2019
Million tonnes of carbon dioxide equivalent
1990 2000 2010 2015 2018 2019
Energy supply 278.0 221.5 207.1 111.5 104.3 95.8
Residential 80.1 89.0 87.8 66.6 70.2 69.2
Public, Agriculture, Waste
149.3 135.3 89.0 78.1 78.6 79.2
management and LULUCF
Business and Industrial processes 173.6 140.6 102.0 91.9 90.6 88.3
Transport 128.1 133.3 124.5 126.1 124.4 122.2
Total greenhouse gas emissions 809.1 719.8 610.5 474.2 468.1 454.8
Source: BEIS (2019 final UK figures)
LULUCF – land use, land use change and forestry
In 2019 UK territorial greenhouse gas emissions were estimated to be 454.8 million tonnes
of carbon dioxide equivalent (MtCO2e), 44% lower than in 1990. The transport sector was
the largest single source of GHG emissions in 2019, accounting for 27% of total
emissions. Between 1990 and 2019, emissions from this sector decreased by 5%. In 2019
GHG emissions from the energy supply sector accounted for 21% of emissions and have
decreased by 66% since 1990 due to changes in the electricity mix. Emissions from the
residential sector accounted for around 15% of emissions in 2019; and since 1990
emissions from this sector have decreased by 14%.
16SECURITY OF SUPPLY
Reliability – gas and electricity capacity margins – maximum supply and
maximum demand 1993/94 to 2020/21
Source: National Grid and BEIS
Whilst energy security is complex to measure and subsequent charts on individual fuels
provide fuller insight, this chart aims to provide a view on it by looking at the difference
between maximum supply and demand for gas and electricity.
From 2007/08 to 2014/15 the electricity capacity margin mainly increased year on year,
due to both a decrease in peak demand and an increase in capacity. However, from
2013/14 to 2016/17 the capacity of major power producers fell faster than peak demand
due to plant closures and conversions. This resulted in the capacity margin falling from a
peak of 44% in 2013/14 to 27% in 2016/17, the lowest since 2008/09. Whilst embedded
renewables capacity increased over that period, the intermittent nature of solar and wind
meant it did not cover the drop due to closures of major power producers. A drop in peak
demand in 2018/19 and an increase in renewable generation capacity saw the margin rise
to 43% before falling back to 32% in 2020/21 due to the closure of coal-fired plants.
Since 2008/2009 the gas capacity margin has been wider than historically seen because
of the increased supply from the three liquefied natural gas terminals that came onstream
in 2008. A recent peak in maximum demand was seen in 2017/18, the highest since the
winter of 2010/11 and following severe weather brought over by the ‘Beast from the East’.
Despite this the capacity margin remained one-third higher than demand. The supply
margin in 2020 remains within roughly 60 per cent of maximum capacity.
17COAL
Coal production and imports, 1990 to 2020
Imports
Surface mining
Deep mined
Million tonnes
1990 2000 2010 2018 2019 2020
Deep mined 72.9 17.2 7.4 0.02 0.1 0.1
Surface mining
19.9 14.0 11.0 2.8 2.5 1.6
(including slurry)
Total 92.8 31.2 18.4 2.8 2.6 1.7
Coal imports 14.8 23.4 26.5 10.1 6.2 4.5
In 2020 UK coal production fell to an all-time low of 1.7 million tonnes, 35% lower than in
2019. Following closure of the last three deep mines in 2015 (Hatfield, Thoresby and
Kellingley), production fell to a fraction of the previous values. At 107 thousand tonnes,
deep mined coal comprises 6% of total production. In 2020 surface mine production fell by
37% to a new record low of 1.6 million tonnes. This is as a result of mine closures and
falling demand for coal for electricity generation.
Imports started in 1970 and grew steadily. In 2001 imports exceeded the level of UK
production for the first time. As annual levels of UK coal production continued to fall,
imports continued to grow and in 2006 reached a new record of 50.5 million tonnes.
Demand from electricity generators declined over the next five years and imports fell
accordingly. However, in the three years from 2011, higher gas prices led to greater
demand for coal from electricity generators and imports rose again up to 2013 when they
stood at 50.6 million tonnes, just above the 2006 record. From 2014 to 2017 imports fell
once more, rose in 2018 before falling again in 2019 and 2020. In 2020 imports were 4.5
million tonnes, a 37-year low in 2020.
18COAL
Coal consumption, 1990 to 2020
Power stations
Other energy industries
Industry
Domestic
Million tonnes
1990 2000 2010 2018 2019 2020
Power stations 84.0 46.2 41.5 6.7 2.9 2.3
Domestic 4.2 1.9 0.7 0.5 0.5 0.5
Industry 6.3 1.9 2.0 1.7 1.4 1.3
Services 1.2 0.1 0.1 0.1 0.1 0.04
Other energy industries 12.5 9.8 7.1 3.1 3.1 2.9
Total consumption 108.3 59.9 51.4 12.1 8.0 7.0
In 1990 coal generation was 84 million tonnes and fell steadily after 1991 until 1999. After
rising to an 11 year high in 2006 (57 million tonnes), coal used by generators fell steadily
between 2006 and 2009 before stabilising then increasing sharply in 2012 due to high gas
prices, which allowed coal fired stations to generate electricity at a lower cost than some
gas fired stations. Coal use in electricity generation has fallen since 2012, due to an
overall decline in coal power station capacity. In 2020 coal use in electricity generation fell
to a record low of 2.3 million tonnes.
Demand for coal-fired electricity generation had continued to fall as production favoured
gas, partly due to the carbon price per GWh being higher for coal. Carbon price is a
charge on those who emit CO2 for their emissions. Also, the increase in nuclear and
renewables production contributed to the decline of coal use. Additionally, generation
capacity which had fallen in recent years continued to fall and March 2020 saw the
closures of Fiddlers Ferry and Aberthaw B. There were only 4 major power stations
remaining at the end of 2020. Between April and June 2020, there was a record 67 day
period with no coal used in Great Britain, the longest since the 19th century. There was no
coal fired electricity on the GB grid for a further 55 days from 18th June.
19PETROLEUM
Foreign trade in crude oil and petroleum products, 1990 to 2020
60
50
40
£ billion
30
20
10
0
1990 1995 2000 2005 2010 2015 2020
Crude oil and petroleum products £ billion
1990 2000 2010 2018 2019 2020
Exports 8.1 15.5 32.9 40.8 41.2 23.9
Imports 6.4 9.7 35.0 40.4 39.1 21.8
Net Imports -1.6 -5.8 2.1 -0.4 -2.1 -2.2
Source: Office for National Statistics
Between 1980 and 2004, a surplus in trade led to oil contributing more than £93 billion to
the UK balance of payments. The largest surplus of £8 billion in 1985 reflected high crude
oil production and prices. However, in 2005, the UK became a net importer of oils with a
deficit of £1.3 billion, though still an exporter of some oil products. Between 2005 and 2017
the cumulative deficit amounted to £65.8 billion. Since the peak of £12.8 billion in 2012,
the deficit has fallen steadily, and in 2018 returned to a surplus as net imports of oils fell. In
2020, the surplus at £2.2 billion was broadly similar to the previous year despite a fall in
the net imports of oils as the UK imported less to meet reduced demand, as well as a
sharp fall of 34 per cent in crude oil prices (in £ terms) acquired at refineries, both due to
the impact of the Covid-19 pandemic.
20PETROLEUM
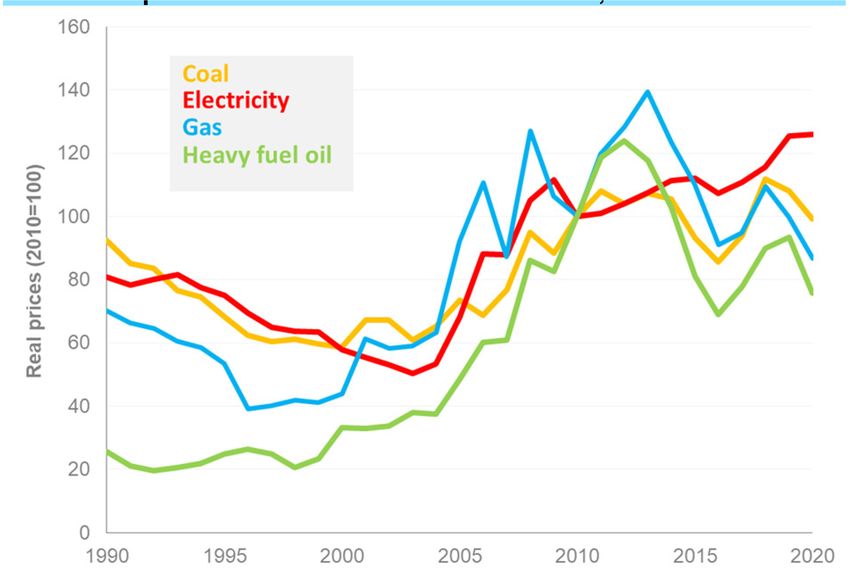
Demand by product, 1990 and 2020
Million tonnes
1990 2000 2010 2018 2019 2020
Energy uses*
Petrol 24.3 21.4 14.6 11.6 11.7 9.1
Road diesel 10.7 15.6 20.7 24.6 23.8 19.7
Jet fuel 6.6 10.8 11.1 12.3 12.3 5.0
Burning oil 2.1 3.8 4.0 3.4 3.2 3.5
Gas oil 8.0 6.8 5.1 5.4 5.1 4.3
Fuel oil 14.0 3.3 1.9 0.7 0.5 0.3
Other 5.0 5.3 6.1 4.9 4.9 4.3
Total energy uses 70.7 67.1 63.6 62.8 61.5 46.
Of which:
Transport fuels 43.5 49.5 48.1 50.0 49.4 34.9
Industry 7.2 5.5 5.1 2.4 2.1 2.0
Refinery fuel use 5.1 5.3 4.4 3.3 3.2 2.6
Non-energy uses 9.2 10.1 7.1 6.9 6.5 5.5
Total demand 79.8 77.2 70.7 69.7 68.0 51.8
* Energy uses includes uses for transformation (e.g. electricity generation) and energy industry own use
(e.g. refinery fuels)
In the long term, demand for oil products has been in decline since 1990 and the mix of
products consumed has changed dramatically. In 2020 this demand has fallen to an near
record low following the demand destruction caused by the Covid-19 pandemic. Whilst
transport demand has fallen 29 per cent on 2019 transports share of total oil demand
remains more than 70 per cent. Transport’s share of total oil demand is substantially larger
than in 1990 because the use of fuel oil for electricity generation has declined and
typically, as seen in 2019, air travel has become more common. However, whilst demand
for all transport fuels fell in 2020 it was jet fuel that fell the most, down 60 per cent on
2019, as international travel restrictions were put in place to curb the spread of Covid-19.
21PETROLEUM
Demand for road fuels, 1990 to 2020
Since the early 1990s there has been a marked trend of increasing demand for diesel and
reducing demand for petrol, with demand levels inverting by 2018. This was caused by the
increased use of diesel-fuelled cars and diesel for Light Goods Vehicles (LGVs). However,
diesel demand started to decline in 2018 and continued in 2019 following increases to the
tax rates charged for diesel vehicles. In 2020 this fall in diesel demand has been
exacerbated by the Covid-19 pandemic and resultant restrictions on travel. Total diesel
consumption fell to 19.7 million tonnes and petrol fell to 9.1 million tonnes, meaning
demand for road fuels was down 19 per cent on 2019. The fall in demand for diesel was
less that that seen for petrol, down 17 per cent, as commercial motor fleets (light and
heavy goods vehicles) continued to operate during periods of restricted travel. Whereas
petrol demand comes primarily from cars and taxis, and with restrictions in place on
discretionary travel demand fell 22 per cent. Demand for buses and coaches in 2020
remained below 1 million tonnes for the second consecutive year.
Demand for road diesel by vehicle type Thousand tonnes
1990 2000 2010 2018 2019 2020*
Car & taxi 980 4,110 8,590 11,039 10,672 8,828
Light goods vehicles 1,370 3,530 4,830 6,183 5,977 4,944
Heavy goods vehicles 6,370 6,150 5,940 6,392 6,179 5,111
Buses & coaches 1,640 1,530 1,380 1,013 979 810
Total 10,370 15,310 20,740 24,627 23,806 19,693
*Based on modelling by Ricardo Energy & Environment using data from the National Atmospheric Emissions
Inventory.
Demand for petrol Thousand tonnes
1990 2000 2010 2018 2019 2020
Total 24,300 21,400 14,600 11,584 11,713 9,144
22PETROLEUM
Road fuel demand during the Covid-19 pandemic
Average road fuel sales by fuel type (weekly moving average), Great Britain
1st December 2019 - 31st December 2020
Average Diesel Sales Average Petrol Sales
14000
PM address to the
UK lockdown: nation on coronavirus:
23 Mar 2020 10 May 2020 New national
12000 restrictions in England:
05 Nov - 02 Dec 2020
10000
8000
Litres
6000
4000
2000 Christmas Day Christmas Day
to New Year's to New Year's
Day 2019 Day 2020
0
Prior to the COVID-19 response, weekly metrics on forecourt sales of road fuels were not
provided. Throughout the pandemic it became increasingly clear that road fuel sales were
an effective indicator of activity during lockdowns, as well as being informative for industry
capabilities. As a result, throughout the pandemic weekly public updates of road fuels have
been published. Data provided is based on a sample of around 4,500 road fuel filling
stations, representing around 50% of total filling stations across Great Britain.
Following the implementation of lockdown restrictions on 23rd March 2020, both Diesel
and Petrol demand dramatically reduced. During the first eight weeks of national
restrictions, Diesel demand was down to 43% of typical demand* whilst Petrol was down
to 34%.
After the Prime Ministers address to the nation on the 10th May 2020, demand for both
fuels increased steadily. For the period 7th September to 19th October 2020, demand for
Diesel was 91% of typical demand and Petrol was 88%.
The second national lockdown in England (5th November – 2nd December 2020) had less
impact on road fuel sales than the first lockdown. The average Petrol sales reduced to
70% of typical demand, whilst average sales for Diesel was 81%. The greater impact on
average Petrol sales is largely due to the use of Diesel in commercial vehicles.
* Typical demand is calculated as the average demand levels for the eight weeks prior to first lockdown
restrictions, from 27th January 2020 to 22nd March 2020.
23OIL AND GAS PRODUCTION
UK Continental Shelf production, 1980 to 2020
280
240
Million tonnes of oil equivalent
200
160
120
80
Gas
40
Oil
0
1980 1985 1990 1995 2000 2005 2010 2015 2020
Million tonnes of oil equivalent
1990 2000 2010 2018 2019 2020
Oil 100.1 138.3 69.0 56.0 57.5 53.6
Gas 45.5 108.4 55.3 38.8 37.4 37.7
Total 145.6 246.7 124.3 94.9 94.9 91.4
Total indigenous oil and gas production in 2020 was down 3.7 per cent on 2019, with a 6.7
per cent decrease in oil production. Gas production remained stable.
Oil production was aided by the opening of the Clair Ridge field in late October 2018 as
well as the Harris and Catcher projects coming onstream in early 2019. However, volumes
remain at one-third of the peak in 1999. Since the turn of the century oil production has
been consistently decreasing until it reached an increase by 13 per cent from 2014 to 2015
and from then onwards, production levels were more stable. The decrease in oil
production in 2020 largely reflects the impact of the pandemic.
Gas production in 2020 was two-thirds lower than the record levels seen in 2000, and
since the turn of the century gas production has been decreasing rapidly until it reached an
uptick from 2015 to 2016 when new fields opened. The largest annual decrease of 20 per
cent was seen in 2011 and gas production also decreased by 46 per cent in the four years
to 2012.
24OIL AND GAS PRODUCTION
Oil and gas production and reserves, 1980 to 2020
* From 2015, contingent resources have been re-categorised and removed from the probable and
proven reserves category.
1990 2000 2010 2018 2019 2020
Oil Million tonnes
Cumulative production 1,374 2,570 3,446 3,811 3,860 3,909
Proven plus probable reserves 1,195 1,010 751 507 481 441
Total 2,569 3,580 4,197 4,318 4,341 4,350
Gas Billion cubic metres
Cumulative production 752 1,518 2,349 2,672 2,711 2,749
Proven plus probable reserves 1,200 1,195 520 279 260 221
Total 1,952 2,713 2,869 2,951 2,971 2,970
For both oil and gas, the volume produced plus proven and probable (2P) reserves have
grown substantially since 1980, more than doubling for oil and nearly doubling for gas. The
increases reflect new discoveries, new technology allowing exploitation of resources that
were previously regarded as uncommercial, and the inclusion of already-known fields as
they entered production or moved from 'prospective' to 'probable' status. (Note: this
volume for gas does not include estimates of shale gas). In 2018 the estimate of reserves
compared to the previous year increased for the first time since 1994 and continued to
increase slightly in 2019 and 2020.
The Glengorm discovery, announced in early 2019 and the largest gas discovery since
2008, was still considered contingent so is not featured here.
There was an apparent decline in reserves in 2015. This was due to re-classification of
some reserves that had not yet been sanctioned - these will be included in future as and
when sanctioned.
25NATURAL GAS
Natural gas demand, 1990 to 2020
TWh
1990 2000 2010 2018 2019 2020
Electricity generators 6.5 324.6 376.5 273.4 272.3 231.6
Energy Industries 39.2 102.1 95.9 88.4 91.2 88.6
Industry 164.6 198.5 118 109.2 108 99.3
Domestic 300.4 369.9 389.6 305.3 294.9 299.3
Services 86.4 110.5 101.6 92.3 93.2 89.6
Transport .. .. .. 0.1 0.2 0.3
Total 597.0 1,105.5 1,082.2 868.7 859.8 808.7
Following the expansion of UK production of natural gas in the early 1970s demand grew
rapidly, reaching a record high in 2004 of 1,125 TWh. Since then demand has seen an
overall decline, and in 2020 was nearly a third lower than the 2004 peak at 809 TWh. The
longer-term trends are driven by commodity prices and changes to energy efficiency,
whilst the year-to-year changes are mainly driven by temperature and shorter-term
fluctuations in prices.
Overall gas demand in 2020 fell by 5.9 per cent compared to 2019. Demand fell across
most sectors, particularly gas for electricity generation as the UK continues to add low
carbon sources to the grid. Restrictions in place to curb the Covid-19 pandemic heavily
impacted industry and commercial sectors. Conversely, Domestic consumption increased
by 1.5 per cent. This is despite 2020 being warmer than 2019, as households changed
their behaviours in line with stay-at-home orders.
26NATURAL GAS
UK trade in natural gas, 1990 to 2020
TWh
1990 2000 2010 2018 2019 2020
Natural gas production 528.8 1,260.2 642.5 451.2 434.8 438.3
Imports 79.8 26.0 614.5 519 511.2 478.2
of which LNG - 206.8 78.1 194.4 200.1
Exports - -146.3 -176.4 -84.8 -90.4 -105.9
Net imports (+) or exports (- +79.8 -120.3 +438.1 +451.2 +420.8 +372.3
UK gas production peaked in 2000 and has since been declining, making the UK
increasingly reliant on imports to meet demand. However, net imports fell in 2020 to 372
TWh as exports increased and imports were down from last year. Imports were down due
to lower demand, whilst exports increased largely because of increased trade with the
Netherlands. Despite the increase, exports remain below the long-run average. Imports
accounted for over half of UK supply in 2020.
Imports of Liquefied Natural Gas (LNG) were substantial in 2020, increasing on 2019 to
200 TWh. Imports of LNG were particularly high in the first half of 2020, reaching 62 per
cent of total imports in Q2. By contrast, the Netherlands and Norway saw significant falls in
their pipeline imports. Pipeline imports from the Netherlands fell by 36 per cent and
imports from the UK’s key supplier, Norway, fell by 11 per cent. As a result, LNG share
increased to 42 per cent of all total imports. Despite this, Norway remains the UK’s most
important trading partner and pipeline imports from Norway accounted for 55 per cent of
imports in 2020. The UK has a diverse pipeline infrastructure (from Norway, the
Netherlands and Belgium) and the proportion delivered through each route in the future
will depend on global market conditions.
27ELECTRICITY
Electricity generated by fuel type, 2019 and 2020
TWh
1990 2000 2010 2018 2019 2020
Coal 229.9 120.0 107.6 16.8 7.0 5.5
Oil & other fuels* 20.7 13.6 10.5 9.3 9.2 10.2
Gas 0.4 148.1 175.7 131.5 131.9 111.4
Nuclear 63.2 85.1 62.1 65.1 56.2 50.3
Hydro 5.6 5.1 3.6 5.4 5.8 6.8
Wind & Solar - 0.9 10.3 69.6 76.4 88.5
Other renewables - 4.3 12.3 35.0 37.3 39.3
Total electricity generated 319.7 377.1 382.0 332.7 323.8 312.0
*Includes generation from pumped storage.
Total electricity generated decreased by 3.6% between 2019 and 2020, due to the
reduction in electricity demand resulting from the Covid-19 pandemic. The share of
electricity generated from coal fell a further 0.3 percentage points from 2.1% to 1.8%,
continuing a long-term downwards trend. The share of electricity generation from gas
decreased from 40.7% to 35.7%, while the share from nuclear decreased from 17.4% to
16.1%. The decline in electricity supplied from fossil fuels was enabled by increased
generation from renewables, which increased its share of generation from 36.9% to a
record 43.1%.
The increase in renewables’ generation came after unusually high wind speeds during
Quarter 1 of 2020. Further details on renewable electricity generation can be found on
page 33.
28ELECTRICITY
Electricity supplied by fuel type, 1990 to 2020
The mix of fuels used to generate electricity continues to evolve. Since 1990 the decline of
coal and the rise of gas, and in more recent years renewables, have been the most
marked features, but none of these fuels have followed a smooth path.
Coal recorded its highest level for ten years in 2006 as nuclear station availability was
reduced and as a substitute for high priced gas. Coal use trended downwards until 2010
when higher winter electricity demand resulted in an increase from coal, then rose in 2012
due to high gas prices. Subsequently, supply from coal has fallen each year due to plant
closures and conversions, this trend continued in 2020 with coal generation reaching a
new record low of 5.2 TWh.
Between 1990 and 2008, supply from gas rose significantly from 0.4 TWh to a peak of 173
TWh in 2008. Subsequently, supply has fluctuated with a large increase in 2016, but
decreases in 2017 and 2018. From 2019 to 2020, supply from gas decreased by 16% to
109.3 TWh due to the fall in electricity demand during the Covid-19 pandemic.
Supply from nuclear grew to a peak in 1998 before falling back, particularly during 2006 to
2008, as station closures and maintenance outages reduced supply, but recovered in 2009
before falling in 2010 due to further outages. Nuclear supply has fluctuated since 2010;
although a decrease has been seen over the last four years. Nuclear supply dropped 11%
from 2019 to 2020, to 45.7 TWh.
Supply from wind and solar has followed an upward trend since 2000 as generation
capacity increased each year. From 2017, wind and solar supply have increased
substantially due to increased capacity. In 2020, supply from wind and solar was up 16%
on 2019 to 88.5 TWh due to favourable weather conditions as well as continued increased
capacity.
Total electricity supplied rose continuously from 1997 to reach a peak in 2005. It has
subsequently fallen, reflecting lower demand due to improved energy efficiency as well as
economic and weather factors with supply in 2020 22% lower than that in 2005.
29ELECTRICITY
Electricity capacity, 1996 to 2020
GW
1996 2000 2010 2018 2019 2020
Conventional Steam (1) 43.0 36.8 36.3 18.0 12.4 10.8
CCGT 12.7 22.9 34.1 32.3 31.5 31.8
Nuclear 12.9 12.5 10.9 9.3 9.3 8.1
Pumped Storage 2.8 2.8 2.7 2.7 2.7 2.7
Renewable (2) 2.3 3.0 9.3 44.1 46.8 47.8
Total 73.6 77.9 93.2 106.4 102.7 101.2
(1) Includes coal, non-CCGT gas, oil and mixed/dual fired. Does not include thermal renewables.
(2) Renewable capacity is on an Installed Capacity basis. Data for other fuels/technologies relates to
Declared Net Capacity from 1996 to 2005, data for 2006 onwards is transmission entry capacity (TEC)
Installed capacity for electricity generation in the UK increased gradually between 1996
and 2018, from 73.6 GW to 101.2 GW. In 2019 and 2020, total capacity fell following the
closure of several large coal-fired plants, and the mix of plants shifted towards renewable
different technologies. Overall, there has been a decline in conventional steam,
outweighed initially by an increase in combined cycle gas turbines (CCGT) and more
recently by an increase in renewables.
CCGT capacity increased almost threefold over the period 1996-2012, from 12.7 GW to
35.5 GW. This figure fell over the following years before increasing again in 2016 - 2018 to
33.6 GW. In 2020, CCGT capacity was similar to the 2019 figure at 31.8 GW.
Conventional steam capacity decreased between 2019 and 2020 to 10.8 GW.
Nuclear capacity in 2020 was 8.1 GW. The decreased capacity compared to 2019 reflects
the decision not to restart generation at Dungeness B after a prolonged outage.
Renewables capacity has seen a significant increase, with an installed capacity in 2020 of
47.8 GW. This is more than 20 times the capacity in 1996. Most of the renewable
technologies saw an increase in capacity between 2019 and 2020, with a particularly large
increase in capacity for offshore wind (up 5 per cent).
30ELECTRICITY
Microgeneration capacity, 2010 to 2020
Cumulative Installed Capacity (MCS) MW
2010 2012 2014 2016 2018 2019 2020
Micro CHP 0 1 1 1 1 1 1
Anaerobic Digestion 5 50 151 292 295 295 295
Hydro 12 41 78 183 224 225 225
Wind 21 167 449 702 753 753 753
Photovoltaics 79 1,728 2,928 4,896 5,213 5,403 5,532
Total 117 1,986 3,607 6,074 6,485 6,677 6,805
Source: Microgeneration Certification Scheme (MCS). Based on monthly extract of MCS database.
At the end of 2020 6,805 MW of capacity (around 1,045,000 installations) was installed,
around 1.9% more confirmed capacity (and 3.5% more installations) than at the end of
2019. This is a figure that is liable to revision. Nearly all of the installations and new
capacity was Solar PV. Microgeneration capacity increased rapidly between 2010 and
2016 but the rate of increase has slowed since then.
These figures are based on MCS data. Registering with MCS was a pre-requisite for the
Feed in Tariff (FiT) scheme. The FiT scheme was introduced on 1st April 2010 and is a
financial support scheme for eligible low-carbon electricity technologies, aimed at small-
scale installations up to a maximum capacity of 5 Megawatts (MW). The FiT scheme
closed to new entrants at the end of March 2019.
However, not all MCS Installations are accredited on FiTs, including all new installations
since April 2019. At the end of March 2019, 88% of the MCS installations were accredited
on the CFR, accounting for 96% of capacity (6,340 MW out of 6,604 MW).
These figures do not currently include unsubsidised installations below 1MW capacity that
are not registered on the MCS. We are reviewing data sources to improve coverage.
31RENEWABLES
Renewable energy sources, 2020
Thousand tonnes of oil equivalent
1990 2000 2010 2018 2019 2020
Solar PV, active solar and
geothermal 6 12 42 1,143 1,136 1,186
Wind and marine 1 81 885 4,894 5,487 6,482
Hydro (small and large scale) 448 437 309 468 503 581
Landfill Gas 80 731 1,725 1,298 1,202 1,160
Sewage gas 138 169 295 407 434 440
Wood (domestic and industrial) 174 458 667 1,050 1,104 1,115
Municipal Waste Combustion 101 375 632 1,464 1,625 1,677
Heat pumps 1 0 778 1,034 1,081 1,125
Transport biofuels 0 0 1,218 1,371 1,736 1,638
Cofiring 0 0 625 0.2 0.3 0.0
Biomass* 72 265 1,054 7,806 8,451 8,952
Total 1,021 2,529 8,229 20,928 22,758 24,355
*Includes plant and animal biomass, anaerobic digestion and biogas injected into the gas grid
In 2020, bioenergy accounted for about 61% of renewable energy sources used, with most
of the remainder coming from wind (27%), solar (4.8%) and heat pumps / deep geothermal
(4.5%).
Of the 24.3 million tonnes of oil equivalent of primary energy use accounted for by
renewables, 18.1 million tonnes were used to generate electricity, 4.5 million tonnes were
used to generate heat, and 1.6 million tonnes was used for road transport. Renewable
energy use grew by 6.7% between 2019 and 2020 and has increased almost tenfold on
the 2000 total.
32RENEWABLES
Electricity generation from renewable sources since 2000
TWh
2000 2010 2018 2019 2020
Onshore wind 0.9 7.2 30.4 31.8 34.7
Offshore wind - 3.1 26.5 32.0 40.7
Solar PV - 0.0 12.7 12.6 13.2
Hydro 5.1 3.6 5.5 5.9 6.8
Landfill Gas 2.2 5.2 3.9 3.6 3.5
Other Bioenergy 1.7 7.0 31.1 33.7 35.8
Total Renewables 9.9 26.2 110.0 119.5 134.6
Electricity generated from renewable sources increased by 13% between 2019 and 2020
to a record 134.6 TWh. The large increase is mostly due to favourable weather conditions,
as installed capacity grew only marginally.
Total wind generation increased by 18% to a record 75.4 TWh thanks to exceptionally
strong wind speeds; within this, offshore wind generation rose by over 27% to 40.7 TWh,
surpassing onshore wind at 34.7 TWh. Wind generation was particularly high during
Quarter 1 of 2020, when storms Clara and Dennis hit the UK. Average onshore wind
speeds in 2020, at 9.1 knots, were 0.8 knots higher than in 2019.
Hydro generation increased by 15% in 2020, largely due to an increase in average rainfall,
which was up by 23% on 2019. Generation from solar PV increased by 4.6%, following a
small increase in capacity and average sun hours (up 0.2 hours in 2020). Generation from
bioenergy and waste (excluding landfill gas) increased by 6.3%.
Renewable electricity accounted for a record 43.1% of electricity generated in the UK
during 2020, more than 6 percentage points higher than in 2019. The map on page 34
shows installed wind capacity for onshore and offshore sites across the UK.
33RENEWABLES
UK Onshore and Offshore Wind Capacity
34COMBINED HEAT AND POWER
Combined heat and power, 1991 to 2020
1995 2000 2010 2019 2020
CHP electrical capacity (MWe) 3,354 4,451 5,949 6,078 6,129
CHP electrical generation (GWh) 14,778 25,245 26,764 23,573 23,912
CHP heat generation (GWh) 56,833 54,877 48,262 41,765 42,056
Number of CHP sites
100 kWe to 1 MWe 397 533 762 1,336 1,376
>1 MWe to 2 MWe 26 41 83 210 216
> 2 MWe to 10 MWe 113 141 138 255 259
> 10 MWe + 63 64 66 68 69
Total 1,219 1,339 1,454 2,578 2,659
In 2020 CHP electrical capacity increased by 0.8% compared to 2019 with less than 300
new schemes (3%). Electricity generation in 2020 was 1.4% higher than in 2019, while
heat generation increased by 0.7%. Schemes larger than 10 MWe represent 69% of the
total electrical capacity of CHP schemes whereas schemes less than 1MWe constitute the
majority (79%) of the number of schemes. In 2020 CHP schemes accounted for 7.7% of
the total electricity generated in the UK and 8.1% of UK gas demand.
35ENERGY EFFICIENCY
Energy intensity, 1990 to 2020
140
120
Index (1990=100)
100
80
60
Road freight transport per tonne-km
40 Road passenger transport per passenger-km
Domestic sector per household
20 Service sector per unit of value added
Industrial sector per unit of output
0
1990 1995 2000 2005 2010 2015 2020
Tonnes of oil equivalent
1990 2000 2010 2018 2019 2020p
Industrial energy consumption 155.2 125.9 103.9 87.2 85.5 87.2
per million units of GVA
Domestic energy consumption 1.8 1.9 1.8 1.4 1.4 1.4
per household
Service sector energy 25.9 22.3 16.6 15.1 14.7 15.3
consumption per million units of
GVA
Road passenger energy 42.7 41.9 39.2 34.8 33.8 33.2
consumption per million
passenger-kilometres*
Road freight energy 86.6 79.8 91.4 96.0 94.0 89.5
consumption per million
freight-kilometres*
* BEIS estimates for 2020.
Energy consumption per unit of output, known as energy intensity, gives a broad indication
of how efficiently energy is being used over time. Changes in energy intensity occur for
several reasons: process change, technological change and structural change (in the case
of industry and the service sector) as well as efficiency change. The largest falls in energy
intensity over the last thirty years or so have occurred in the industrial sector mainly due to
structural change in the period before 2000, and in the service sector due to general
energy efficiency improvements. In the domestic sector there has been a general
downward trend in domestic consumption since 2005, due to improvements in energy
efficiency measures. The falls in the road passenger and freight categories in 2020 are a
direct result of the Covid-19 pandemic.
36ENERGY EFFICIENCY
Number of homes with energy efficiency measures, December 2015 to
December 2020
Cavity wall insulation Loft insulation >= 125mm
18
16
Number of homes (millions)
14
12
10
8
6
4
2
0
2015 2016 2017 2018 2019 2020
Insulated homes in Great Britain (Thousands)
End of year 2015 2016 2017 2018 2019 2020
Cavity wall insulation 13,320 13,560 13,820 14,090 14,350 14,560
Loft insulation >= 125mm 15,890 16,060 16,250 16,470 16,680 16,860
Source: BEIS, Household Energy Efficiency (HEE) National Statistics, detailed report 2020. Full details on
how these estimates are constructed, based on the new methodology, can be found in the HEE statistics
methodology note. Figures are rounded to the nearest ten thousand.
Cost effective methods of improving energy efficiency in homes are to install cavity wall
and loft insulation where these measures are practical. Building Regulations require new
homes to reach thermal efficiency standards which would typically be met by installing
these measures. In addition, existing homes have had these measures retrofitted through
Government schemes or through a DIY loft insulation. These data show the change in the
number of insulated homes as a result of new build and retro fitting insulation.
The number of homes with cavity wall insulation has increased by 9% between the end of
December 2015 and December 2020 such that 14.6 million, of the 20.8 million homes with
cavities, are insulated. The number of homes with loft insulation, of a depth of at least
125mm, has increased by 6% between the end of December 2015 and December 2020
meaning that 16.9 million of the 25.4 million homes with lofts are insulated to this level.
37ENERGY EFFICIENCY
Smart meters in Great Britain, December 2012 to December 2020
Total meters (Thousands)
End of year 2012 2013 2014 2015 2016 2017 2018 2019 2020
Domestic
Smart 3 265 671 2,320 4,947 8,976 14,514 19,164 22,170
Non-smart 47,726 47,509 45,455 47,831 45,598 41,583 36,522 32,681 30,267
Non-domestic*
Smart 454 529 522 811 924 1,061 1,135 1,313 1,476
Non-smart 2,424 2,307 2,197 2,523 2,421 2,270 2,092 1,887 1,807
Source: BEIS, Smart Meter Statistics, Q4 2020.
*Non-domestic sites include small and microbusinesses; Smart in non-domestic sites includes both Smart
and Advanced meters.
Smart meters are replacing traditional gas and electricity meters as part of an
infrastructure upgrade for Great Britain. Smart meters enable consumers to track their
energy use, prepayment customers to top-up credit from home, automatic meter reads and
accurate billing, and technologies such as electric vehicles to be cost-effectively integrated
with renewable energy sources. These data show the growth in the number of smart
meters operating in Great Britain between 2012 and 2020.
At the end of December 2020 there were 23.6 million smart meters operating in Great
Britain, including 19.1 million that were smart meters operating in smart mode or advanced
meters. At the end of 2020, 42% of all meters in domestic households were smart,
compared to 45% in smaller non-domestic sites. Overall, 42% of all meters in domestic or
smaller non-domestic sites were smart, an increase of five percentage points from the end
of 2019.
38FUEL POVERTY
Households in fuel poverty, 2010 to 2019
Fuel poverty in England is now measured using the Low Income Low Energy Efficiency
(LILEE) indicator which replaced the Low Income High Costs (LIHC) indicator.
Under LILEE, a household is considered to be fuel poor if: they are living in a property with
a fuel poverty energy efficiency rating of band D or below; and where they to spend the
required amount to heat their home, they would be left with a residual income below the
official poverty line.
• The proportion of households in England in fuel poverty was estimated to have
decreased by 1.6 percentage points from 2018 to 13.4 % in 2019 (approximately
3.18 million households).
• In 2019, the average fuel poverty gap (the reduction in fuel bill that the average fuel
poor household needs in order to not be classed as fuel poor) in England was
estimated at £216, down slightly from £225 in 2018 in real terms following a steady
downward trend since 2014.
• The lower number of households in fuel poverty also caused the aggregate fuel
poverty gap for England to continue to decrease in 2019 (by 15.1 % in real terms) to
£687 million.
Key drivers of fuel poverty, 2018-2019
• Energy efficiency – improvement in energy efficiency between 2018 and 2019 has
brought more low income households to band C which removes them fuel poverty.
• Incomes – incomes increased at the median rate of increase for households near
the low income threshold so the share of households in relative poverty remained
similar.
39FUEL POVERTY
Low income households by FPEER1 band, 2010 to 2019
A/B/C
D
E
F
G
In December 2014 the Government introduced a new statutory fuel poverty target for
England. The target is to ensure that as many fuel poor homes as reasonably practicable
achieve a minimum energy efficiency rating of Band C by 2030 (with interim milestones to
lift as many fuel poor homes in England as is reasonably practicable to Band E by 2020;
and Band D by 2025).
The way Government monitors progress changed under the LILEE metric announced in
February 2021, since a household that achieves a fuel poverty energy efficiency rating of
band C or above would not be measured as fuel poor, and therefore fuel poverty would be
eradicated if all low income households achieved an energy efficiency band C rating.
Progress towards the fuel poverty target is now measured as the share of all low income
households who achieve an energy efficiency band C in 2030 and the interim milestones.
In 2019, further progress was made towards the interim 2020 fuel poverty target, with 97.4
% of all low income households living in a property with a fuel poverty energy efficiency
rating of Band E or above.
Target year Fuel poverty 2010 (%) 2019 (%) Percentage
target point change
2020 Band E or 91.5 97.4 5.9
above
2025 Band D or 64.6 88.8 24.2
above
2030 Band C or 14.6 47.8 33.2
above
1
Fuel poverty energy efficiency rating (FPEER)
40You can also read