Australia Pacific LNG Project - Volume 3: Gas Pipeline Chapter 4: Climate and Climate Change Adaptation - Australia Pacific ...
←
→
Page content transcription
If your browser does not render page correctly, please read the page content below
Australia Pacific LNG Project
Volume 3: Gas Pipeline
Chapter 4: Climate and Climate Change Adaptation
Volume 3: Gas Pipeline
Chapter 4: Climate and Climate Change Adaptation

Contents

4             Climate and climate change adaptation............................................................................. 1

     4.1      Introduction ........................................................................................................................ 1

     4.2      Climate ............................................................................................................................... 1

              4.2.1        Climate over the pipeline area .............................................................................. 1

              4.2.2        Wind speed and direction...................................................................................... 2

              4.2.3        Temperature and solar radiation ........................................................................... 3

              4.2.4        Rainfall .................................................................................................................. 3

              4.2.5        Relative humidity ................................................................................................... 4

              4.2.6        Surface pressure ................................................................................................... 4

              4.2.7        Climate extremes .................................................................................................. 4

              4.2.8        Impacts of weather patterns and extremes of climate on project ......................... 7

     4.3      Climate change .................................................................................................................. 7

              4.3.1        Methodology.......................................................................................................... 8

              4.3.2        Climate projections................................................................................................ 8

              4.3.3        Climate change adaptation ................................................................................. 15

              4.3.4        Cooperative approach to climate change adaptation.......................................... 18

     4.4      Conclusion ....................................................................................................................... 18

              4.4.1        Assessment outcomes ........................................................................................ 18

              4.4.2        Commitments ...................................................................................................... 23

References ...................................................................................................................................... 24

Figures
Figure 4.1 Tropical cyclones within 200km of Roma (1906–2006) (BOM 2009d) ................................. 5

Figure 4.2 Storm tide height above highest astronomical tide (metres) – Queensland east coast
locations................................................................................................................................................... 6

Figure 4.3 Cities for which climate change predictions are presented by CSIRO ............................... 10

Figure 4.4 Estimated increases in high sea-level events (0.1m and 0.5m)(DCC 2009) ...................... 12

Figure 4.5 Storm tide, wave setup, wave run-up (Queensland Government 2001)............................. 13

    Australia Pacific LNG Project EIS                                     Page ii                                                           March 2010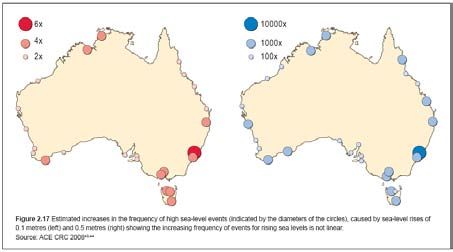
Volume 3: Gas Pipeline
Chapter 4: Climate and Climate Change Adaptation

Tables
Table 4.1 Summary of Bureau of Meteorology monitoring stations and parameters............................. 2

Table 4.2 Project gas fields and gas pipeline areas – annual average thunder days, total lightning
flash density and cloud-to-ground flash density ...................................................................................... 7

Table 4.3 Mean degrees temperature change for St George and Rockhampton (°C)1 ....................... 11

Table 4.4 Mean rainfall change for St George and Rockhampton (%)1 ............................................... 11

Table 4.5 Global average sea rise scenarios (metres) ........................................................................ 12

Table 4.6 Storm tide ARI for Gladstone (DNRM 2004) ........................................................................ 13

Table 4.7 Total storm tide water level estimate.................................................................................... 14

Table 4.8 Percentage of relative humidity change (CSIRO 2009) ....................................................... 14

Table 4.9 Percentile change in fire risk from average 1974-2007 levels in Charleville ....................... 15

Table 4.10 Percentile change in fire risk from average 1974-2007 levels in Rockhampton ................ 15

Table 4.11 Summary of environmental values, sustainability principles, potential impacts and
mitigation measures .............................................................................................................................. 20

  Australia Pacific LNG Project EIS                                  Page iii                                                       March 2010
Volume 3: Gas Pipeline
Chapter 4: Climate and Climate Change Adaptation

4         Climate and climate change adaptation

4.1       Introduction
This chapter provides information on the existing climate of the south central Queensland region and
explores predictions of climate change in the region of the Australia Pacific LNG Project's gas pipeline.
The gas pipeline route spans from Curtis Island on the coast, to south central Queensland near Roma.
It describes the potential impacts of climate change on the gas pipeline and associated works based
on current knowledge.

Greenhouse gas (GHG) emissions, their impacts and mitigation strategies specific to the gas pipeline
are discussed in detail in Volume 3 Chapter 14.

This chapter addresses 3.1.1 Climate and 3.1.2 Climate Change Adaptation of the environmental
impact statement (EIS) terms of reference in Sections 4.2 and 4.3.

Throughout the life of the Australia Pacific LNG Project (the Project), including site preparation,
construction, operation, decommissioning and rehabilitation, the Project will be influenced by the
climate. The Australia Pacific LNG's sustainability principles will be applied to developing strategies for
the gas pipeline to ensure that climate induced impacts do not cause conditions which adversely
impact the Project or the environment.

Of Australia Pacific LNG's 12 sustainability principles, as discussed in the sustainability chapter
Volume 1 Chapter 3, the relevant sustainability principles for climate over the pipeline are as follows:

    • Minimising adverse environmental impacts and enhancing environmental benefits associated
      with Australia Pacific LNG's activities, products or services; conserving, protecting, and
      enhancing where the opportunity exists, the biodiversity values and water resources in its
      operational areas

    • Identifying, assessing, managing, monitoring and reviewing risks to Australia Pacific LNG's
      workforce, its property, the environment and the communities affected by its activities.

Under these principles, climate and climate change values are reflected by identifying and assessing
climate change risks, and developing climate change adaptation strategies to mitigate its impact on
project assets and activities.

4.2       Climate

4.2.1     Climate over the pipeline area
Information in this section relates to climate in the south central region of Queensland. Meteorological
data from the Bureau of Meteorology (BOM) monitoring stations at Taroom near the middle of the gas
pipeline and Thangool, near the north of the gas pipeline and just south of Biloela (BOM 2009a), have
been used to characterise the climate in the region along the Australia Pacific LNG gas pipeline route.

The Taroom and Thangool monitoring stations have been selected for their close proximity to the
proposed gas pipeline and the availability of data. The meteorological parameters measured at the
Taroom and Thangool monitoring stations include long-term temperature, solar radiation, atmospheric
pressure, rainfall and relative humidity. The parameters used from each site are summarised in Table
4.1. Refer to Volume 5 Attachment 30 for more details.

 Australia Pacific LNG Project EIS                Page 1                                       March 2010
Volume 3: Gas Pipeline
Chapter 4: Climate and Climate Change Adaptation
The gas pipeline traverses from the gas fields region to the coastal LNG facility. Information from BOM
stations located at Roma, Miles and Dalby for the gas fields, and Gladstone airport and Radar Hill for
the Gladstone area, are provided in Volume 2 Chapter 4 and Volume 4 Chapter 4 respectively.
Table 4.1 Summary of Bureau of Meteorology monitoring stations and parameters
Region Location Latitude/longitude Record Parameters
period
Taroom Post 25.64 °S 1870 – 2009 Temperature, solar exposure, relative humidity,
Office rainfall and surface pressure
149.80 °E
Thangool Airport 24.49 °S 1929 – 2009 Temperature, solar exposure, relative humidity,
rainfall and surface pressure
150.57 °E
Of the climatic conditions presented in this section the main element raised is that construction be
done during the 'dry season', where practicable, for elements such as the construction of gas pipeline
creek crossings. The more extreme weather events include big storms, floods, heat waves and
bushfires which may result in impacts such as sedimentation, erosion, stormwater management,
containment of waste in bunding and tailings dams, health and safety risks to personnel and
interruption to transportation.
These impacts are discussed further in Volume 3 Chapter 11 – Water resources, Volume 3 Chapter 5
– Topography, geomorphology, geology, soils and land contamination and Volume 3 Chapter 17 –
Traffic and transport. The construction methods and management strategies for these issues are dealt
with in Volume 3 Chapter 24 – Environmental management plans, which include management
measures for sediment and erosion control, geology and soils, transport, surface water, and health
and safety.
4.2.2 Wind speed and direction
The monitoring stations BOM operates at Taroom and Thangool are the closest monitoring stations to
the Project's gas pipeline. However, BOM do not operate automatic weather stations at these
locations, so hourly average recordings of wind speed and directions are not collected. Therefore, the
following information is from the CALMET meteorological model. Refer to Volume 3 Chapter 13 for
more information.
The available information suggests that Taroom is a relatively light wind site, with an average 9:00am
wind speed of 2.3m/s and an average 3:00pm wind speed of 2.75m/s. The wind direction is generally
variable from the north to west south west, with a small percentage of winds from the northwest
predominantly during spring.
The available information suggests Thangool has distinct variation in wind direction over the seasons.
There is a slight predominance of easterly winds accounting for 30% of the summer wind. Autumn
shows a distinct preference of southeasterly and southwesterly winds, with very little wind from the
west to north sector. Winter is dominated by southwesterly winds, attributable to the passage of cold
fronts, accounting for 46% of the wind. Spring also shows a distinct preference to northwesterly and
northerly winds, most likely due to the initialization of the Australian monsoon and the development of
the Cloncurry heat low.
Australia Pacific LNG Project EIS Page 2 March 2010Volume 3: Gas Pipeline Chapter 4: Climate and Climate Change Adaptation At the start of the gas pipeline, the wind speed and direction characteristics of the gas fields are predominantly north and northeasterly the year round and tend to be of moderate wind speed the majority of the time. Refer to Volume 2 Chapter 4 for more information on the climate of the gas fields. At the end of the gas pipeline, diurnal variations in wind flow across the Gladstone region are strongly influence by sea breezes, resulting in a high percentage of easterly daytime winds. The sea breeze generally develops around 10:00 to 11:00am each day, and is often preceded by a shift in wind direction from the more southerly and westerly night time drainage flows. The wind speeds recorded at Gladstone airport indicate the sea breezes recorded in this region are predominantly greater than five metres per second. Refer to Volume 4 Chapter 4 for more details on the climate of Gladstone. 4.2.3 Temperature and solar radiation The average maximum daily temperature recorded at the sites during summer ranges from 33.3°C at Taroom to 33.2°C at Thangool. The average minimum daily temperature recorded at the sites during winter ranges from 5.9°C at Taroom to 6.3°C at Thangool. On average, daily temperatures tend to increase to the north across the project area, with Thangool typically recording higher temperatures throughout the year than Taroom to the south. Average daily solar exposure (MJ/m2) at Taroom and Thangool shows a seasonal pattern whereby summertime solar exposure is 1.6 times greater than that of the winter time. At the start of the gas pipeline, the daily temperatures tend to increase to west across the gas fields area, with Roma typically recording higher temperatures (33.4°C) than Miles to the east and Dalby (31.8°C) further to the east. Refer to Volume 2 Chapter 4 for more details on the climate of the gas fields. At the end of the gas pipeline, in Gladstone, the annual average maximum temperature of 27.2°C and an average minimum temperature of 18.0°C. Refer to Volume 4 Chapter 4 for more details on the climate of Gladstone. 4.2.4 Rainfall The annual pattern of rainfall illustrates the sub-tropical climate in the region where 52% (Taroom) and 54% (Thangool) of the annual precipitation occurs during the monsoonal months of November to February. The annual average rainfall across the region ranges between 661mm at Thangool and 671mm at Taroom, with the maximum monthly average rainfall occurring in January at both Thangool (97mm) and Taroom (98mm). Annual rainfall predominantly occurs during the monsoonal summer. While this area is considered to have a sub-tropical climate the relatively low amount of annual rainfall illustrates the dry, semi-arid nature of the central Queensland region. On average, the total rainfall during the monsoonal months is marginally more than twice that of the drier months. Taroom peak rainfall events are typically higher (up to two times) than the more northerly Thangool region. At the start of the gas pipeline, the rainfall characteristics of the gas fields have been described as subtropical, where 50% (Roma), 51% (Miles) and 57% (Dalby) of annual precipitation occurs during the monsoonal months. The annual average rainfall across the region ranges between 558mm at Roma and 649mm at Miles. Refer to Volume 2 Chapter 4 for more details on the climate of the gas fields. Australia Pacific LNG Project EIS Page 3 March 2010
Volume 3: Gas Pipeline
Chapter 4: Climate and Climate Change Adaptation

At the end of the gas pipeline, the rainfall characteristics of Gladstone are consistent with the
subtropical climate. The annual average rainfall at Radar Hill is 873.2mm/year. Refer to Volume 4
Chapter 4 for more details on the climate of Gladstone.

4.2.5     Relative humidity
Relative humidity has been analysed from long-term averages based on daily measurements collected
at 9:00am and 3:00pm at Taroom and Thangool. The analysis indicates the cooler late autumn and
winter months (May to July) tend to be marginally more humid than the warmer spring and summer
months (September to December). This trend appears to be more significant for relative humidity in
the morning than in the afternoon when surface heating has taken place all day, as the range in the
monthly averages is greater during the morning than in the afternoon. The analysis also indicates the
highest average relative humidity in the afternoon is in February, while in the morning the highest
monthly average occurs in June.

In regard to average daily variations, the analysis indicates relative humidity is, on average, 62%
higher at 9:00am than at 3:00pm across the region.

4.2.6     Surface pressure
Monitoring data from Taroom and Thangool have been used to characterise the mean sea-level
pressure in the region during the period 2002 to 2009.

The longer term cycles are evident in the seasonal fluctuations of mean sea-level pressure, which
fluctuates around an average pressure of 1019 hectopascals (hPa) during the drier winter months
(May to August), and 1011hPa during the wetter summer months (November to February) for both
Taroom and Thangool. Within this seasonal cycle, mean sea-level pressure fluctuates on a diurnal
basis between three to four hectopascals, with solar heating of the ground during the midday to
afternoon period, reducing the atmospheric pressure above the ground. At night when the temperature
falls, atmospheric pressure increases again.

At the start of the gas pipeline, the surface pressure characteristics in the gas fields fluctuate around
1020hPa in the drier winter months (May to August) and 1010hPa during the wetter summer months
(November to February). Refer to Volume 2 Chapter 4 for more details on the climate of the gas fields.

At the end of the gas pipeline, the surface pressure characteristics of Gladstone are low pressure
during January and July, and high pressure during April and October. Refer to Volume 4 Chapter 4 for
more details on the climate of Gladstone.

4.2.7      Climate extremes

Droughts
Periodic drought is part of the Australian weather pattern. Major Australian droughts that have affected
this region include 1963-68, 1972-73, 1982-83 and 1991-95 (BOM 2009b).

Part of Gladstone Regional Council and all of Banana Shire and Western Downs Regional Council are
currently 'drought declared' with some areas of the gas pipeline drought declared since 2000
(Department of Primary Industries and Fisheries 2009).

 Australia Pacific LNG Project EIS               Page 4                                      March 2010
Volume 3: Gas Pipeline
Chapter 4: Climate and Climate Change Adaptation
Floods
The proposed gas pipeline route crosses watercourses at 27 locations. This represents the larger
creeks and the Calliope River, which fall within three river basins; the Condamine, Dawson and
Coastal (refer to Volume 3 Chapter 11 – Water resources).
According to the BOM, 'major floods generally only occur in the first half of the year although records
indicate they may also occur in late spring' (BOM 2009c).
In the coastal region, which the gas pipeline traverses, most of the region's recorded flood events are
typically due to tropical cyclone activity occurring within the summer months. Ex-tropical cyclone Beni
brought small-scale flooding to the greater Gladstone area, which occurred in February 2003 within
the Boyne River catchment.
The gas pipeline creek crossings will need to be constructed during the 'dry' season where practicable
to minimise flood impact risks, construction delays and damage to plant and machinery.
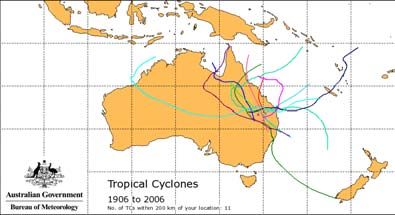
Tropical cyclones
The gas pipeline region spans from Curtis Island on the coast to south central Queensland near
Roma. Queensland is susceptible to cyclones which develop over tropical waters in northern Australia.
While there are more cyclones over the coast, there were 11 tropical cyclones within a 200km radius
of Roma from 1906 to 2006 (BOM 2009d). Figure 4.1 includes notable tropical cyclone events such as
Althea, Wanda, Cliff and Gertie.
Tropical cyclone Gertie
Tropical cyclone Althea
Tropical cyclone Wanda
Tropical cyclone Cliff
Figure 4.1 Tropical cyclones within 200km of Roma (1906–2006) (BOM 2009d)
Storm surge and storm tide
When tropical cyclones track over the ocean their extreme winds and low pressure result in an
elevated dome of water travelling as a long period wave. As this surge approaches the coastline, it
can be affected by the seabed slope and coastline shape causing it to amplify in height. When this
surge is combined with the normal tide on the day, it becomes a storm tide at landfall.
Australia Pacific LNG Project EIS Page 5 March 2010Volume 3: Gas Pipeline
Chapter 4: Climate and Climate Change Adaptation
Tropical cyclone tracks are erratic and difficult to predict in advance, although research and
technology are leading to improvements in this capability. This means severe weather warnings are
also improved and consequently mitigative measures are increasingly more reliable.
Less intense tropical cyclone activity and extra-tropical low pressure systems producing surges most
likely would go unnoticed when combined with the lower tide ranges. Nevertheless, these can alter the
normal currents and water levels from their predicted or forecast values. The occurrence of a major
storm tide in Gladstone is primarily dependent on tropical cyclone track direction, forward speed, the
radius to maximum winds and the wind strength due to the cyclone central pressure, coupled with the
state of the tide at the time the cyclone makes landfall.
Storm tide studies have been undertaken for most of the Queensland coastline. Figure 4.2 shows
storm tide heights above highest astronomical tide (HAT) for selected locations along the east coast
and Gladstone is highlighted (orange border). Each coloured vertical bar corresponds to a nominated
average return period (ARI). Gladstone is one of the locations with a higher storm tide risk profile and
its vulnerability to inundation will depend on elevations of existing urban areas and the design level of
the gas pipeline reclamation areas.
2.0
500 - 1000 yr
Potential local wave setup and run-up not included 100 - 500 yr
50 - 100 yr
0 - 50 yr
1.5
Height above HAT (m)
1.0
0.5
0.0
Gold Coast
Mackay
Gladstone
Mourilyan
Cairns
Hervey Bay
Cooktown
Lucinda
Bundaberg
Brisbane
Cardwell
Townsville
Yeppoon
Bowen
Figure 4.2 Storm tide height above highest astronomical tide (metres) – Queensland east coast
locations
Frequency of thunderstorms and lightning strikes
The frequency of thunderstorms has been estimated from maps developed by the BOM for Australia.
The BOM has analysed ten years (1990 to 1999) of records of thunder-days from 300 monitoring sites
around Australia to produce a map of average annual thunder-days. A thunder-day is defined as 'an
observational day...during which thunder is heard at the station. Precipitation need not occur'
(Huschke 1959). An observational day is defined from midnight to midnight local standard time.
The frequency of lightning activity has been estimated from maps of lightning flash density developed
by the BOM. Eight years of data has been analysed (1995 to 2002) from ground-based lightning
Australia Pacific LNG Project EIS Page 6 March 2010Volume 3: Gas Pipeline
Chapter 4: Climate and Climate Change Adaptation
detectors and NASA satellite-based instruments. The lightning flash density is defined as the number
of flashes of a specific type occurring over unit area in unit time (Kuleshov et al. 2006). Total flash
density is made up of cloud-to-ground flashes and intracloud flashes. Total flash density and cloud-to-
ground flash densities are presented here.
Table 4.2 summarises the thunder-day and lightning flash density information for the Australia Pacific
LNG gas fields and gas pipeline.
Table 4.2 Project gas fields and gas pipeline areas – annual average thunder days, total
lightning flash density and cloud-to-ground flash density
Parameter Australia Pacific LNG
gas-fields and pipeline
Thunder days (annual average – 1990-1999) 10 to 30 thunder-days per year
Total lightning flash density1 (annual average – 1995-2002) 5 to 10 flashes per km2 per year
Cloud-to-ground lightning flash density2 (annual average – 1995-2002) 1 to 3 flashes per km2 per year
1
Total lightning flash density: flashes per square kilometre per year
2
Cloud-to-ground flash density: flashes per square kilometre per year
4.2.8 Impacts of weather patterns and extremes of climate on project
When designing and constructing the gas pipeline, particular regard has been given to the historical
weather patterns and climate extremes. The south central Queensland region has a sub-tropical
climate, which is characterised by a moderately distinctive wet and dry season, high temperatures and
humidity.
Historical weather patterns show that summertime weather activity generates the wetter spring and
summer months relative to the drier autumn and winter months when the solar incidence is less
intense. Construction methods and scheduling will be implemented in a way that ensures personnel
and the environment is protected. Methods and timing of construction include ensuring erosion and
sediment control measures and stormwater management measures are appropriately constructed and
sized to deal with anticipated amount of rainfall and appropriate shelter is available for the workforce in
chances of severe weather. Appropriate personal protection will be given to personnel to protect them
from the weather.
Overall, south central Queensland does not experience a typical weather pattern that will restrict
construction or operation. The inclusion of appropriate measures, such as site stormwater
management systems, and waste containment systems will ensure personnel and the environment
are protected.
Further information regarding mitigation measures can be found in Volume 3 Chapters 5, Volume 3
Chapter 9 and Volume 3 Chapter 11.
4.3 Climate change
While there are inherent uncertainties surrounding predicted impacts, this section describes the gas
pipeline vulnerabilities to climate change and identifies possible adaptation strategies.
Australia Pacific LNG Project EIS Page 7 March 2010Volume 3: Gas Pipeline
Chapter 4: Climate and Climate Change Adaptation
4.3.1 Methodology
Effective climate change adaptation requires an awareness of the risks posed by climate change, and
an understanding of the relative significance of those risks.
A climate change adaptation risk assessment was conducted to assess how alterations to weather
patterns and rising sea level have the potential to impact on the gas pipeline. The climate change
predictions from Commonwealth Scientific and Industrial Research Organisation (CSIRO), which has
published the most comprehensive data to date, were compiled ahead of a climate change adaptation
risk assessment workshop.
The risk assessment process was conducted in accordance with the Risk Management Standard
AS/NZS 3100:2009 and the Australian government publication 'Climate Change Impacts & Risk
Management – A Guide for Business and Government' (2006). Attendees at the workshop included
key decision-makers on the Project, along with engineers and environmental specialists. Risks
identified were analysed and assessed using the Australia Pacific LNG risk matrix (refer to Volume 1
Chapter 1) and then screened for identification of mitigation measures. Existing measures were
explored during the risk assessment process and further mitigation actions were brought forward to be
included into the design criteria and operating strategies.
The climate change risk assessment process was conducted to assess the project's vulnerabilities to
climate change and describe possible and preferred adaptation strategies. This was a requirement of
the EIS terms of reference Section 3.1.2 – Climate change adaptation. The climate projections used in
the risk assessment are provided in Section 4.3.2. Section 4.3.3 provides the risk mitigation measures
which treat the identified risks and have been incorporated into the design criteria and operating
strategies.
Australia Pacific LNG's cooperative approach to adaptation to climate change is described in
Section 4.3.4.
4.3.2 Climate projections
To assess the project's vulnerability to climate change, predictions have been gathered from CSIRO,
and the Queensland Government. These are referenced in the sections below.
CSIRO projections are available for years 2030, 2050 and 2070. The Project is estimated to operate
for 30 years starting in 2014 with LNG production train, making projections for 2050 the most fitting
scenario. Where appropriate 2050 projections have been used, but where predictions are published
only for the 2030 and 2070 time horizons, both have been reported and used in the assessment
process.
The emissions scenarios referred to in this chapter include A1B, B1 and A1FI (CSIRO 2008), where:
• B1 scenario refers to a global agreement that brings about dramatic reductions in global
emissions.
• A1B scenario refers to mid range levels of global emission.
• A1FI scenario refers to high levels of emissions, in line with recent global emissions.
Changes in the climate of Australia by 2030 do not vary greatly from one emission scenario to
another. However, changes by 2070 are heavily dependent on the emission scenario, because the
scenarios are highly divergent beyond 2030. The best projections for the region have been sought, but
the models have not all been based upon the same emissions scenarios.
Australia Pacific LNG Project EIS Page 8 March 2010Volume 3: Gas Pipeline Chapter 4: Climate and Climate Change Adaptation Several cities have climate change predictions presented in the Climate Change in Australia Cities Summaries (CSIRO 2007) including St George and Brisbane, as shown in Figure 4.3 . For this study, predictions for St George have been considered as representative of the geographical region of central south Queensland while predictions for Brisbane, Rockhampton and Gladstone have been considered as representative of the region of the east coast of Queensland. Australia Pacific LNG Project EIS Page 9 March 2010
K:\ORIGIN\301001-00448\GIS\Maps\00448-00-EN-DAL-2342-Rev0(Vol3Chp4_Climate_MajorTowns).wor

                                                                       LEGEND

                                      Major town
                                      Cities with climate change predictions
                                      Major drainage and waterbodies
                                      Major road

   SOURCE INFORMATION
   Major drainage and waterbodies (based on 250k topography)
     Commonwealth of Australia (Geoscience Australia) 2009                                                                                                                                                                                                                                                                               AUSTRALIA PACIFIC LNG PROJECT
   Roads and Towns
     Department of Main Roads 2009
                                                                                                                                                                                                                                                                                                                                 Volume 3 Chapter 4
                                                                                                                                                                                                                                                                                                                          Figure 4.3 - Cities for which climate
                                                                                                                                                                                                                                                                                                                           change predictions are presented
                                                                                                                                                                                                                                                                                                                                        by CSIRO
© Commonwealth of Australia (Geoscience Australia) 2010, © The State of Queensland (Department of Natural Resources and Water) 2010, © WorleyParsons Services Pty Ltd Users of the information recorded in this document (the Information) accept all responsibility and risk associated with the use of the Information and should seek independent professional advice in relation to dealings with property. Despite Department of Natural
Resources and Water (NRW)'s best efforts, NRW makes no representations or warranties in relation to the Information, and, to the extent permitted by law, exclude or limit all warranties relating to correctness, accuracy, reliability, completeness or currency and all liability for any direct, indirect and consequential costs, losses, damages and expenses incurred in any way (including but not limited to that arising from negligence) in connection
with any use of or reliance on the Information.
Volume 3: Gas Pipeline
Chapter 4: Climate and Climate Change Adaptation
Temperature change
The information in Table 4.3 summarises the predicted mean temperature change for St George in the
south central Queensland region, and Rockhampton in the Gladstone region. The table provides the
10, 50 and 90th percentiles of the likely change in the mean temperature. In St George by 2050, the
predicted increase in mean temperature is 3.6°C, which was chosen as the basis for determining
climate change impacts in the risk assessment.
To calculate the average temperature in 2050, the predicted mean temperature change of 3.6°C is
added to the historical average temperature.
In Rockhampton by 2050, the predicted increase in average temperature is 1.4°C.
Table 4.3 Mean degrees temperature change for St George and Rockhampton (°C)1
2030 2050
Average (50%) Range (10–90%) Average (50%) Range (10–90%)
St George 1.1 0.7 1.6 3.6 2.4 5.2
Rockhampton 0.8 0.6 1.2 1.4 1.0 2.0
1 A1B Predictions (2030) and A1FI (2050), 50% percentile and range (CSIRO 2007)
Precipitation change
The information in Table 4.4 summarises the predicted percentage of rainfall change for St George in
the south central Queensland region, and Rockhampton in the Gladstone region. The table provides
the 10, 50 and 90th percentiles of the likely change in the mean precipitation. In St George by 2050,
the predicted decrease in mean rainfall is 10% annually. This has been chosen as the basis for
determining climate change impacts in the risk assessment.
To calculate the average precipitation in 2050 the predicted mean precipitation change 10% is
subtracted from the historical average precipitation (CSIRO 2007).
In Rockhampton by 2050, the predicted decrease in mean rainfall is 5.4% annually.
Table 4.4 Mean rainfall change for St George and Rockhampton (%)1
2030 2050
Average (50%) Range (10–90%) Average (50%) Range (10–90%)
St George -3 -12 5 -10 -35 17
Rockhampton -3.2 -10.1 4.2 -5.4 -17.2 7.1
1 A1B Predictions (2030) and A1FI (2050), 50% percentile and range (CSIRO 2007)
As well as a decrease in annual rainfall, an increase in daily precipitation intensity (rain per rain-day)
and the number of dry days is also predicted. The future precipitation regime will have longer dry
spells interrupted by heavier precipitation events. Changes to extreme events would have the potential
to increase erosion and flood frequency, with implications for agriculture, forestry, river flow, water
quality, and the design standards of infrastructure. Drought occurrence is projected to increase over
most of Australia (CSIRO 2007).
Australia Pacific LNG Project EIS Page 11 March 2010Volume 3: Gas Pipeline
Chapter 4: Climate and Climate Change Adaptation
Sea level rise
Sea level rise is not anticipated to affect the majority of the gas pipeline, since it begins at the gas
fields around 400km inland and 200 metres above sea level, and traverses the landscape to
Gladstone.
The information in Table 4.5 summarises the predicted rise in global sea level. Global climate models
indicate mean sea level rise on the east coast of Australia may be greater than the global mean sea
level rise. Scenario 3 (high end) was developed considering the possible high end risk identified in
Intergovernmental Panel on Climate Change (IPCC) fourth report, and includes some new evidence
on icesheet dynamics (Department of Climate Change (DCC) 2009).
Table 4.5 Global average sea rise scenarios (metres)
Year Scenario 1 Scenario 2 Scenario 3
B1 A1FI High end
2030 0.132 0.146 0.200
2070 0.333 0.471 0.700
Source: DCC (2009)
As shown in Figure 4.4, an increase in sea level causes a non-linear increase in frequency of high
sea-level events (DCC 2009). For the Gladstone region, for a 0.1 metre sea level rise, the frequency
of high sea-level events increases two-fold. For a 0.5 metre sea level rise, the frequency of high sea-
level events increases by 1,000 times.
Figure 4.4 Estimated increases in high sea-level events (0.1m and 0.5m) (DCC 2009)
Storm surge and storm tides
Storm tide is not anticipated to affect the majority of the gas pipeline as it begins at the gas fields
around 400km inland and 200 metres above sea level and traverses the landscape to Gladstone.
Australia Pacific LNG Project EIS Page 12 March 2010Volume 3: Gas Pipeline
Chapter 4: Climate and Climate Change Adaptation
A study by the former Department of Natural Resources and Mines (DNRM) (2004) to determine the
frequency of occurrence of storm tides for open waters in Queensland, including Gladstone, predicted
storm tides for both present conditions and those where the implications of climate change are
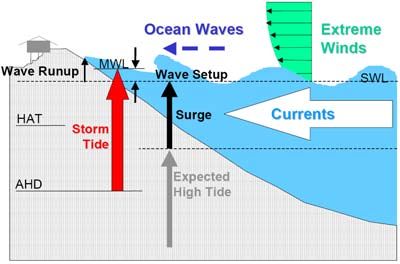
represented. Storm surge levels are not total water levels – total water levels consist of other
components such as wave setup and run-up associated with a wave zone, as shown in Figure 4.5.
For open waters in Gladstone (Auckland Point) the 2004 study predicted storm tide levels as provided
in Table 4.6. This study assumed the climate change scenarios based on a 50-year planning period.
The report provides results based on the combination of three scenarios, being a mean sea level rise
of 0.3m by 2050, an increase of 10% in frequency of tropical cyclones, and a pole ward shift of 1.3°
and increase of 10% in maximum intensity of tropical cyclones. These three scenarios are not the
same at the IPCC models (A1B, B1 and A1FI) but are the most relevant and available storm tide
prediction data for this region.
Table 4.6 Storm tide ARI for Gladstone (DNRM 2004)
Location Storm tide ARI (m AHD)
100 year 500 year 1000 year
2004 Climate 2004 Climate 2004 Climate
Change Change Change
Gladstone 2.82 3.33 3.51 4.18 3.80 4.41
Storm Tide = astronomical tide + storm surge + wave setup + waves
(Queensland Climate Change and Community Vulnerability to Tropical Cyclones Ocean hazard Assessment – Stage 1, 2001)
Figure 4.5 Storm tide, wave setup, wave run-up (Queensland Government 2001)
To estimate total water levels in Gladstone for a 100-year average recurrence interval (ARI) storm tide
event, the 2004 study was used as a starting point. Wave heights can be estimated for a 1 in 50 year
wind speed and combined with the storm tide. Table 4.7 summarises components of the indicative
total water level.
Australia Pacific LNG Project EIS Page 13 March 2010Volume 3: Gas Pipeline
Chapter 4: Climate and Climate Change Adaptation
Storm tide, an allowance for wave setup and crest level combine to give the total water level of 5.6m
above Australian height datum (AHD). Wave crest level is derived from the significant wave height and
contains some profile asymmetry associated with the highest waves.
Table 4.7 Total storm tide water level estimate
Significant wave height 1 in 100 yr
Storm tide (incl. climate change) (DNRM 2004) 3.33 m AHD
Wave setup allowance 0.4 m
Wave crest (1 in 50yr AEP) 1.8 m
Total water level 5.6 m AHD
Humidity
The information in Table 4.8 summarises the predicted percent of relative humidity change for St
George and Brisbane. The table provides the 10, 50 and 90th percentiles of the likely change in the
humidity. By 2070 the predicted change in average humidity is -1.6% which has been chosen as the
basis for determining climate change impacts in the risk assessment. To calculate the average
humidity in 2070, the predicted percent of relative humidity change of -1.6% is added to the historical
average relative humidity. By 2070 the predicted change in average humidity is -0.2%.
Table 4.8 Percentage of relative humidity change (CSIRO 2009)
2030 2070
% Range (A1B) % Range (A1F1)
St George -0.5 -1.7 0.7 -1.6 -5.6 2.2
Brisbane -0.1 -1.1 0.7 -0.2 -3.6 3.0
Cyclones
There are three components of tropical cyclones combining to make the total hazard – strong winds,
intense rainfall and induced ocean effects including extreme waves. Climate change may affect the
frequency, severity, unpredictability and position of cyclones. There is some indication precipitation
rates may increase by 20% to 30% during tropical cyclones (CSIRO 2007). Precipitation change and
extreme waves have been discussed in Section 4.3.2.
Projections of tropical cyclones in the Australian region are limited, but the available studies suggest
there maybe an increase in the number of tropical cyclones in the more intensive categories
(Categories 3 to 5) but a possible decrease in the total number of cyclones (Department of Climate
Change 2009)
Bushfires
Projections of fire risk have been undertaken in the vicinity of the gas pipeline, from Charleville to
Rockhampton for 2020 and 2050 (Lucas et al. 2007). Fire risk is a rating calculated based on
observations of temperature, relative humidity and wind speed combined with an estimate of the fuel
state to predict the fire behaviour (Lucas et al. 2007).
Australia Pacific LNG Project EIS Page 14 March 2010Volume 3: Gas Pipeline Chapter 4: Climate and Climate Change Adaptation Changes in the risk of fire are summarised as percentile differences from 1974 to 2007 levels in Table 4.9 and Table 4.10. The authors of this study have used two global warming scenarios, low (Mark2) and high (Mark3). These scenarios are consistent with, but not the same as, the IPCC models (B1, A1B and A1FI) (CSIRO 2008) Projections for 2050 in Charleville indicate that when the global warming scenario is low, the fire risk rises +39.4%. When the global warming scenario is high, the fire risk increases by 204.9%. These percentage changes are relative to small baseline frequencies, where at present (1973 to 2007) the annual average number of extreme fire danger days at Charleville is 6.8 days and in a high global warming scenario the prediction is 20.9 days by 2050. Projections for 2050 in Rockhampton indicate that when the global warming scenario is low, the fire risk rises +5%. When the global warming scenario is high, the fire risk increases by 140%. These percentage changes are relative to very small baseline frequencies, where at present (1973 to 2007) the annual average number of extreme fire danger days at Rockhampton is 0.6 days and in a high global warming scenario the prediction is 1.5 days by 2050. The bushfire risk tends to decrease to the north and east of the project area, correlating to the climate which becomes wetter closer to the tropical north and closer to the Queensland coast. Table 4.9 Percentile change in fire risk from average 1974-2007 levels in Charleville Global warming scenario 2020 2050 Low (Mark2) 19 39.4 High (Mark3) 49.6 204.9 Source: Lucas et al. 2007 Table 4.10 Percentile change in fire risk from average 1974-2007 levels in Rockhampton Global warming scenario 2020 2050 Low (Mark2) 5 5 High (Mark3) 30 140 Source: Lucas et al. 2007 4.3.3 Climate change adaptation The following sections describe the climate change risk mitigation measures that have been incorporated into the design criteria and operating strategies. Alternative and further adaptation measures have been considered and documented in the risk assessment process, and will be taken forward into the design phases of the project. Climate change risk will continue to be reviewed during project implementation. Elevated temperatures Design for flexibility in relation to operating temperatures is part of the design considerations. Safe work procedures will be implemented for hot conditions. These measures, which are included in the design of the gas pipeline and associated infrastructure, assist in adapting to climate change. Australia Pacific LNG Project EIS Page 15 March 2010
Volume 3: Gas Pipeline
Chapter 4: Climate and Climate Change Adaptation

The residual risk to the gas pipeline was determined to be negligible.

Precipitation change
During heavy rainfall intensity events, safe systems of work are to be implemented. This will include
the management of journey management plans, taking into consideration BOM storm warning and
weather forecasts, and providing safe driver training to personnel. Design of water crossing, pond
walls, roads and other water affected infrastructure will be designed to standards which include safety
contingencies for increased intensity of precipitation events.

Changes in precipitation frequency may cause groundwater levels to decrease. The use of treated
associated water is designed to be used by the project for all the Project's water needs where
possible, to prevent increased pressure on groundwater resources.

Erosion which may result from precipitation intensity and frequency change will be treated with
engineering solutions in accordance with erosion control guidelines.

These measures, which are included in the design of the gas pipeline and associated infrastructure,
assist in adapting to climate change.

The residual risk to the gas pipeline and associated infrastructure was determined to be low. This
relates to the potential for increased intensity of rainfall to cause localised flooding of water affected
infrastructure, such as ponds and water course crossings.

Humidity
The impacts of humidity change are considered to be low because the decrease is still well within the
design range of the gas pipeline and associated infrastructure.

The residual risk to the gas pipeline and the associated infrastructure was determined to be negligible.

Sea level change
Sea level rise scenarios at the higher end were considered in the risk assessment process. For the
gas pipeline infrastructure, which will be placed under the floor of Gladstone Harbour, sea level rise is
unlikely to have any material effect.

The residual risk to the gas pipeline and the associated infrastructure was determined to be negligible.

Coastal erosion
Coastal erosion arises as a combination of more high intensity weather events, storm surge, currents
and extreme waves, more intense rainfall, wind action and higher sea level. For the gas pipeline
infrastructure, coastal erosion may also translate to higher erosion and displacement pressures on the
gas pipeline placed under the floor of the Narrows. The preferred method of design is to place the gas
pipeline using horizontal directional drilling or to provide erosion measures for trenches. The gas
pipeline will be covered by around 2m of existing stable sediment, and anti-scour materials will be
placed at development locations that are at risk of erosion.

These measures, which are included in the design of the gas pipeline, assist in adapting to climate
change. Further alternative adaptation measures which may be considered include slope stability
measures for the tidal flats.

The residual risk to the gas pipeline and the associated infrastructure was determined to be negligible.

 Australia Pacific LNG Project EIS                 Page 16                                       March 2010
Volume 3: Gas Pipeline
Chapter 4: Climate and Climate Change Adaptation

Cyclones
Structural elements for the gas pipeline and associated infrastructure will be designed and constructed
taking into consideration the building code for cyclone regions, with adjustment for more intense and
frequent cyclones.

To preserve the health and safety of the Project's workforce, the implementation of a journey
management system, emergency response plans, safe driver training and storm warnings for field
personnel will be included in the operations systems.

These measures, which are included in the design of the gas pipeline, assist in adapting to climate
change. Further alternative adaptation measures which may be considered include extended journey
management plans to include contact with onsite personnel about weather warnings and maintain
updates to Bureau of Meteorology weather forecasts, and design temporary accommodation facilities
and enclosures for extreme wind events.

The residual risk to the gas pipeline and the associated infrastructure was determined to be low. This
is due to the potential for more intense cyclones to present a health and safety risk to the workforce.

Flooding
The increase in precipitation intensity may result in increased localised areas of flooding.

To preserve the health and safety of personnel the implementation of a journey management system,
emergency response plans, safe driver training and storm warnings for field personnel will be included
in the operations systems.

These measures, which are included in the design of the gas pipeline, assist in adapting to climate
change. Further alternative adaptation measures which may be considered include multiple exit roads
for critical plant and infrastructure, to prevent road closures affecting access.

The residual risk to the gas pipeline and the associated infrastructure was determined to be low. This
is due to the potential for flooding to affect access to critical plant and infrastructure.

Bushfires
Bushfire breaks have been designed to maintain clearance around aboveground services and fenced
surface facilities. Weather forecasting services and fire danger warnings will be used to withdraw
personnel from high fire risk areas.

It is also the intention to continue to work cooperatively with the rural fire service to share information
and receive advice. Controlled burning will be used where appropriate to manage fire risk.

These measures, which are included in the design of the gas pipeline, assist in adapting to climate
change. Further alternative adaptation measures which may be considered include multiple exit roads
for critical plant and infrastructure to prevent road closures effecting access, and extended journey
management plans to include a fire danger strategy.

The residual risk to the gas pipeline and the associated infrastructure was determined to be low. This
is due to the potential for bushfires to affect associated infrastructure along the gas pipeline or
personnel working on the gas pipeline for maintenance.

 Australia Pacific LNG Project EIS                Page 17                                       March 2010
Volume 3: Gas Pipeline
Chapter 4: Climate and Climate Change Adaptation

4.3.4     Cooperative approach to climate change adaptation
Both Origin and ConocoPhillips work through the Australian Petroleum Production & Exploration
Association (APPEA) as an industry body. APPEA aims to work with governments to achieve credible
industry actions and governmental greenhouse policies that address greenhouse concerns in an
economically and commercially viable way. APPEA and its member companies are committed to
taking action on climate change, including the promotion of natural gas as apart of the Asia-Pacific
Economic Cooperation energy work.

APPEA member companies are also committed to reviewing (and if necessary adapting) their risk
management strategies (encompassing engineering design, safety and environmental assessments)
to reflect new learnings on the likely impacts of climate variability, to complement Government action,
to give the community greater confidence about how the greenhouse issue is being addressed
(APPEA 2003).

Australia Pacific LNG is involved in regular engagement with key governmental agencies. The aim of
meeting with these stakeholders is to share project information as it came to hand, seek guidance
about regulators' requirements and expectations for the EIS and approvals process, and to achieve
the Project's assessment and approval schedule. As part of this dialogue, the Project has met with the
Gladstone Ports Corporation and Maritime Safety Queensland. A cooperative relationship has been
established and will continue with these organisations and, where relevant, will discuss climate
change adaptation.

Australia Pacific LNG actively engaged with Department of Infrastructure and Planning and
Department of Employment, Economic Development and Innovation (DEEDI) through a number of
forums, including:

   • LNG Executive Group (DEEDI) – meetings approximately bi-monthly with other LNG proponents
     and senior departmental officers to discuss strategic policy matters

   • Common Issues Forum (DEEDI) – fortnightly meetings with other LNG proponents to discuss
     operational issues of a common nature to the industry, e.g. co-location of gas transmission gas
     pipeline common-user corridors established by the Queensland Government

   • LNG Industry Unit (DEEDI) – separate meetings with proponents are organised where
     instances of commercial confidentiality is required

   • APLNG EIS Project Group Meeting - EIS facilitation is provided through a Department of
     Infrastructure and Planning project manager and DERM representative each fortnight to ensure
     that industry is provided with prompt advice on any issues raised

   • Input into the Department of Infrastructure and Planning's Water Futures for the CSG water
     management policy being developed by the Coal Taskforce Unit.

Australia Pacific LNG undertakes to continue its cooperative approach with government, other industry
and other sectors to address adaptation to climate change. Australia Pacific LNG will take into account
climate change risks of flooding, temperature change and sea level rise in the design process.

4.4       Conclusion

4.4.1     Assessment outcomes
Climate change projections across the life of the Project will be minor in the context of the extremes in
climate already experienced within the south central Queensland region.

 Australia Pacific LNG Project EIS               Page 18                                      March 2010
Volume 3: Gas Pipeline Chapter 4: Climate and Climate Change Adaptation Gas pipeline infrastructure will be designed and constructed to cope with the existing climate and future potential climate change. Predicted changes in temperature, precipitation, cyclones and bushfires have been considered, and the vulnerabilities of the gas pipeline have been assessed using the appropriate risk assessment process. Potential consequences of climate change that have been considered include: • Exposure to higher temperatures • Flooding from intense rainfall • Reduction in rainwater availability • Wave inundation • Erosion • Damage from cyclonic conditions • Damage from bushfires. Design features for wind action, coastal erosion, flooding and bushfires have been incorporated into the design criteria and will continue to be considered during the detailed design phase. Strategies to mitigate climate change impacts during the construction and operation phases of the Project have been identified. It was concluded from the risk assessment discussed above that there is currently adequate design controls and strategies in place or planned for to adequately mitigate climate change risk. Climate change risk will continue to be assessed during further stages of project implementation. A summary of the environmental values, sustainability principles, potential impacts and mitigation measures in relation to climate and climate change associated with the gas pipeline is presented below in Table 4.11. This table also includes the residual risk levels for climate and climate change. A risk assessment has been undertaken to identify the potential risks, causes and consequences from the climate and climate change. Mitigation measures to reduce the risk have been nominated and the residual risk has been calculated. Further details on the risk assessment methodology are provided in Volume 1 Chapter 4. Australia Pacific LNG Project EIS Page 19 March 2010
Volume 3: Gas Pipeline
Chapter 4: Climate and Climate Change Adaptation

Table 4.11 Summary of environmental values, sustainability principles, potential impacts and mitigation measures

 Environmental values                Sustainability           Potential impacts                  Possible       Mitigation and management measures             Residual
                                      principles                                                  causes                                                       risk level

Life, health and wellbeing of   Minimising adverse          Sedimentation, erosion,       Extreme climate     Refer to construction methods outlined:         Low
people.                         environmental impacts       stormwater                    events:
                                                                                                                 •   Volume 3 Chapter 11– Water resources
                                and enhancing               management,
Diversity of ecological                                                                   Droughts
                                environmental benefits      containment of waste in                              •   Volume 3 Chapter 5 – Topography,
processes and associated
                                associated with Australia   bunding and tailings          Floods                     geomorphology, geology, soils and land
ecosystems.
                                Pacific LNG's activities,   dams, health and safety                                  contamination
                                                                                          Tropical cyclones
Interruption to business        products or services;       risks to personnel and
                                                                                                                 • Volume 3 Chapter 17 – Traffic and
construction, operation or      conserving, protecting,     interruption to               Storm surge and
                                                                                                                   transport.
decommissioning phases.         and enhancing where the     transportation                Storm tide
                                opportunity exists, the
                                biodiversity values and
                                water resources in its
                                operational areas

                                Identifying, assessing,     Increased health and          Elevated            Safe work procedures for hot conditions         Negligible
                                managing, monitoring        safety risk to personnel      Temperatures
                                and reviewing risks to
                                                            Heat damage to
                                Australia Pacific LNG's
                                                            infrastructure
                                workforce, its property,
                                the environment and the     Higher cooling and
                                communities affected by     energy demand
                                its activities.
                                                            Drought                       Precipitation       Design to accommodate erosion                   Low
                                                                                          change
                                                            Decreased water quality                           Journey management plans incorporating storm
                                                                                                              warnings and weather forecasts
                                                            Impacts on rivers and
                                                            wetlands                                          Safe driver training

 Australia Pacific LNG Project EIS                                                     Page 20                                                                March 2010
Volume 3: Gas Pipeline
Chapter 4: Climate and Climate Change Adaptation
Environmental values Sustainability Potential impacts Possible Mitigation and management measures Residual
principles causes risk level
Dust due to dry windy
conditions
Erosion & sedimentation
Increased overland flow
runoff
Impact on corrosion Humidity Gas pipeline inspection and maintenance program. Negligible
rates
Safe work procedures for hot conditions
Increase risk of heat
stress and dehydration
Inundation of gas Sea level change Gas pipeline design for inundation through the Negligible
pipeline at entry to Narrows
Gladstone harbour,
under Gladstone harbour
and rise onto Curtis
Island
Erosion of gas pipeline Coastal erosion Horizontal directional drilling (gas pipeline covered Negligible
by around four metres of existing stable sediment)
Displacement pressure
or erosion measures for trenching option
on gas pipeline
Anti-scour materials will be placed at development
locations at risk of erosion.
High wind speeds Cyclones Operational systems to include journey Low
effecting structures management plans, safe driver training and storm
warnings.
Australia Pacific LNG Project EIS Page 21 March 2010You can also read